Elliottwave-Forecast

Master Trader
Feb 17, 2017
2,460
9
84
www.elliottwave-forecast.com
In the aftermath of COVID-19 selloff, Alphabet (GOOGL) formed a low on March 23, 2020 at 1008.87. From there, the stock is rallying as a 5 waves impulsive Elliott Wave structure. Up from 3.23.2020 low, wave (1) ended at 1173.4 and wave (2) pullback ended at 1075.08. The stock then resumed higher in wave (3) towards 1297. The 45 minutes chart below shows the wave (3) rally. It then pullback in wave (4) to 1205. Subdivision of wave (4) unfolded as a zigzag where wave A ended at 1256.44, wave B ended at 1276.82, and wave C ended at 1204.68.

Wave (5) is currently in progress and unfolding as a 5 waves impulse in lesser degree. Up from wave (4) at 1205, wave 1 ended at 1288.15 and pullback in wave 2 ended at 1230. The stock then resumes higher again in wave 3. Near term, while dips stay above 1204.68, expect a few more highs to end wave (5). This should also complete wave ((1)) in higher degree and end cycle from March 23 low. Stock should then pullback in wave ((2)) to correct cycle from March 23 low in 3, 7, or 11 swing before turning higher again.

GOOGL 45 Minutes Elliott Wave Chart
 

Elliottwave-Forecast

Master Trader
Feb 17, 2017
2,460
9
84
www.elliottwave-forecast.com
In this blog, we are going to take a look at the Elliott Wave chart of CHFJPY. The 1 hour weekend chart update from 26 April shows that CHFJPY ended wave (ii) bounce at 111.39 high. From there, the pair extended lower and broke below previous wave (i) low. The decline ended at 109.83 low. The pair then bounced in 3 waves as a zig-zag. While below 111.39 high, the bounce is expected to fail and sellers are expected to appear for more downside. The 100% extension of wave a-b where wave c can potentially end is at 110.65 - 111.06 area. We show this area with a blue box. The blue box is the area where we expect sellers to appear for 3 waves pullback at least or an extension lower.

CHFJPY 4.26.2020 1 Hour Weekend Elliott Wave Update
CHFJPY 4.26.20 1 hour chart

The 1 hour NY chart update from 29 April shows that CHFJPY ended wave ii bounce at the blue box area at 110.65 high. From there, the pair continued to extend lower and broke below previous wave i low. Wave iii ended at 109.32 low and wave iv bounce ended at 109.78 high. The pair then extended another leg lower in wave v to end wave (iii) at 109.16 low. A 3 waves bounce in wave (iv) should follow after that. As long as the high at 111.39 stays intact, expect the bounce in 3,7, or 11 swings to fail again for more downside.

CHFJPY 4.29.2020 1 Hour NY Elliott Wave Update
CHFJPY 4.29.20 1 hour NY chart
 

Elliottwave-Forecast

Master Trader
Feb 17, 2017
2,460
9
84
www.elliottwave-forecast.com
Short Term Elliott Wave outlook in Tesla (TSLA) suggests the stock ended cycle from March low at 886.09 as wave ((1)). Internal of wave ((1)) unfolded as a 5 waves impulsive Elliott Wave structure. Up from 3.19.2020 low, wave (1) ended at 569 and pullback in wave (2) ended at 446.4. Tesla then continues higher in wave (3) towards 791 and wave (4) pullback ended at 673.79. The 45 minutes chart below shows a part of the impulsive move from wave (3). The stock then pullback in wave (4) to 673.79 as a double three. Down from 791, wave W ended at 712.21, wave X ended at 765.57, and wave Y ended at 673.79.

Final wave (5) has also ended at 886.09 as an impulsive structure in lesser degree. Up from 73.79, wave 1 ended at 712.77 and wave 2 pullback ended at 678.50. Wave 3 ended at 845, dips in wave 4 ended at 796.01, and final wave 5 ended at 886.09. The last move completed wave (5) and ended cycle from 3.19.2020 low in wave ((1)). Near term, while bounce stays below there, expect stock to continue lower to correct cycle from March 19 low in 3, 7, or 11 swing before the rally resumes.

TSLA 45 Minutes Elliott Wave Chart
Elliott Wave View: Tesla (TSLA) Correcting Cycle from March Low
 

Elliottwave-Forecast

Master Trader
Feb 17, 2017
2,460
9
84
www.elliottwave-forecast.com
Spain is one of the hardest hit European countries by Covid-19 pandemic. Unsurprisingly, Spain main index IBEX-35 plunged just like the rest of the world's indices. The biggest impact happened during the first few days of March. As of April 29, 2020, Madrid is the most affected city by Covid-19 with 60,000 people infected.

Impact of coronavirus outbreak on Spanish IBEX-35


In March, Spain had to impose short selling ban on dozens of stocks to stem the market rout. Spain's regulator said the short selling bank applies to 69 stocks, including all liquid shares. Italy, another hard hit European country also introduced similar short selling bank to 85 stocks. Short selling refers to the ability of traders to sell by borrowing the company stock, hoping to buy it back at lower price and profit from the difference. Such measures however tend to work only for short term to soften the impact of a shock.

The bans should expire in mid April, but it has been extended to 18 May, with possibility of further renewal. A new report from World Federation of Exchanges (WFE) warned that short selling bans reduce liquidity, increase price inefficiency and hamper price discovery, therefore contributing to further market volatility. Short sellers also contribute less to price declines compared to regular long sellers.

So will the short selling ban help IBEX-35 from further selloff? Let's take a look at the Elliott Wave technical outlook

IBEX monthly Elliott Wave Chart


Sequence from November 2007 high in IBEX-35 appears incomplete. Unless it truncates, the 100% extension can see the Index going to as low as 2514 as far as the rally fails below 11888. The decline from November 2007 can be counted as a zigzag where wave (a) ended at 6702.6 and wave (b) ended at 11888.6. Index has resumed lower in wave (c) with subdivision as 5 waves. Down from wave (b) at 11888.6, wave I ended at 7579.80 and wave II ended at 11184.40. Wave III of (c) remains in progress and rally should fail in 3, 7, or 11 swing against wave ((2)) high at 10100.2.
 

Elliottwave-Forecast

Master Trader
Feb 17, 2017
2,460
9
84
www.elliottwave-forecast.com
In this technical blog, we are going to take a look at the past performance of 1 hour Elliott Wave Charts of Tesla Motors ticker symbol: $TSLA. In which, the rally from 18 March 2020 low ($350.51) showed an impulse structure with an extended wave (3) higher suggested that another leg of strength in wave (5) should take place to complete the 5 waves impulse sequence. Therefore, we advised members not to sell the instrument & trade the no enemy areas ( blue boxes) as per Elliott wave hedging remained the preferred path looking for 3 wave reaction higher at least. We will explain the structure & forecast below:

Tesla 1 Hour Elliott Wave Chart
Tesla Elliott Wave View: Buying The Wave Four Pullback

Tesla 1 hour Elliott Wave Chart from 4/22/2020 Midday update. In which, the rally to $791 high ended wave (3) in lesser degree 5 wave structure. Down from there, the stock made a 3 waves pullback within wave (4). The internals of that pullback unfolded as a double three structure where wave W ended at $712.21 low. Wave X bounce ended at $765.57 high and wave C managed to reach the $687.43-$639.09 blue box area. From where the buyers were expected to appear in the stock looking for another 5 waves rally. Or to do a 3 wave reaction higher at least.

Tesla 1 Hour Elliott Wave Chart
Tesla Elliott Wave View: Buying The Wave Four Pullback

Here’s 1 Hour Elliott Wave Chart from 4/29/2020 Pre-Market update. In which the stock is showing reaction higher taking place from the blue box area. Allowed members to create a risk-free position shortly after taking a long position at $687.43-$639.09 blue box area.
 

Elliottwave-Forecast

Master Trader
Feb 17, 2017
2,460
9
84
www.elliottwave-forecast.com
The next entry in the theme of Corona Virus stocks is Sona Nanotech. Normally I would cover a major listed stock on a USA exchange. However, Sona Nanotech has an excellent Elliott Wave structure that is worth reviewing. SONA has exploded since early 2020 from a little known company to one partnered with the likes of GE Healthcare. Like all charts, It also remains very technical.

Sona Nanotech "produces high-quality gold nanorod products for diagnostic tests & medical treatment applications". Their claim to fame in the current market environment is developing a lateral flow test for COVID that is cheap and can be used at home.

Let's take a look at the charts (all prices are in $CAD)

Sona Nanotech Elliott Wave View
Sona Nanotech

Sona Nanotech set all time lows in late December 2019 at $0.01. From there a wave ((1)) top was set at $0.94 on March 3/2020. From there wave ((2)) is set at $0.455 on Mar 16/2020 and a wave ((3)) advance is proposed topped at $2.25 on April 13/2020. The current idea is a flat for Blue (2) presently underway before heading higher into a black ((5)) of Red I top. Invalidation level is 1.32, if this pivot gives then the odds increase that a long term top has been set. With that said, it does have room for one more leg up to complete the sequence from the all time lows. If it does decide to head up for one more high, it could be a long term top.
 

Elliottwave-Forecast

Master Trader
Feb 17, 2017
2,460
9
84
www.elliottwave-forecast.com
USDJPY Technical Analysis

On April 8/2020 I posted on social media (Stocktwits/Twitter) @AidanFX "USDJPY Break below 108.60 can push the pair lower towards 108 area"

USDJPY 1 Hour Chart April 9.2020 : The chart below was also posted on social media (StockTwits/Twitter) @AidanFX April 9/2020 showing that a bearish reciprocal AB=CD pattern (dark blue) has formed and the pair could make a move lower. I posted price broke below the SELL break level (green) and informed traders to watch for selling opportunities and to watch for a move lower towards the target levels. Indicators also needed to break below the trend lines (black) for more confirmation of downside momentum.


USDJPY, trading, elliottwave, technical analysis, forex, market patterns, AidanFX

USDJPY 1 Hour Chart April 14.2020 : The pair continues lower hitting target 3 (+150 pips) and indicators broke below the trend lines (black) confirming downside momentum.

USDJPY, trading, elliottwave, technical analysis, forex, market patterns, AidanFX

USDJPY 1 Hour Chart April 24.2020 : On April 24/2020 I posted the 2nd SELL setup (blue) calling for another extension lower. Price was respecting the moving average (purple) and a visible rectangle breakout pattern (dark blue) was forming. I informed traders to add sells on the break below the pattern breakout level.

USDJPY, trading, elliottwave, technical analysis, forex, market patterns, AidanFX

USDJPY 1 Hour Chart April 28.2020 : The pair breaks lower and hits the 1st entry (green) target 4 for +200 pips and hits the 2nd entry (blue) target 1 for +70 pips. New stop loss (pink) for both entries was set at the top of the dark blue rectangle pattern.

USDJPY, trading, elliottwave, technical analysis, forex, market patterns, AidanFX

USDJPY 1 Hour Chart May 1.2020 : At the end of April and the start of May the pair still has potential to make another round lower. The pair has retested a new support/resistance zone (light blue box) and was followed with a reaction lower. As long as price does not hit the protected stop loss (pink) we can expect another round lower and hit the target 5 (green) and target 2 (blue). If you followed me on Twitter/Stocktwits you too could have caught the USDJPY breakout move lower.

USDJPY, trading, elliottwave, technical analysis, forex, market patterns, AidanFX

Of course, like any strategy/technique, there will be times when the strategy/technique fails so proper money/risk management should always be used on every trade. Hope you enjoyed this article and follow me on Twitter for updates and questions> @AidanFX or chat me on Skype > EWF Aidan Chan

*** Always use proper risk/money management according to your account size ***

At Elliottwave-Forecast we cover 78 instruments (Forex, Commodities, Indices, Stocks and ETFs) in 4 different timeframes and we offer 5 Live Session Webinars everyday. We do Daily Technical Videos, Elliott Wave Trade Setup Videos and we have a 24 Chat Room. Our clients are always in the loop for the next market move.
 

Elliottwave-Forecast

Master Trader
Feb 17, 2017
2,460
9
84
www.elliottwave-forecast.com
USDCAD Technical Analysis

On April 27/2020 I posted on social media (Stocktwits/Twitter) @AidanFX "USDCAD Still possible the pair can extend lower below 1.4000. Possible momentum breakout lower at 1.4038"

USDCAD 1 Hour Chart April 27.2020 : The chart below was also posted on social media (StockTwits/Twitter) @AidanFX April 27/2020 showing that a bearish flag breakout pattern (black) has formed and needed a break below 1.4038 to confirm momentum of the breakout. I called for traders to watch for SELLS on the break below 1.4038 as long as price respects the moving average (light blue).

USDCAD, trading, forex, elliottwave, technical analysis, market patterns, AidanFX

USDCAD 1 Hour Chart April 27.2020 : Price respects the moving average (light blue) and breaks below 1.4038 triggering the SELL trade. A bearish Momentum Breakout Pattern (light green) was visible on the top indicator and on the price chart signalling that a break below 1.4038 will push the pair lower. Bearish divergence (purple) was visible and the bottom indicator also confirmed the SELL trade when it broke below the green trend line.


USDCAD, trading, forex, elliottwave, technical analysis, market patterns, AidanFX

USDCAD 1 Hour Chart April 28.2020 : The pair moves lower continuing to respect the moving average (light blue) and hits the 1:2 RR target (green) for +90 pips. The move lower did not show any indication of a possible move higher so I continued to hold the SELL trade looking to see a downside continuation. As long as price did not hit the stop loss the pair remained bearish.

USDCAD, trading, forex, elliottwave, technical analysis, market patterns, AidanFX

USDCAD 1 Hour Chart April 30.2020 : Price remained trading below the moving average (light blue) confirming the downside trend was still active. The pair eventually hit the 1:4 RR target (green) for +180 pips. If you followed me on Twitter/Stocktwits you too could have caught the USDCAD breakout move lower.

USDCAD, trading, forex, elliottwave, technical analysis, market patterns, AidanFX

Of course, like any strategy/technique, there will be times when the strategy/technique fails so proper money/risk management should always be used on every trade. Hope you enjoyed this article and follow me on Twitter for updates and questions> @AidanFX or chat me on Skype > EWF Aidan Chan

*** Always use proper risk/money management according to your account size ***

At Elliottwave-Forecast we cover 78 instruments (Forex, Commodities, Indices, Stocks and ETFs) in 4 different timeframes and we offer 5 Live Session Webinars everyday. We do Daily Technical Videos, Elliott Wave Trade Setup Videos and we have a 24 Chat Room. Our clients are always in the loop for the next market move.
 

Elliottwave-Forecast

Master Trader
Feb 17, 2017
2,460
9
84
www.elliottwave-forecast.com
Hello fellow traders. In this technical blog we’re going to take a quick look at the Elliott Wave charts of NETFLIX (NFLX) stock, published in members area of the website. As our members know, NETFLIX made New All-time high recently. The price has been showing impulsive structure in the cycle from the 290.47 low. Consequently ,we advised members to avoid selling NFLX and keep on buying the dips in the sequences of 3,7,or 11 swings whenever get chance In further text we’re going to take a look at the past charts and explain Elliott Wave Forecast and trading strategy.

NFLX 1 Hour Elliott Wave Analysis 4.17.2020
NFLX is bullish against the 357.9 low. We have already got 3 waves down from the peak. The price has reached equal legs area ((w))-((x)) that comes at 417.65-404.48 ( buyers zone) . At the marked Blue Box we like to be buyers for proposed rally or 3 waves bounce at least. As soon as the price reaches 50 Fibs against the ((x)) high, we should make Long Positions risk free. We don’t recommend selling and favor the long side.

You can learn more about Elliott Wave Patterns and Fibonacci Extensions at our Free Elliott Wave Educational Web Page
NFLX

NFLX 1 Hour Elliott Wave Analysis 4.20.2020
NFLX found buyers at 417.65-404.48, the Blue Box area. We got nice reaction from there. Current view suggests pull back ended at 414.8 low. Once the price above 3 red peak, we will get confirmation that next leg up is in progress. We don't recommend selling NFLX in any proposed pull back. We like staying long in Risk Free positions from that area, looking for further strength toward new highs ideally.

NFLX

NFLX 1 Hour Elliott Wave Analysis 4.23.2020
414.8 low held nicely during the short term pull backs. NFLX made rally toward new highs as we expected. Cycle from the 290.47 low ended as 5 waves structure at the 485.19 peak. Current view suggests the stock is doing 3 waves bounce ABC red against the mentioned peak. Once (B) blue recovery completes we can get another leg down within pull back against the 414.8 low.

Keep in mind that market is dynamic and presented view could have changed in the mean time. Best instruments to trade are those having incomplete bullish or bearish swings sequences. We put them in Sequence Report and best among them are shown in the Live Trading Room. You can check most recent charts in the membership area of the site.

NFLX

Elliott Wave Forecast
 

Elliottwave-Forecast

Master Trader
Feb 17, 2017
2,460
9
84
www.elliottwave-forecast.com
Newmont Corporation (NYSE: NEM) is the world's largest Gold mining company. Since the major low in the precious metal back in 2015 around $1050, many mining stocks rallied significantly and managed to outperform shining metals. If we take a look at this year's data, NEM is currently up 45% while GOLD is 11% which gives an edge to the stock at this stage despite the sharp correction that took place in March 2020.

If we take a look at the technical picture of the stock, we can clearly see the Elliott Wave Impulsive structure that NEM established from the 16th of March allowing it rally higher above February peak making a new 8 Years high. The stock still can see further upside within the short term cycle up toward $66 - $68 area but the cycle is already mature and a high would be ideally the the final leg within a 5 waves advance. Consequently, a corrective decline will be expected to take place in 3, 7 or 11 swings against $32.86 low before buyers will be looking to join the bullish trend again.

NEM 4 Hour Chart
Newmont NEM 4H 5.5.2020

The next rally for NEM will depend on how deep the pullback will be. If the correction lower overlaps with the previous wave I peak $52.7 then the most probable scenario will be a bullish nest to take place. If the pullback only correct 23% - 38% of the previous rally without an overlapping structure then the stock could be doing a wave IV pullback which will also support another rally as a wave V within a regular impulse since 2015 low. Both scenarios are suggesting further gains for the mining stock as Gold price is expected to remain supported and break above 2011 peak in the Future.

NEM Weekly Nest
NEM Weekly Nest

NEM Weekly Impulse
NEM Weekly Impulse
 

Elliottwave-Forecast

Master Trader
Feb 17, 2017
2,460
9
84
www.elliottwave-forecast.com
Short Term Elliott Wave outlook in Oil (CL_F) suggests the decline to $6.53 ended wave ((3)). Wave ((4)) recovery is unfolding as a zigzag Elliott Wave structure where wave (A) is currently in progress as a leading diagonal Elliott Wave structure. Leading diagonal can happen within wave (A) or wave (1) in larger degree and is usually characterized by overlapping wave 1 and 4, as well as the wedge shape. However, overlap between wave 1 and 4 is not a condition for a leading diagonal.

Up from wave ((3)) at 6.53, wave 1 ended at 18.26 as another leading diagonal in lower degree. Pullback in wave 2 ended at 10.7 as a zigzag. Oil then resumes higher in wave 3 towards 20.48 as an impulse and pullback in wave 4 ended at 18.05. Final leg wave 5 is in progress and may complete at 23.9 - 29.3 area. This can also end wave (A) of the zigzag in larger degree then it should see a wave (B) pullback to correct cycle from 4.22.2020 low before the rally resumes. As far as pivot at 6.53 low stays intact, expect dips to find buyers in 3, 7, 11 swing for another leg higher.

Oil 60 Minutes Elliott Wave Chart
Elliott Wave View: Leading Diagonal in Oil
 

Elliottwave-Forecast

Master Trader
Feb 17, 2017
2,460
9
84
www.elliottwave-forecast.com
Corn Futures (ZC_F) dropped from a high of 323'4 to a low of 300'2 last week before it bounced again. In today's blog, we would look at the chart presented to clients before the drop took place and how once again, the blue box area and red right side tag played out. Let's start by looking at 1 Hour Elliott wave update presented to clients on April 23, 2020.

ZC_F (Corn Futures) 1 Hour Elliott Wave Analysis 4.23.2020
Chart below shows wave (3) ended at 301'0. Up from there, wave A completed at 314'2, wave B ended at 308'2 and wave C of (4) is expected to complete in the blue box between 321'4 - 329'6 area and as price stays below invalidation level at 329'6, decline should resume in wave (5) or we should get a 3 waves reaction lower at least. Blue Boxes are High-Frequency areas which are based in a relationship of sequences, cycles and calculated using extensions.

ZC_F 23 April 1 Hour London

ZC_F (Corn Futures) 1 Hour Elliott Wave Analysis 4.28.2020
ZC_F 28 April 1 Hour Midday Elliott Wave Analysis
 

Elliottwave-Forecast

Master Trader
Feb 17, 2017
2,460
9
84
www.elliottwave-forecast.com
Barrick Gold Corporation (NYSE: GOLD) is the second-largest gold mining company in the world. Year-to-Date, the stock is up around 45%. The combination of low Oil's price (major cost component for miners) and high price in gold creates a favorable environment for the company. On Wednesday, the company will report its first-quarter results. The consensus for the EPS is at 16 cents, compared to 11 cents in first quarter last year. Reveenue is projected at $2.8 billion, a 32.5% increase year-on-year basis.

In Mid April, the company provides preliminary estimates. The company announced it sold 1.2 million ounces in the first quarter and the CEO Mark Bristow affirms the company will achieve the guidance for the year despite the Covid-19 pandemic and lockdowns. Ever since the merger with Randgold Resources in early 2019, the stock has rallied nicely. The company has been able to reduce the debt load and increase free cash flow from $365 million to $1.1 billion.

Barrick (GOLD) Weekly Elliott Wave Chart


The above chart is our forecast from December 31, 2019. Last year, we projected Barrick (GOLD) to resume higher as an impulse and eventually break above wave (I) at 2016 high. Fast forward to May 2020, the stock finally managed to break above 2016 high. It did a sharp but brief selloff in the wave II pullback as a result of the Covid-19 selloff. Below is the chart update for the stock.


The rally from September 2015 low is unfolding as a 5 waves impulse Elliott Wave structure. The stock is currently within wave III of (III) and should continue to see further upside. A 161.8% fibonacci extension from September 2015 low is $38, which is a potential target to end wave (III). The stock looks to remain favorable in coming months and years and pullback should continue to find support in 3, 7, or 11 swing.
 

Elliottwave-Forecast

Master Trader
Feb 17, 2017
2,460
9
84
www.elliottwave-forecast.com
$SLV Ishares Silver Trust Elliott Wave and Larger Cycles

Firstly there is data back to when the ETF fund began in 2006 as seen on the weekly chart shown below. The fund made a low in 2008 at 8.45 that has not since been taken out in price. However it can be in this current pullback although I don't really expect that much weakness. You should be able to assume from the October 2008 lows to the April 2011 highs was a larger degree impulse ending from all time Silver lows either way.

Secondly, the decline from the April 2011 highs down to the May 2011 lows was five waves. Price held below the April 2011 highs during the bounce from the May 2011 lows to the August 2011 high.

The analysis continues below the weekly chart.


Thirdly, the cycle from the August 2011 high appears incomplete.This red I , II & III decline to the December 2015 lows best looks as two Elliott Wave impulses. Next, the bounce to the August 2016 high was strong enough to suggest it had corrected the cycle from the red wave II highs in February 2012. From the August 2016 high the decline appears to be an Elliott Wave ending diagonal structure. Ending diagonals usually will show five three swing moves with the trend. At this point in time the trend remains down while below the September 2019 highs.

The analysis concludes below the daily chart. Here is the SLV Daily Chart.


In conclusion, down from the August 2016 highs SLV exhibits all qualities of an Elliott Wave ending diagonal structure. It appears incomplete at this point. It should go lower once more toward the 10.00 to 9.00 area while below the 9/4/2019 highs before a larger degree turn higher.
 

Elliottwave-Forecast

Master Trader
Feb 17, 2017
2,460
9
84
www.elliottwave-forecast.com
IBEX 35 is the benchmark Stock Market Index of the Bolsa de Madrid, Spain's principal stock exchange. Initiated in 1992, the index is administered and calculated by Sociedad de Bolsas, a subsidiary of Bolsas y Mercado Espanoles (BME). BME is the company which runs Spain's securities markets (including the Bolsa de Madrid). It is a market capitalization-weighted index comprising the 35 most liquid Spanish stocks in the Madrid Stock Exchange General Index.

The Index is very different than the rest of the World Indices. IBEX 35 has never broken above 2007 peak, which is the level before the financial crisis. Thus, the Index can create a floor across the World Indices. At EWF, we have created complimentary technical tools to better utilize Elliott Wave Principle. As we always said, Elliott Wave Theory was developed in 1930. There was no computer in that period nor was there any ability to see and correlate different Markets.

We define a floor as an area in which either an ABC or WXY structure reaches equality in price. We usually show this area in a blue box. The Blue Box area is an inflection area with 100% - 123.6% Fibonacci extension between the first two legs of ABC or WXY Elliott wave structure. Reaching the blue box means that a turn is about to happen. Consequently, it is a warning that market direction may change any moment.

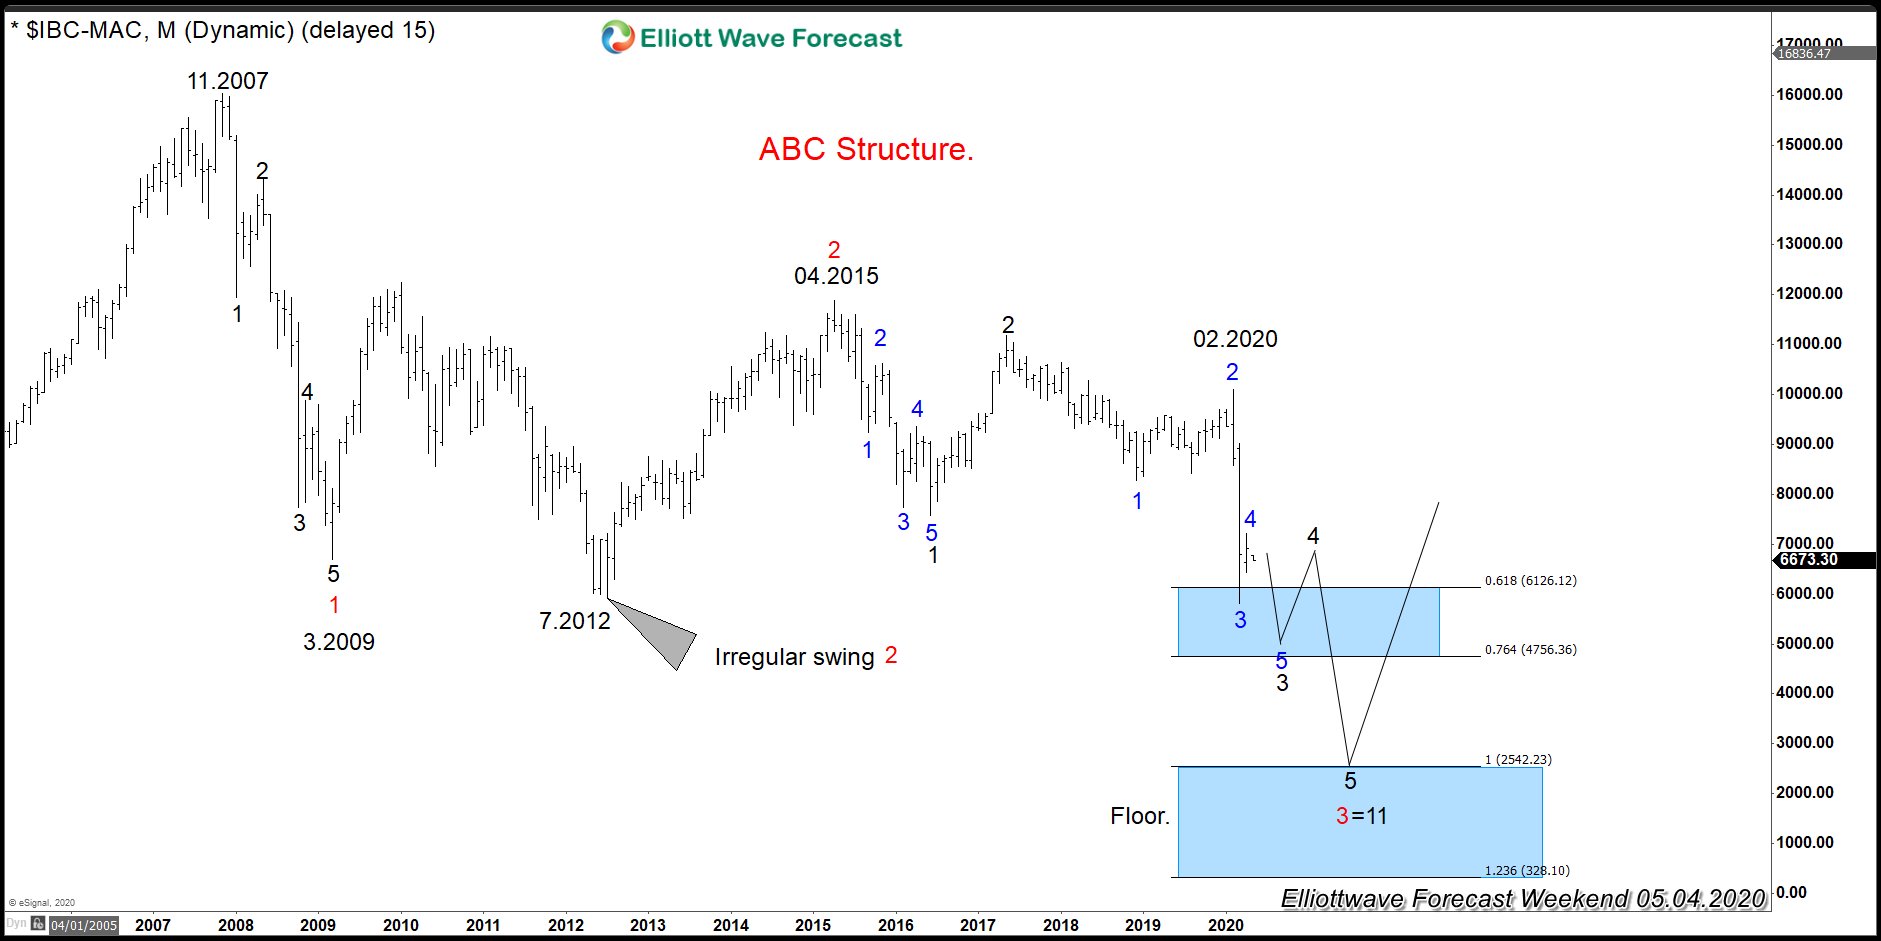
IBEX 35 is one of the few Indices which has not yet broken above 2007 peak. The weekly trend in the Index continues to be either sideways or lower. Earlier this year, the Index took the low at 07.2012. This opens further downside and creates a bearish sequence within the Super cycle degree. Sequence is the natural way that market moves and follows a numerical sequence in each stage. Sequence is either impulse or corrective. Impulse sequence is 5-9-13-17-21-25 whereas corrective sequence is 3-7-11-15-19-23. Both sequences have an increment of 4. Few Elliott wavers use the sequence but we have placed a lot of emphasis in using the sequence at EWF. We believe that without sequence, Elliott Wave Theory can become too subjective. Below is the monthly chart of IBEX:

IBEX Elliott Wave Chart


The chart above shows the sequence in IBEX 35 since 11.2007 high. The initial decline ended at 03.2009 in 5 waves. As we can see, the decline has a label of 12345 in Black , which ends 1 Red in higher degree. The moment it breaks Red 1, it creates a bearish (lower low) sequence,. At that moment, we knew the idea of Indices ending the 2009 cycle was about to happen because IBEX 35 needs to resolve lower. The Index then went forward and developed an irregular flat in swing 2 Red. For general information about Flat structure, the following page Elliott wave Theory explains the rules.

The Index then turned lower at 04.2015 and started the decline to resolve the bearish sequence. Swing 3 in red is now in progress. Subdivision of swing 3 in red needs to be in five swings in black as swing 1 in red was also in five swings in black. At this moment, we can see swing 1 in black completed in five swing in blues, which is the lesser degree. Swing 3 in black is in progress, which needs another swing 5 in blue to complete. Afterwards, a bounce in swing 4 in black should happen before turning lower again. The target is the 100% - 123.6% fibonacci extension of the red 1 and 2 which is denoted in the blue box. This should end swing 3 in red as well as swing eleven in black.

The idea and sequence of IBEX 35 are telling the whole world that choppiness will stay here for a while. But the idea that we need a series of 4-5 to end red 3 means that every dip will find buyers and creates a bounce until IBEX reaches the ideal floor at 2542.23 area. Not every Index needs to follow the same Elliott Wave structure. Some indices might do a WXY from the peak at 02.2020, and some might do a triangle. However, acceleration to the upside will not happen until IBEX 35 reaches the blue box and ends the bearish sequence. In the end, it is one market only.
 

Elliottwave-Forecast

Master Trader
Feb 17, 2017
2,460
9
84
www.elliottwave-forecast.com
Sanofi S.A. is a French multinational pharmaceutical company being within 10 largest pharmaceutical companies in the world. Headquartered in Paris, it is a merger of Aventis and Sanofi-Synthélabo. Sanofi is a part of Euro Stoxx 50 (SX5E) and CAC40 indices. Investors can trade it under the ticker $SAN at Euronext Paris and also under $SNY at NASDAQ. The company is engaged in seven major therapeutic areas. As an example, in recent weeks Sanofi S.A. is also active through Sanofi Pasteur in development of vaccines against COVID-19. Will all this engagement promote the stock price to the new highs?

Sanofi Monthly Elliott Wave Analysis 05.06.2020
The monthly chart below shows the Sanofi stock $SAN traded at Euronext Paris. From the all-time lows, the stock price is showing an Elliott wave motive wave pattern. The cycle up in blue wave (I) of super cycle degree has ended by printing its top on December 2001 at 86.44. After 5 waves higher in (I), the correction lower in 3 swings of wave (II) has ended on October 2008 at 36.00.

From the 36.00 level, prices made a new high breaking above 86.44 level. As a matter of fact, that action did confirm that the wave (III) is in progress and the buyers can see more upside in the future while the prices remain above 36.00. The cycle from the October 2008 lows in red wave I has ended on 08.2015 at 101.10 being the all-time highs. Within that cycle, one can see 5 subwaves of primary degree. After 5 waves, subsequently, the price consolidation in at least 3 waves should take place. After that, the wave III of (III) may extend higher. So, from the highs at 101.10, price is turning down to correct lower the 2008 cycle.

Sanofi Elliott Wave Monthly Chart

Sanofi Weekly Elliott Wave Analysis 05.06.2020
The correction of the cycle higher in wave I from the 08.2015 highs in red wave II lower is shown in detail in the weekly chart below. The decline unfolds as an Elliott Wave double three pattern, i.e., a 3-3-3 structure. First, the cycle in black wave ((W)) has ended on 03.2018. Secondly, the bounce in 3 waves higher in wave ((X)) is favored ended on 02.2020 at 95.09. And finally, wave ((Y)) should end the double three pattern. While below 95.09, the wave ((Y)) may extend lower to the equal legs extension area towards 56.70-47.61. The internal waves (A) and (B) might be in place and the wave (C) can fall lower towards the extreme area.

Therefore, the blue box area 56.70-47.61 can become a great opportunity to enter the market at a good price. Buyers should be waiting there. From the extremes, the Sanofi stock should accelerate in the red wave III towards 101.10 and higher or should bounce in 3 waves at least.

Sanofi Elliott Wave Weekly Chart
 

Elliottwave-Forecast

Master Trader
Feb 17, 2017
2,460
9
84
www.elliottwave-forecast.com
Rally in Bitcoin (BTCUSD) from April 16, 2020 low is unfolding as a 5 waves impulse Elliott Waves structure. Up from April 16 low, wave 1 ended at 7306.15 and pullback in wave 2 ended at 6757.75. The crypto currency then resumed higher in wave 3 towards 9485.26. Internal of wave 3 unfolded as another 5 waves impulse in lesser degree. Up from wave 2 low at 6757.75, wave ((i)) ended at 7193.13 and wave ((ii)) pullback ended at 7031.07. Wave ((iii)) ended at 9300, wave ((iv)) dips ended at 9011.77, and finally wave ((v)) of 3 ended at 9485.26.

Pullback in wave 4 is proposed complete at 8407. Bitcoin still needs to break above wave 3 at 9485.26 to avoid a double correction. Wave 5 remains in progress as an ending diagonal. Ending diagonal is a 5 waves structure with 3-3-3-3-3 subdivision and wedge shape. Unlike regular impulse, a diagonal can have an overlap between wave 1 and 4. In the chart below, we can see an ending diagonal with 3-3-3-3-3 structure, wedge shape and overlap between wave ((i)) and ((iv)). Expect wave 5 rally to end soon as an ending diagonal. This should also complete wave (3) in higher degree. Afterwards, Bitcoin should pullback in wave 4 to correct cycle from April 16 low before the rally resumes again.

Bitcoin 45 Minutes Elliott Wave Chart
BTC 1H 5.7.2020
 

Elliottwave-Forecast

Master Trader
Feb 17, 2017
2,460
9
84
www.elliottwave-forecast.com
Hello fellow traders. In this technical blog we’re going to take a quick look at the Elliott Wave charts of GOOGL, published in members area of the website. As our members know, Google is trading within the cycle from the March 1009.6 low. Proposed cycle is unfolding as 5 waves structure, when its last leg still looks incomplete. We advised members to avoid selling GOOGL and keep on favoring the long side. In further text we’re going to explain Elliott Wave Forecast.

GOOGL 1 Hour Elliott Wave Analysis 4.30.2020
The price reached short term extremes from the 1204.68 low at 1344.3-1379.7 area. We expect to see pull back wave 4 before further rally resumes. We don't recommend selling the Stock in any proposed push lower. As we got only 3 waves up from the 1204.68 low, we assume that cycle is not completed yet, expecting at least another leg up to complete 5waves up in the cycle from the 1204.6 low.

GOOGL

GOOGL 1 Hour Elliott Wave Analysis 5.4.2020
GOOGL has given us expected pull back that has unfolded as Elliott Wave Double Three Pattern. The price has reached our buying zone, equal legs ((w))-((x)) black red at 1312.6-1288.5 ( buyers zone) . From marked Blue Box area area we expect rally to take us toward new highs ideally. As our members know Blue Boxes are no enemy areas , giving us 85% chance to get a bounce.

You can learn more about Elliott Wave Double Three Patterns at our Free Elliott Wave Educational Web Page.


GOOGL 1 Hour Elliott Wave Analysis 5.4.2020
The stock found buyers at the Blue Box area: 1312.6-1288.5. We got nice reaction from there, when the price made new high, confirming next leg up is in progress. All longs from the blue box should be risk free at this stage. Now the price is bullish against the 1296.3 low.

Keep in mind that market is dynamic and presented view could have changed in the mean time. Best instruments to trade are those having incomplete bullish or bearish swings sequences. We put them in Sequence Report and best among them are shown in the Live Trading Room. You can check most recent charts in the membership area of the site.

googl

Elliott Wave Forecast
 

Elliottwave-Forecast

Master Trader
Feb 17, 2017
2,460
9
84
www.elliottwave-forecast.com
In this blog, we are going to take a look at the Elliott Wave chart of EURJPY. The chart from 4 May London update shows that the pair ended the cycle from 29 April low at 117.78 high. Wave ((a)) ended at 116.07 high. Wave ((b)) pullback ended at 115.52 low. From there, the pair extended higher and ended wave ((c)) at 117.78 high. The pair then turned lower from that high. While below 117.78 high, the bounce in 3,7 or 11 swing is expected to fail. However, EURJPY needs to break below previous wave 1 low to confirm that the next leg lower has started and to avoid doing a double correction in wave 2.

EURJPY 5.4.2020 1 Hour London Elliott Wave Update
EURJPY 5.4.20 London Update

The chart below from 8 May Asia update shows that the pair continue to extend lower from 117.77 high. The pair also broke below the previous low. Wave (i) ended at 117.00 low and the bounce in wave (ii) ended at 117.76 high. The pair then continued to the downside and ended wave (iii) at 114.36 low. Wave (iv) is currently in progress. The pair can continue to the downside again later for another leg lower to end the 5 waves decline before it can do 3 waves bounce.

EURJPY 5.8.2020 1 Hour Asia Elliott Wave Update
EURJPY 5.8.20 Asia Update

EURJPY daily chart below shows that the pair broke below wave (1) low. The decline has almost reached 100% -161.8% fibonacci extension of wave (1) - (2) between 110.10-114.30 area. However, the pair also broke below September 3, 2019 low, creating bearish sequence against January 17, 2020 high. The equal leg area where the decline can potentially end is at 101.10 level. As long as the high at 122.75 stays intact, the pair is favored for more downside.

EURJPY 5.8.2020 1 Hour Asia Elliott Wave Update
EURJPY 5.8.2020 Daily Update
 

Elliottwave-Forecast

Master Trader
Feb 17, 2017
2,460
9
84
www.elliottwave-forecast.com
The Metals sector has been slowly coming back since the lows in late 2015 and is ready for prime time attention. B2Gold Corp is a name that has an exceptional looking chart that is worth examining with Elliott Wave technicals. B2Gold is a low-cost international senior gold producer headquartered in Vancouver, Canada. Founded in 2007, B2Gold has three operating gold mines and numerous exploration and development projects in various countries including the Philippines, Namibia, Mali and Colombia. In 2020, B2Gold forecasts consolidated gold production of between 1,000,000 and 1,055,000 ounces.

We are going to take a look at weekly and 4H view today to see what the chart says about this gold producer.

Elliott Wave B2Gold Weekly View
B2Gold

B2Gold doesn't have much chart history before the all time low in 2016. But the cycles are lining up very well with the rest of the mining sector off that low. From the all time lows of 0.60 set on Jan 16/2016, B2Gold has a Red I set a 3.65 on Aug 11/2016. From there a Red II at 2.02 on Dec 15/16. Then black ((1)) at 3.55 on Feb 24/2017, and Black ((2)) at 2.10 on Aug 16/2018. then Blue (1) at 4.94 on Feb 24/2020, and Blue (2) at 2.15 on March 16/2020.

That is a lot of nesting, sometimes when charts are nesting this much, it is almost too good to be true, but considering the time frame of the nests (over the course of 4 years), I don't believe that to be the case on this name. From the March 16/2020 lows a very sharp rally has taken place bringing B2Gold to new all time highs. Lets take a look at the 4H view for more detail.

Elliott Wave B2Gold 4H View
B2Gold

Since the March 2020 lows, the count is showing a clear impulsive structure. Black ((iii)) has reached and exceeded the 161% fib extension of ((i))-((ii)). It is higher risk to be adding positions up here as the count seems to be nearing a complete sequence from the March 2020 lows. It is possible that the count will evolve in a more bullish manner and simply continue going up. However, a larger pullback in the near future seems more probable at this point in time.