Elliottwave-Forecast

Master Trader
Feb 17, 2017
2,453
9
84
www.elliottwave-forecast.com
Hello Traders! Today, we will look at the shorter cycles of The Real Estate ETF ($IYR) and explain why the sector should remain supported for the next few weeks. This is how we saw it in March 2023 expecting a bounce to take place first before lower again.

$IYR (Real Estate) 4H Elliott Wave Analysis May 1st 2023:​

$IYR

The bounce in red 2 is unfolding in a Zigzag (ABC) structure to correct the cycle against Feb 2023 peak. The first swing in black ((a)) unfolded in 5 waves from 3.24.2023 low which is an impulsive count. Corrections run in 3, 7 or 11 swings so the 5 waves higher gave a signal that we are going to remain supported against 3.24.2023 at $78.00. The ETF pulled back in 3 swings to correct the cycle against 3.24.2023 and ended ((b)) last week. From there, the ETF found buyers and made a new high above ((a)). That opened an incomplete bullish sequence to the upside. The next target area to the upside comes at $90.52 - 95.49 and that's where sellers should be waiting to appear to resume the downside.

Source: https://elliottwave-forecast.com/uncategorized/real-estate-sector-iyr-calling-upside/
 

Elliottwave-Forecast

Master Trader
Feb 17, 2017
2,453
9
84
www.elliottwave-forecast.com
The Toronto-Dominion Bank (TD) provides various financial products & services in Canada, US & internationally. It operates through three segments: Canadian retail, US retail & Wholesale banking. It is based in Toronto, Canada, comes under Financial services sector & trades as “TD” ticker at NYSE.

As discussed in the previous article, TD ended wave I as impulse sequence at $86.02 high & favors lower in zigzag sequence in II. It confirmed the lower low sequence in daily, expecting weakness in ((C)) leg of II towards weekly blue box area. Currently, it favors corrective bounce in (2) in 3, 7 or 11 swings against ((B)) high before downside resumes in (3).

TD - Elliott Wave View From 3.20.2023:

In weekly sequence from $33.74 low, it placed I at $86.02 high as impulse. It ended ((1)) at $51.34 high & ((2)) at $42.90 low as 0.5 Fibonacci retracement of ((1)). It ended ((3)) at $73.85 high as third wave extension & ((4)) at $62.81 low as 0.382 Fibonacci retracement. Finally, it ended ((5)) at $86.02 as wave I impulse sequence on 2.11.2022 high. While below there, it favors lower in II correction in zigzag sequence.

TD- Elliott Wave Latest Weekly View:

Below $86.02 high, it placed ((A)) as diagonal at $57.27 low on 10.13.2022. It favored ended ((B)) as 3 swing corrective bounce at $70.67 high on 2.14.2023. It already showing lower low sequence below ((A)) low, calling for weakness in ((C)) towards $41.94 - $35.15 area & may hold above $33.74 low to see at least 3 swing bounce or may resumes higher in III, which confirms above wave I high. Currently, it favors bounce in C of (2) bounce against ((B)) high before downside resumes in (3) of ((C)). It can bounce towards $64.87- $69.00 area & should fail below ((B)) high to resume lower in (3).

TD - Elliott Wave Latest Daily View:

Source: https://elliottwave-forecast.com/stock-market/td-short-term-bounce-should-fail-resume-lower/
 

Elliottwave-Forecast

Master Trader
Feb 17, 2017
2,453
9
84
www.elliottwave-forecast.com
Hello Traders, in this article we will analyze our forecast of the ES Mini Futures in the short term cycle. Since the short term peak of ES_F from 04.18.2023 to end wave 3 we have been expecting a pullback within wave 4 to take place.

Here at Elliott Wave Forecast we have in place a system that allows us to measure an area in which we can expect a reaction to take place. We call it equal legs area or blue box area as you might have seen within our charts. These areas provide us with at least an 85% chance of a minimum of 3 waves bounce or reaction to take place. We can use these areas to enter in the market with a defined entry, Stop Loss and exit strategy.

In the case of ES_F we had completed the first leg lower in ((a)) and connector bounce in ((b)) of 4. Consequently we were able then to project the area of ((c)) of 4. This is what we call equal legs area. From there we expect buyers to enter for wave 5 higher or produce a minimum of 3 waves reaction higher at least. Let's have a look on ES 1 hour cycle from 04.26.2023.

ES_F 1 hour London update 04.26.2023​

ES_F Short Term Elliott Wave Analysis 04.26.2023

Specifically during the London update from 04.26.2023 we expected it to be within wave (iii). Soon to provide a bounce in (iv) before lower in (v) to end ((c)) of 4. The area is 4099.39 - 4059.29. Let's have a look at the latest update we provided within this weekend.

ES_ F 1 hour weekend update 04.30.2023​

ES_F Short Term Elliott Wave Analysis 04.30.2023

It has already reacted higher within wave (v) of ((i)) from 4068.75. Buyers have entered from the equal legs area as forecasted and soon a 3 waves pullback within wave ((ii)) will follow. And thereafter we would expect buyers to resume the upside within wave ((iii)) of 5.

Source: https://elliottwave-forecast.com/st...utures-another-equal-legs-buying-opportunity/
 

Elliottwave-Forecast

Master Trader
Feb 17, 2017
2,453
9
84
www.elliottwave-forecast.com
With the recent failure in Silicon Valley Bank and First Republic Bank, we will take a look at the U.S. banking sectors. In this article, we will update the long term outlook of Wells Fargo & Company (WFC). Wells Fargo is a diversified financial services company which provides banking, investment, mortgage, consumer & commercial finance products & services in the US & internationally. It is based in San Francisco, CA, comes under Financial services sector & trades as “WFC” ticker at NYSE.

Wells Fargo & Company (WFC) Weekly Elliott Wave​

Wells Fargo & Company ended Super Cycle wave (I) at 69.17 and the stock is now doing correction to the all-time low within Super Cycle wave (II). Internal subdivision of wave (II) is unfolding as a double three Elliott Wave structure. Down from wave (I), wave w ended at 36.54 and rally in wave x ended at 48.84. The stock has resumed lower and broken below wave w at 36.54 suggesting the next leg lower has started. Target for wave y lower is 100% - 161.8% Fibonacci extension of wave w at 10.57 - 25.16. This area, if reached, should be major low and provides good long term buying opportunity.

WFC Daily Elliott Wave​


Daily Elliott Wave Chart of Wells Fargo & Company above shows the stock has 5 swing bearish sequence from wave (I) high, favoring further downside. The stock is now rallying to correct cycle from 2.14.2023 high within wave (B). Rally should fail in 3, 7, or 11 swing before the decline resumes. As far as pivot at 48.8 stays intact, expect rally to fail in 3, 7, or 11 swing for further downside. Target for wave Y of (B) rally is 100% Fibonacci extension of wave W at 46.1.

Source: https://elliottwave-forecast.com/video-blog/wells-fargo-company-wfc-sequence-remains-bearish/
 

Elliottwave-Forecast

Master Trader
Feb 17, 2017
2,453
9
84
www.elliottwave-forecast.com
In this technical blog, we will look at the past performance of the 1-hour Elliott Wave Charts of QQQ. We presented to members at the elliottwave-forecast. In which, the rally from 13 March 2023 low unfolded as an impulse structure. And showed a higher high sequence favored more upside extension to take place. Therefore, we advised members not to sell the ETF & buy the dips in 3, 7, or 11 swings at the blue box areas. We will explain the structure & forecast below:

QQQ 1-Hour Elliott Wave Chart From 4.20.2023​

QQQ Doing Strong Reaction Higher From Blue Box Area

Here’s the 1hr Elliott wave chart from the 4/20/2023 Midday update. In which, the cycle from the 3/13/2023 low ended in wave ((i)) as an impulse structure at $322.16 high. Down from there, the ETF made a pullback in wave ((ii)) to correct that cycle. The internals of that pullback unfolded as Elliott wave double three structure where wave (w) at $312.30 low. Wave (x) ended at $321.86 high and wave (y) managed to reach the blue box area at $311.50- $305.36 area. From there, buyers were expected to appear looking for the next leg higher or for a 3 wave bounce minimum.

QQQ Latest 1-Hour Elliott Wave Chart From 5.02.2023​

QQQ Doing Strong Reaction Higher From Blue Box Area

This is the latest 1hr Elliott wave Chart from the 5/02/2023 Post-Market update. In which the ETF is showing a strong reaction higher taking place, right after ending the double correction within the blue box area. Allowed members to create a risk-free position shortly after taking the long position at the blue box area.

Source: https://elliottwave-forecast.com/stock-market/qqq-strong-reaction-higher-blue-box-area/
 

Elliottwave-Forecast

Master Trader
Feb 17, 2017
2,453
9
84
www.elliottwave-forecast.com
Hello fellow traders. In this article we’re going to take a quick look at the Elliott Wave charts of NZDJPY published in members area of the website. NZDJPY has given us recently ((x)) connector that unfolded as Elliott Wave Zig Zag pattern. Pull back completed right at the extreme zone as we expected. In the further text we are going to explain the Elliott Wave Forecast.

NZDJPY Elliott Wave 1 Hour Chart 04.20.2023​

We are calling cycle from the 83.90 still in progress. We got 5 waves decline from the mentioned peak which suggests we ended only first leg of the correction. Wave (b) was deep recovery, however as far as the price stays below 83.72 high, we still expect to see another wave down which should also unfold as 5 waves. More precisely we are now in wave iii of (c) of ((x)). The pair is targeting 81.95-81.52 area. As our members know we target get by Fibonacci extension tool. Mentioned zone is equal legs area from the 83.90 peak

You can learn more about Elliott Wave Zig Zag Patterns at our Free Elliott Wave Educational Web Page.


NZDJPY

NZDJPY Elliott Wave 1 Hour Chart 04.25.2023​

The pairs has given us decline toward proposed area. However at this moment (c) leg shows incomplete sequences. The pair is missing another wave down so we can count clear 5 waves in (c) blue wave. While below 83.05 high, we assume iv red is competed there and wave v is in progress. More precise target zone for wave v red would be inverse 1.236-1.618 fib ext of wave iv that comes at 81.69-81.27 area.


NZDJPY Elliott Wave 1 Hour Chart 04.28.2023​

NZDJPY made another leg down as proposed toward 81.69-81.27 area . Wave ((x)) connector completed at 81.54 low. The pair has found buyers and made very good reaction higher as we expected. As far as 81.5 pivot holds, more upside can be seen in the pair.
Keep in mind that market is dynamic and presented view could have changed in the mean time. You can check most recent charts in the membership area of the site. Best instruments to trade are those having incomplete bullish or bearish swings sequences. We put them in Sequence Report and best among them are shown in the Live Trading Room


NZDJPY

Source: https://elliottwave-forecast.com/elliottwave/nzdjpy-elliott-wave-forecasting-zig-zag/
 

Elliottwave-Forecast

Master Trader
Feb 17, 2017
2,453
9
84
www.elliottwave-forecast.com
Hello fellow traders. In this technical article we’re going to take a quick look at the Elliott Wave charts of EURCAD published in members area of the website. As our members know, the pair is showing bullish sequences in the cycle from the August 2022 low. Our team recommended members to avoid selling , while keep favoring the long side. Recently we got correction that reached our buying zone. The pair found buyers and made rally from the blue box as expected. In the further text we are going to explain the Elliott Wave Forecast and trading strategy.

EURCAD Elliott Wave 1 Hour Chart 04.28.2023​

The pair is giving us wave ((iv)) pull back that is unfolding as Zig Zag pattern. We expect to get more short term weakness toward 1.4889-1.4802 area which will be our buying zone. We don’t recommend selling the pair against the main bullish trend. Strategy is waiting for the price to reach blue box- equal legs zone, before entering the long trades again. Once bounce reaches 50 Fibs against the (b) blue high , we will make long position risk free ( put SL at BE) and take partial profits. Invalidation for the long trades is break of 1.618 fib ext : 1.4802

Quick reminder:

Our charts are easy to trade and understand:
Red bearish stamp+ blue box = Selling Setup
Green bullish stamp+ blue box = Buying Setup
Charts with Black stamps are not tradable.

You can learn more about Elliott Wave Patterns at our Free Elliott Wave Educational Web Page.

EURCAD

EURCAD Elliott Wave 1 Hour Chart 05.04.2023​

EURCAD made decline in (c) leg and reached buying zone at 1.4889-1.4802 area( blue box) . Pull back completed at the 1.4841 low and we got a very good reaction from the buying zone. Members who took the long trade are enjoying profits now in a risk free positions. Currently EURCAD is giving us pull back against the 1.4841 low. If pivot at that low gives up, we can get a deeper pull back per alternative view.

Keep in mind that market is dynamic and presented view could have changed in the mean time. You can check most recent charts in the membership area of the site. Best instruments to trade are those having incomplete bullish or bearish swings sequences. We put them in Sequence Report and best among them are shown in the Live Trading Room

EURCAD

Source: https://elliottwave-forecast.com/trading/eurcad-buying-dips-blue-box-area/
 

Elliottwave-Forecast

Master Trader
Feb 17, 2017
2,453
9
84
www.elliottwave-forecast.com
Procter & Gamble Co (NYSE: PG), a household name in consumer goods, has been a staple in many homes for generations. From Crest toothpaste to Tide laundry detergent, P&G's products are ubiquitous and trusted by millions. But as the company faces increasing competition and changing consumer preferences, can it continue to deliver for its investors? This article dives into the Elliott Wave analysis of P&G, revealing potential bullish patterns that may excite both long-term investors and short-term traders. Let's take a closer look at what the future may hold for this iconic company.

PG Daily Elliott Wave Chart​

PG Daily Elliott Wave Chart

PG experienced a decline in 2022, which is believed to be a wave II correction that concluded at $122.18 in October of that year. After the correction, PG rallied higher in wave ((1)), followed by a correction in wave ((2)) before starting another cycle higher in wave ((3)). Recently, the stock broke above January 2023 peak creating a bullish sequence of 2022 low and supporting the stock toward weekly target at $168. However, the daily cycle has reached an extreme area at 155.9 - 160.7, which could create a 3 waves pullback to correct the rally since March 2023 low. This correction lower could present a daily buying opportunity as long as it remains above $135.38 low. Investors can look for continuation towards a new all-time high from there.

Source: https://elliottwave-forecast.com/video-blog/procter-gamble-pg-growth/
 

Elliottwave-Forecast

Master Trader
Feb 17, 2017
2,453
9
84
www.elliottwave-forecast.com
KGHM Polska Miedź S.A. is a multinational corporation which has its headquarters in Lubin, Poland. Traded under tickers $KGH at WSE and $KGHPF in US in form of ADRs, it is a component of the WIG30 index. KGHM has been a major copper and silver producer for more than 50 years. As a matter of fact, it operates 9 underground and open-pit mines located in Poland, USA, Canada and Chile and is actively advancing other projects. KGHM produces key global resources including copper, silver, gold, platinum, nickel and others. Currently, we see indices in short term rally expecting medium term weakness to follow before higher again. That should create sideways to lower effect on KGHM. On the orther hand, metals like copper and silver should continue see support. As a rule, the rally in prices of metals provides a magnifying effect on the share prices of metals producing companies. Therefore, KGHM being one of major producers should become a profitable invetsment target as it should ramp up along with acceleration in commodities prices.

Previously, we have discussed the stock price of KGHM. First, it has demonstrated an impressive rally since our initial article from August 2020. Then, in the article from June 2021, we saw a new all-time high predicting a pullback to happen soon. Indeed, the pullback took place. In the article from August 2022, we have provided with a Daily bluebox area where buyers should have waited to enter the market. Indeed, the reaction has happened form that area. Now, we discuss the targets and provide an outlook.

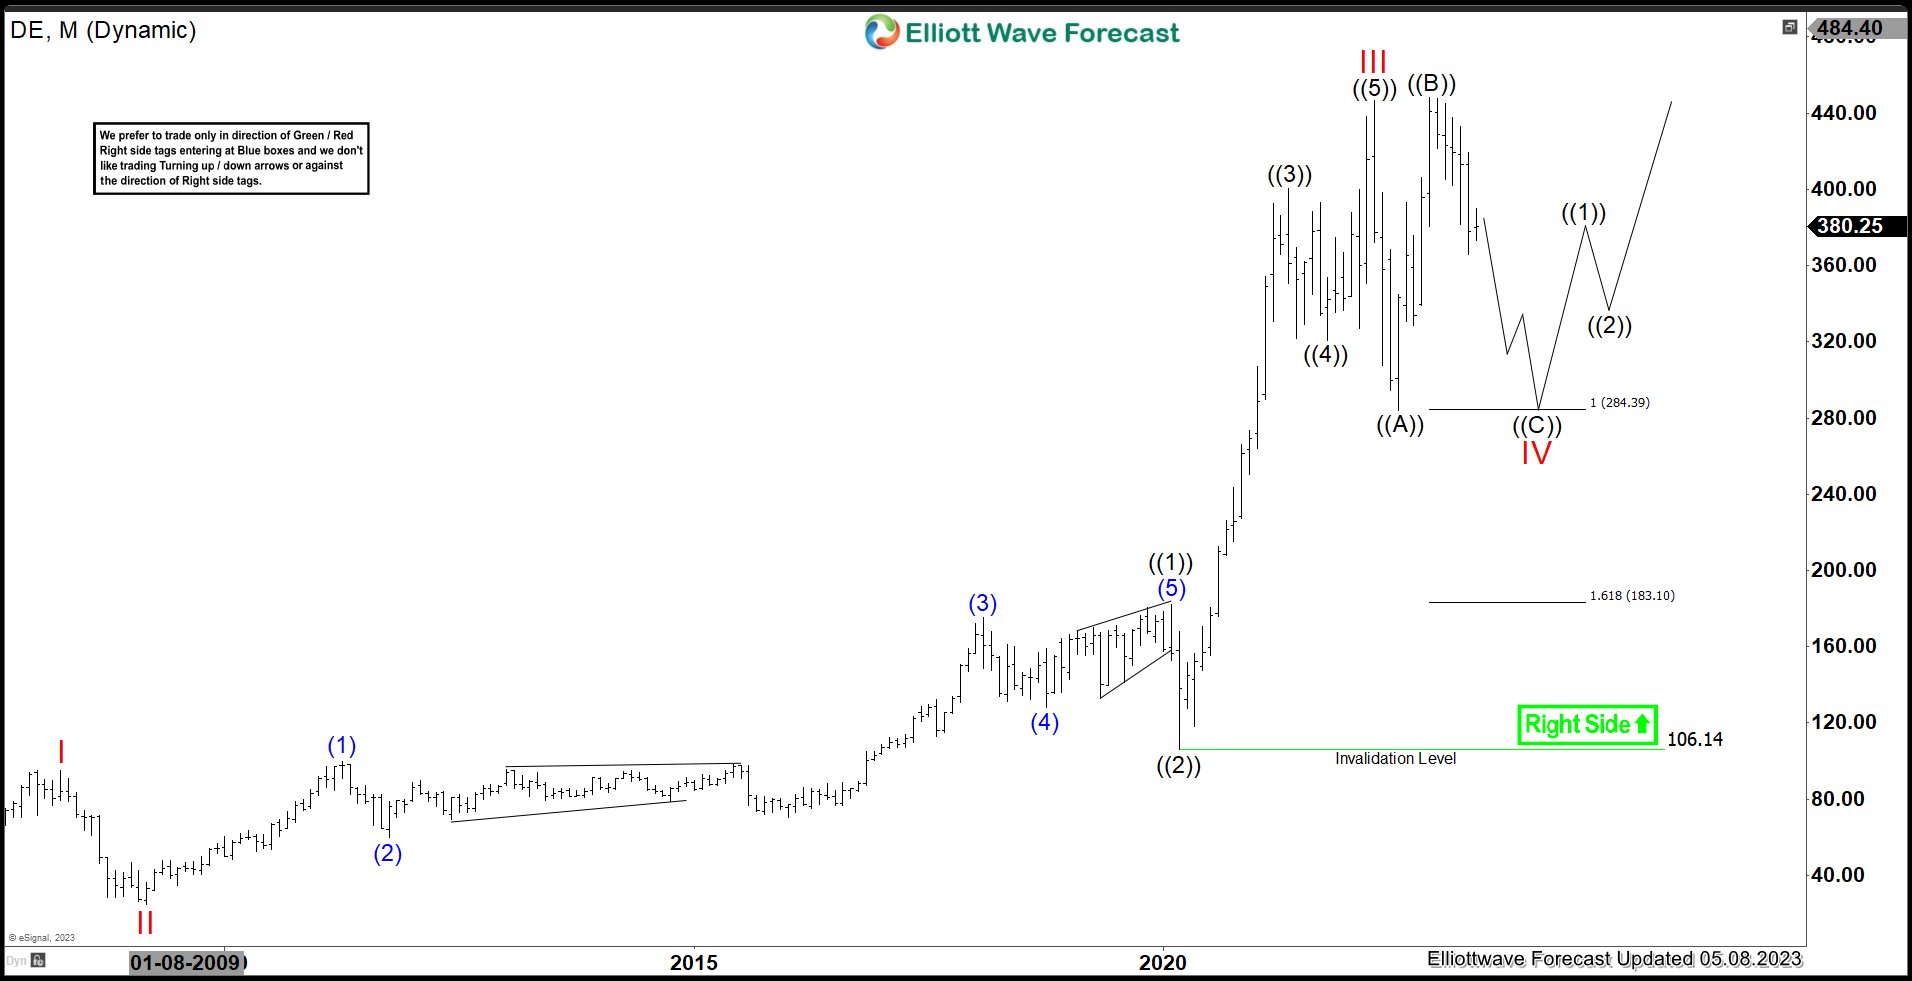
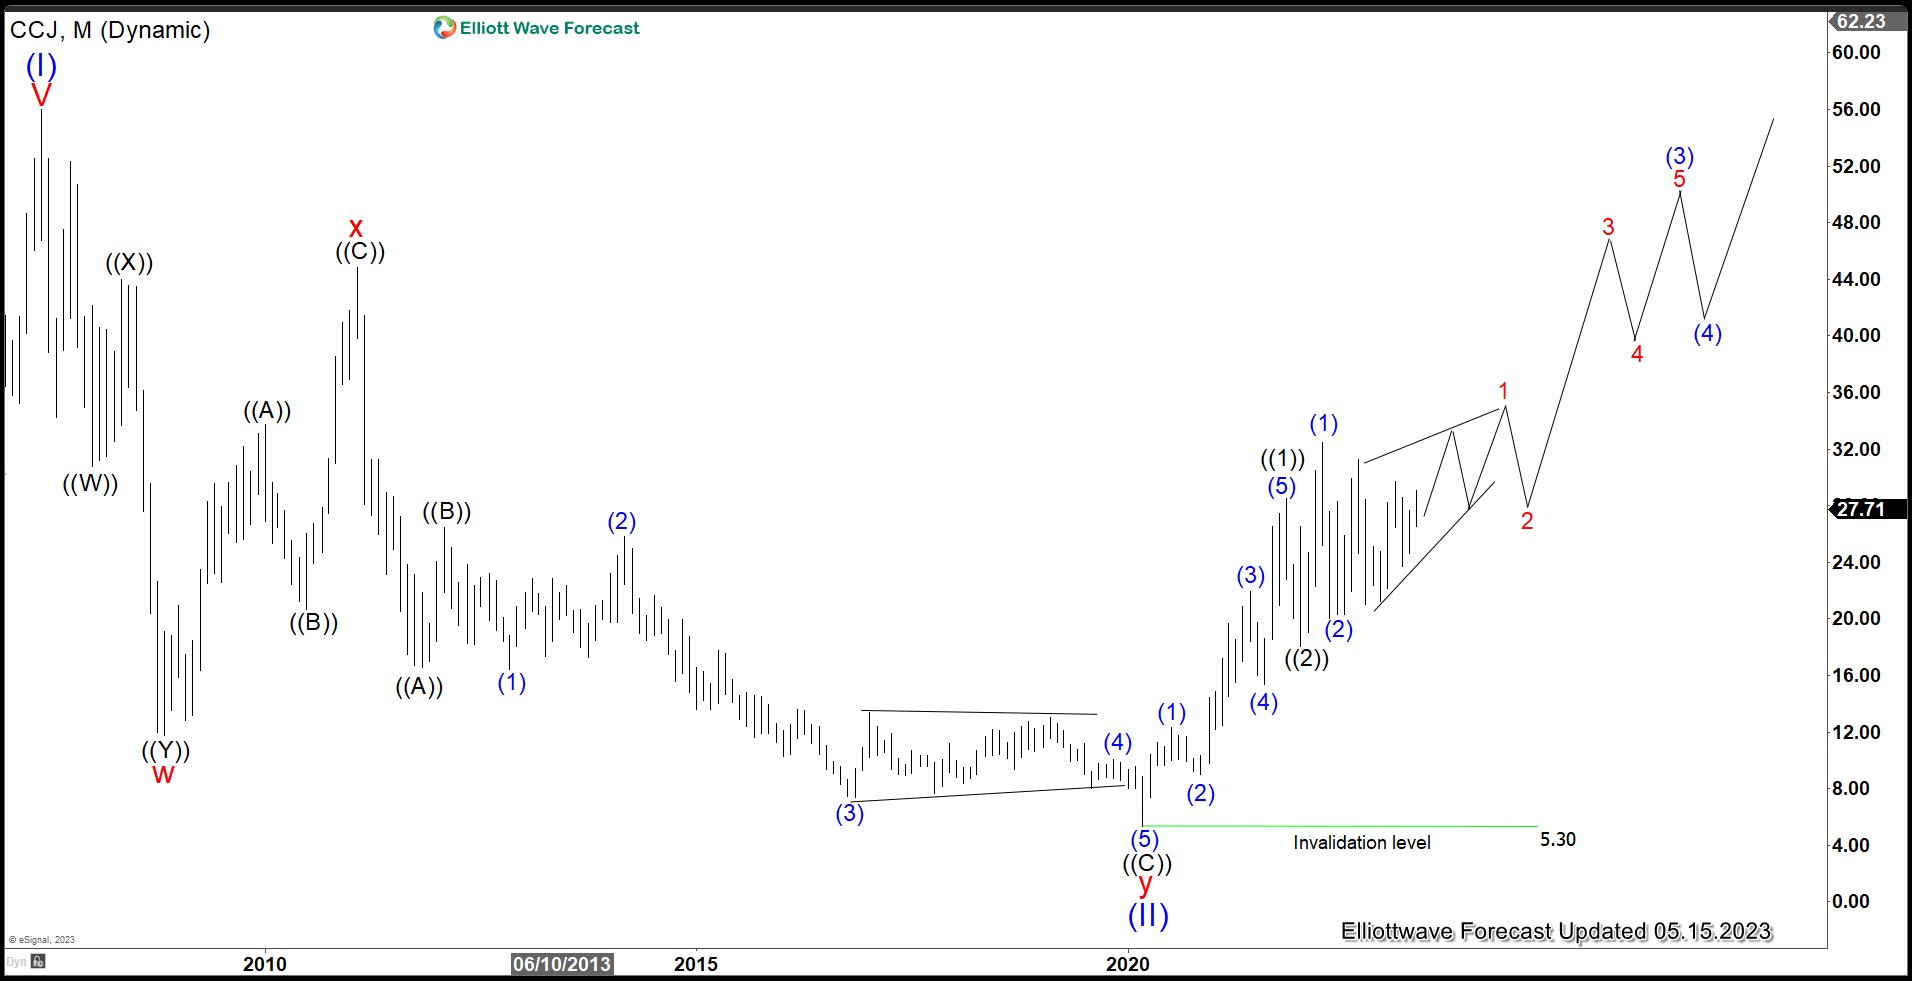
KGHM Monthly Elliott Wave Analysis 05.06.2023​

The monthly chart below shows the KGHM shares $KGH traded at Warsaw Stock Exchange. First, from the all-time lows, the stock price has developed a cycle higher in wave (I). Hereby, KGHM has printed a top in October 2007 at 145. Since the red wave III of blue wave (I) shows a price separation higher, the cycle up is obviously an impulse. From the highs, a correction lower in wave (II) has unfolded as a zigzag correction being a 5-3-5 structure. It has found an important bottom in October 2008 at 20.10.

From the 2008 lows, another motive cycle has started. KGHM has broken the 2007 highs at 145 in a 5 waves move in the red wave I. Hereby, the share price has printed a high in April 2011 at 200.30. From there, a multi-year correction in wave II has started. Hereby, one can recognize a double three pattern. It has ended in March 2020 with a capitulation move down to 48.01.

From the March 2020 lows at 48.01, KGHM has started a new cycle higher in wave III of (III). Break to the new all-time highs has confirmed that. The target area for the wave III to end is towards 229.05-340.55 and possibly higher. As of right now, first leg up has reached already the minimum expectations. It is the the preferred view that the leg up is the wave ((1)) of III which has ended at 230.80. From the all-time highs, a pullback in wave ((2)) has ended in September 2022 at 80.68 lows. While above there, black wave ((3)) is in progress.

KGHM Elliott Wave Monthly

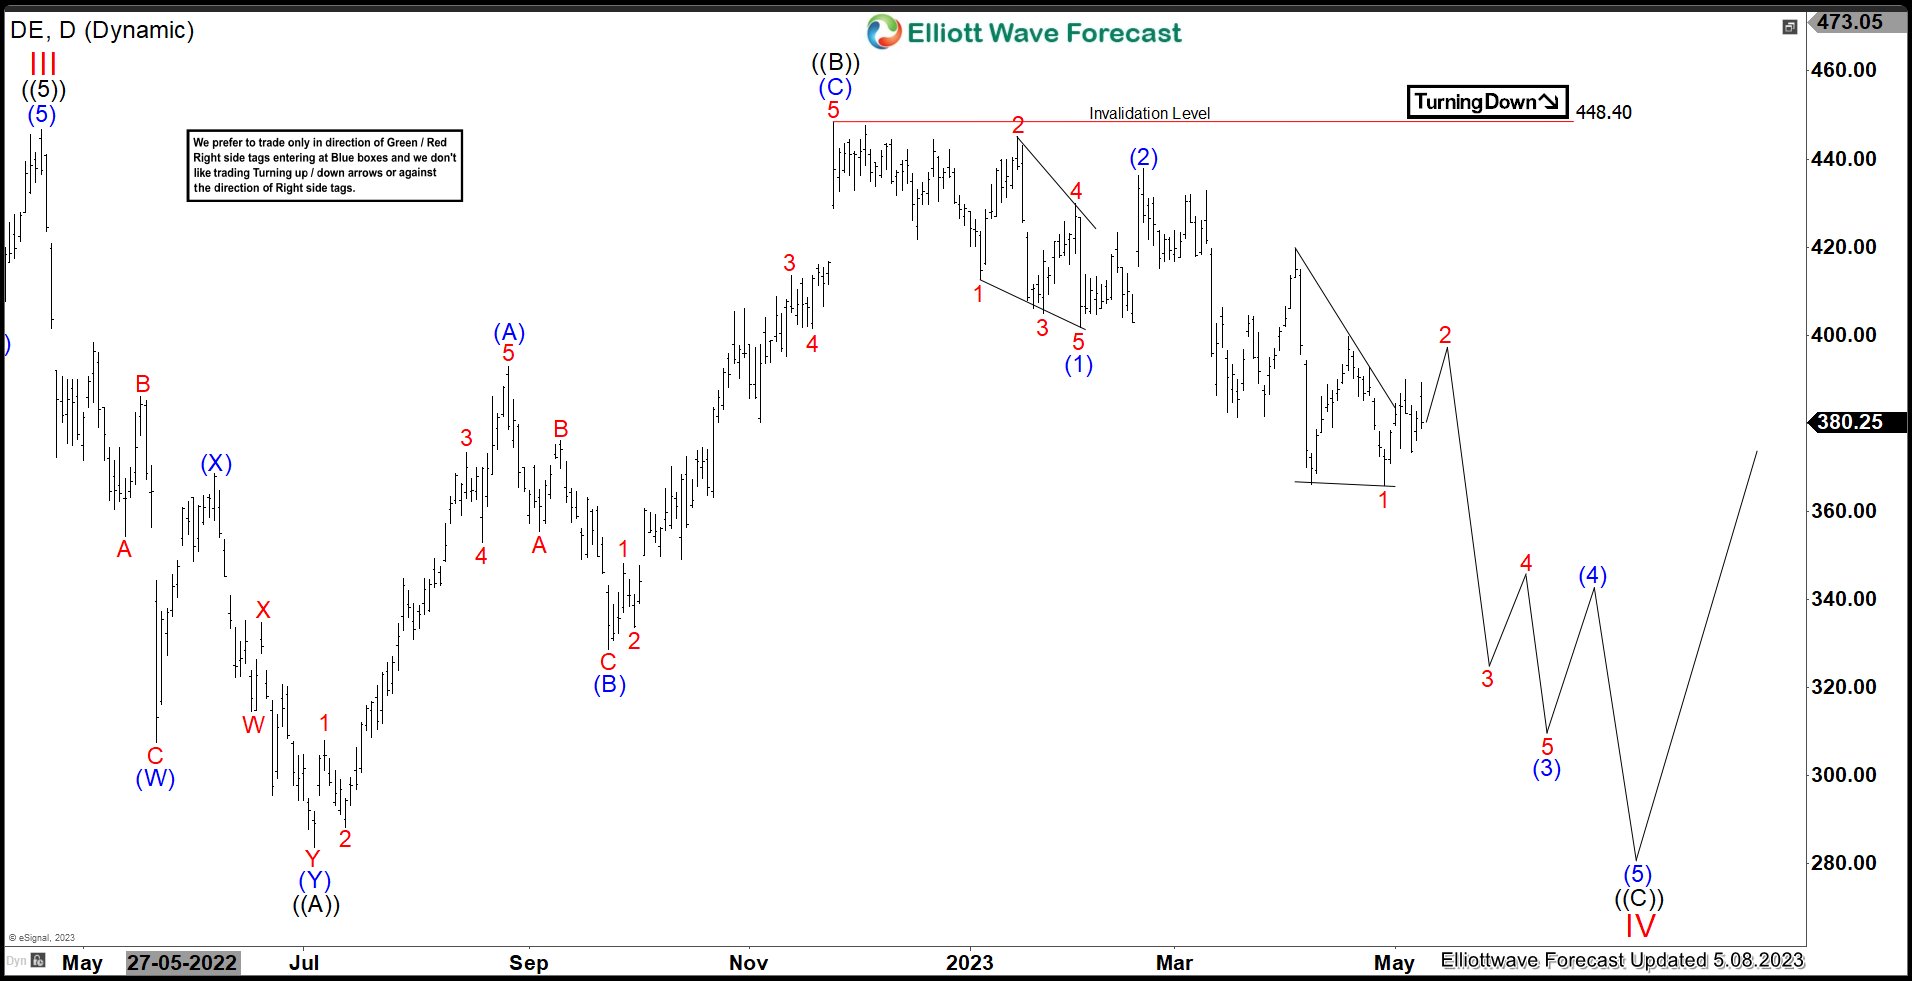
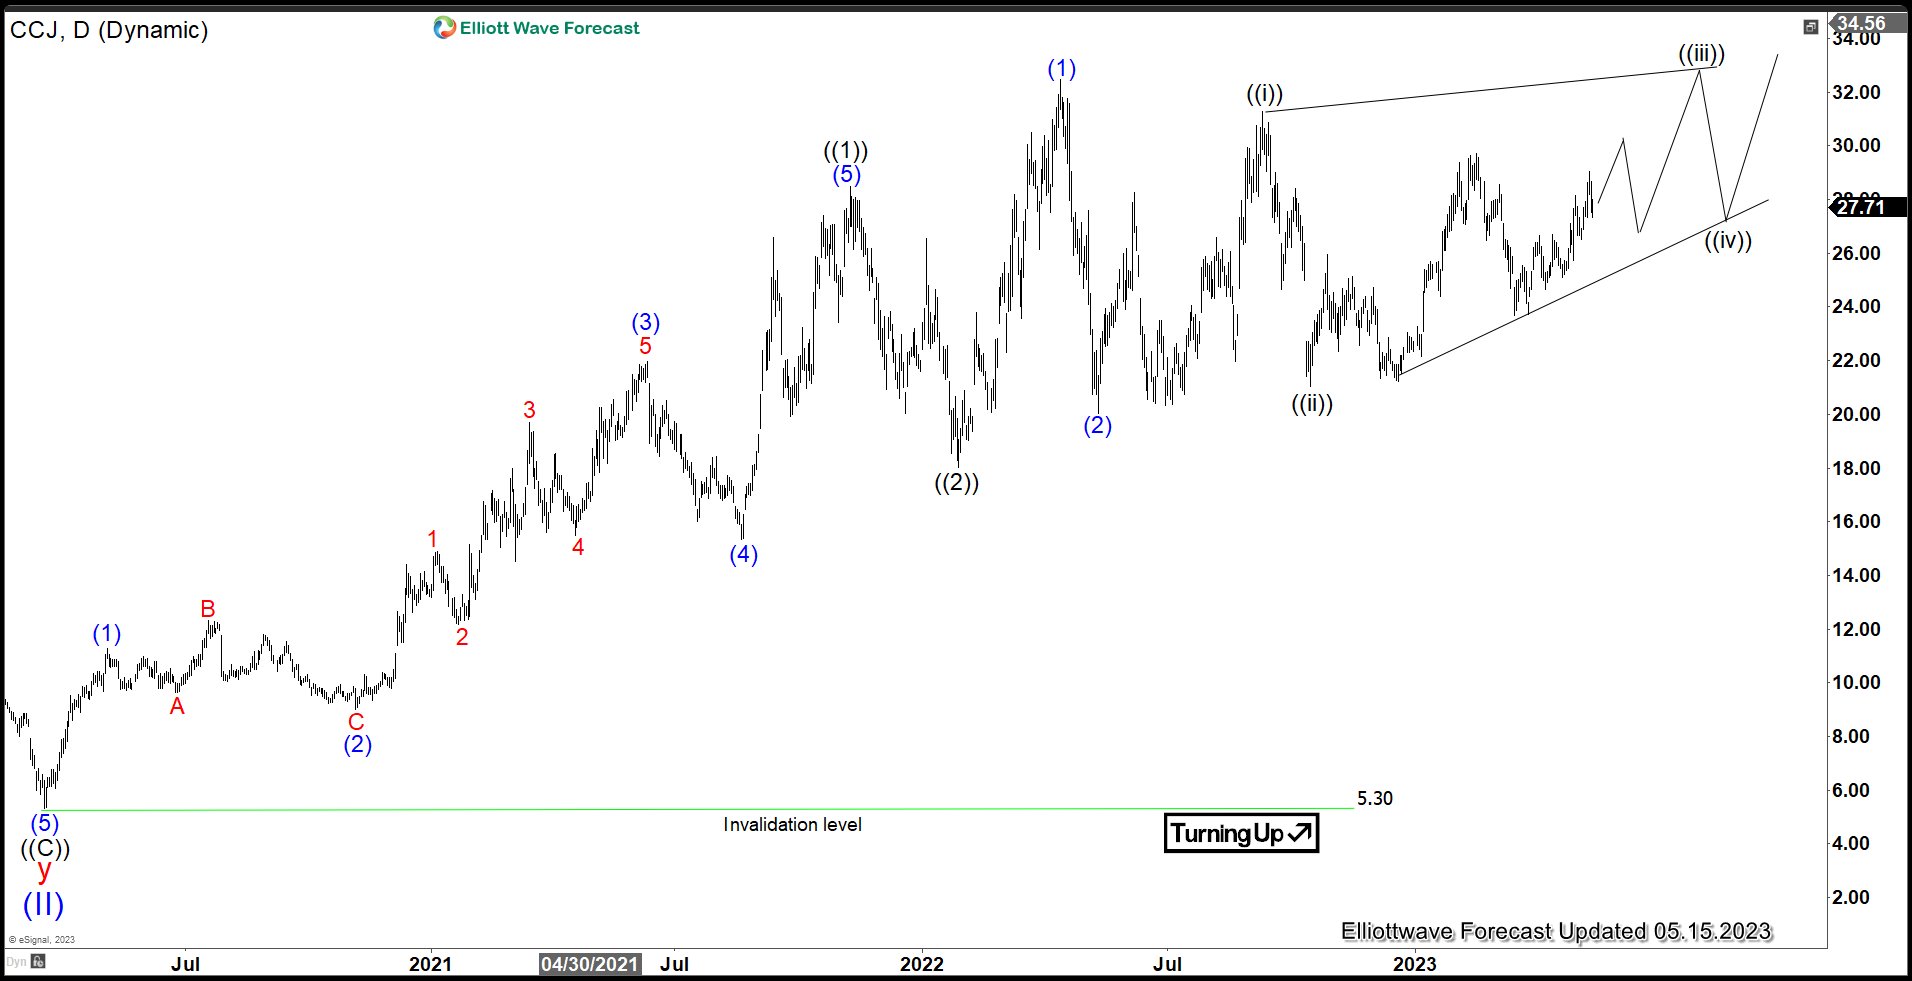
KGHM Daily Elliott Wave Analysis 05.06.2023​

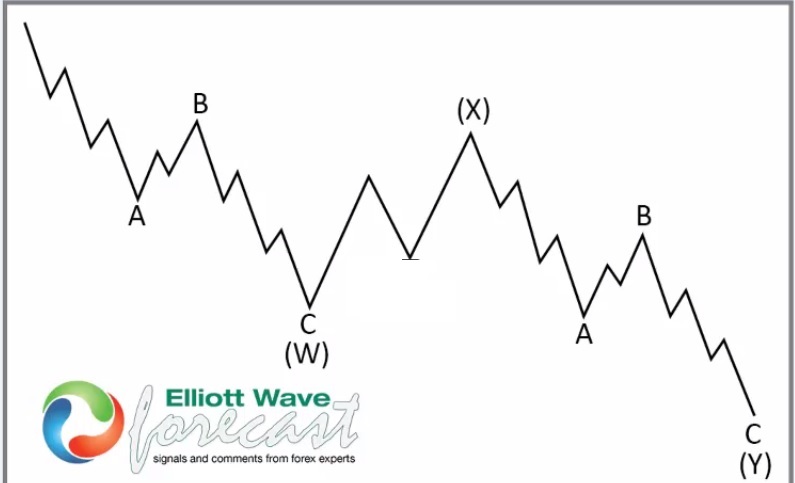
The Daily chart below shows in more detail the final swing lower within pullback from the all-time highs and the initial stages of the black wave ((3)). The consolidation pattern in black wave ((2)) has unfolded as a zigzag pattern. First, impulse in blue wave (A) has found its bottom in November 2021 at 131.50. Then, a bounce in blue wave (B) has set connector in March 2022 at 193.60 (both not shown). From there, wave (C) has been confirmed by breaking 131.50 lows. Diagonal structure in blue wave (C) has reached towards 94.14-48.01 blue box area. There, investors and traders got an opportunity to go long. Now, we see a reaction higher from the area taking place. While price holds above September 2022 lows, new cycle in black wave ((3)) should bring KGHM stock higher. Target is towards 263.34-376.33 area and even beyond. In shorter cycles, red wave 1 has set a medium term peak in January 2023 at 154.70 highs. While below, red wave 2 should correct in 3 or 7 swings the cycle from September 2022 low. Once finished, expect acceleration higher in red wave 3 of blue wave (1) of black wave ((3)).

KGHM Elliott Wave Daily

Source: https://elliottwave-forecast.com/stock-market/kghm-bluebox-reaction/
 

Elliottwave-Forecast

Master Trader
Feb 17, 2017
2,453
9
84
www.elliottwave-forecast.com
Hello fellow traders. In this technical article we’re going to take a look at the Elliott Wave charts charts of Dollar index published in members area of the website. As our members know USDX has recently made recovery against the 105.87 peak that has unfolded as Elliott Wave Double Three Pattern. It made clear 7 swings from the lows and completed correction near the extreme zone. In further text we’re going to explain the Elliott Wave pattern and forecast

Before we take a look at the real market example, let’s explain Elliott Wave Double Three pattern.

Elliott Wave Double Three Pattern

Double three is the common pattern in the market , also known as 7 swing structure. It’s a reliable pattern which is giving us good trading entries with clearly defined invalidation levels.
The picture below presents what Elliott Wave Double Three pattern looks like. It has (W),(X),(Y) labeling and 3,3,3 inner structure, which means all of these 3 legs are corrective sequences. Each (W) and (Y) are made of 3 swings , they’re having A,B,C structure in lower degree, or alternatively they can have W,X,Y labeling.

USDX

USDX 1h Hour Elliott Wave Analysis 05.01.2023

Dollar index ended cycle from the 105.87 peak as 5 waves structure. Currently USDX is giving us 2 red recovery that is unfolding as Elliott Wave Double Three Pattern. Correction has ((w))((x))((y)) black inner labeling. The price structure is still incomplete. We expect to see more short term strength in 7th swing toward 102.43-103.3 area to complete proposed correction. At that zone buyers should be ideally taking profits and sellers can appear again. Consequently , we expect to see reaction from the marked area. We can see either decline toward new lows or larger 3 waves pull back at least.

You can learn more about Elliott Wave Double Three and Zig Zag Patterns at our Free Elliott Wave Educational Web Page.


USDX 1h Hour Elliott Wave Analysis 05.06.2023

USDX made extension higher and almost reached 102.43 area. It found sellers and made decline as we expected. Current view suggests 2 red recovery completed at 102.4 high. As far as the price holds below that peak, further weakness should follow, otherwise larger correction can be taking place in 7 swings. We should wait for a break of 1 red low , which will confirm next leg down is in progress.

Keep in mind not every chart is trading recommendation. You can check most recent charts and new trading setups in the membership area of the site. Best instruments to trade are those having incomplete bullish or bearish swings sequences. We put them in Sequence Report and best among them are shown in the Live Trading Room.

USDX

Source: https://elliottwave-forecast.com/elliottwave/usdx-decline-elliott-wave-double-three/
 

Elliottwave-Forecast

Master Trader
Feb 17, 2017
2,453
9
84
www.elliottwave-forecast.com
Deere & Company manufactures & distributes various equipment worldwide. The company operates through four segments: Production & Precision Agriculture, small Agriculture & Turf, Construction & Forestry, & Financial services. The company is based in Illinois, US, comes under Industrials sector & trades as “DE” ticker at NYSE.

As discussed in previous article, DE showing bullish monthly sequence & favors flat correction in IV before upside resumes. It placed ((B)) of IV at $448.40 high & favors lower in ((C)) wave to finish IV either in running or expanded flat correction before upside resumes in V. Alternatively, IV can do triangle as well before the trend resumes.

DE - Elliott Wave View From 3.26.2023:

In monthly sequence, it placed I at $94.89 high & II at $24.51 low. It has extended wave III as third wave extension, which finished as III impulse at $446.76 high. Within wave III, it placed ((1)) at $181.99 high & ((2)) at $106.14 low. It favored ended ((3)) at $400.34 high & ((4)) at $320.50 low as 0.236 Fibonacci retracement correction. Finally, it ended ((5)) at $446.76 high as wave III.

DE - Elliott Wave Latest Monthly View:

It finished ((A)) of IV at $283.81 low on 7.06.2022 as 7 swing sequence. While, it ended ((B)) at $448.40 high on 11.23.2022 as 3 swing sequence in IV in flat correction. Below there, it placed (2) at $437.88 high & 1 of (3) at $365.89 low. Currently, it favors bounce in 2 of (3) & expect small bounce before downside resumes in 3 of (3). It expects few more lows to finish ((C)) as IV either in running flat or expanded flat correction followed by V higher. Alternatively, it can do triangle in IV before upside resumes.

DE - Elliott Wave Latest Daily View:

Source: https://elliottwave-forecast.com/stock-market/de-favors-weakness-flat-correction/
 

Elliottwave-Forecast

Master Trader
Feb 17, 2017
2,453
9
84
www.elliottwave-forecast.com
Hello Traders, in this article we will analyze our forecast of the Nasdaq Futures in the short term cycle. Since the short term peak of NQ_F from 05.01.2023 to end wave (i) we have been expecting a pullback within wave (ii) to take place. Here at Elliott Wave Forecast we have in place a system that allows us to measure an area in which we can expect a react to take place.

We call it equal legs area or blue box area as you might have seen within our charts. These areas provide us with at least an 85% chance of a minimum of 3 waves bounce or reaction to take place. We can use these areas to enter in the market with a defined entry, Stop Loss and exit strategy.

We teach how to use our system within our member's area and live trading room. Once a member or in trial you will be able to gather more of that information under your disposal. Nevertheless, let's have a look now on the 1 hour chart of Nasdaq futures as provided to members from 05.04.2023. We have been within the equal legs area within a swing lower missing to end the cycle.

NQ_F 1 Hour Asia update 05.04.2023​

NQ_F Short-Term Elliott Wave Analysis 05.04.2023

As we can see the market has bounced within wave (x) of ((iv)) and we have been forecasting little more downside within wave c of (y) of ((iv)) to end within equal legs area of 13053.51 - 12892.71. Fast forward, towards the latest update now from 05.09.2023 Asia update we will see that the market has already reacted higher and what we expect next.

NQ_F 1 Hour Asia update 05.09.2023​

NQ_F Short-Term Elliott Wave Analysis 05.09.2023

A very clear reaction higher started taking place from 05.04.2023 within the equal legs area 13053.51 - 12892.71. Reaction higher as an impulse within wave i of (iii) of ((iii)) expecting a ii pullback. Afterwards a wave iii of (iii) higher is expected to take place. We have switched the view to a more aggressive one. You can learn more once become a member at Elliott Wave Forecast.

Source: https://elliottwave-forecast.com/stock-market/nq_f-wave-ii-found-support-equal-legs-area/
 

Elliottwave-Forecast

Master Trader
Feb 17, 2017
2,453
9
84
www.elliottwave-forecast.com
Hello Traders! Today, we will look at the shorter cycles of Toronto-Dominion Bank ($TD) and explain why the stock should soon reach a Blue Box area and react lower. First of all, This is how we saw it in March 2023 expecting a bounce to take place before lower again.

$TD 4H Elliott Wave Analysis May 8th 2023:​

$TD

The bounce in blue (2) is unfolding in a Zigzag (ABC) structure to correct the cycle against Feb 2023 peak. The first swing in red A unfolded in 5 waves from 3.24.2023 low which is an impulsive count. Corrections run in 3, 7 or 11 swings so the 5 waves higher gave a signal that we are going to remain supported against 3.24.2023 at $55.43. The stock pulled back to correct the cycle against 3.24.2023 and ended B. From there, the stock found buyers and made a new high above A. That opened more upside towards the Blue Box area ($64.88 - 69.02) where sellers should be waiting to appear to resume the downside.

Source: https://elliottwave-forecast.com/video-blog/will-td-bank-td-react-lower-blue-box-area/
 

Elliottwave-Forecast

Master Trader
Feb 17, 2017
2,453
9
84
www.elliottwave-forecast.com
$IBM has been trading sideways since it peaked on 02.01.2017. It still has not reached the target at the $82.36 area. This article on 11.2020 shows the target area and and the most likely path at that moment. Since the World Indices bottomed in 2020, the stock has created a five-wave advance. However, the lows back in 2020 came with a momentum divergence. The stock is doing a seven-swing structure, which the Elliott Wave Theory calls a WXY below

WXY (7 Swing) Elliott Wave Structure​


The graph above represents a WXY in the Elliott Wave Theory. It is corrective by nature and needs to erase momentum divergence when the seven swing ends. After the structure ends, the trend will renew higher, and consequently, a massive rally will happen.

$IBM Monthly Elliott Wave Chart​


The monthly chart above shows $IBM with the Elliott Wave labels and blue box target. We believe the stock has ended wave x in red and started the process lower into the target. If we compare the old article from 2020 (link provided earlier above) with the current count, the difference is that wave x took a form of a FLAT. The main idea however remains the same. The following chart shows a flat structure

Flat Elliott Wave Structure​


The graph above shows what a FLAT looks like in the Elliott Wave Theory. Flat is a 3-3-5 structure, which usually tricks traders. It confuse traders with the five waves advance within wave C so traders think it's a new impulse trend. The Flat correction in $IBM has made the push lower into the target time-consuming. But it is seems that it will finally get there and provide an opportunity to buy it. It also offers excellent timing for the World Indices.

Source: https://elliottwave-forecast.com/video-blog/ibm-the-symbol-soon-will-see-buyers/
 

Elliottwave-Forecast

Master Trader
Feb 17, 2017
2,453
9
84
www.elliottwave-forecast.com
The $USDX peaked back on 09.29.2022. Since then, the Index has been dropping. The Index is at risk of ending the cycle since the lows back in 2008. This means a huge selling could be happening now. We explained the idea in this article, published on 09.21.2022. We knew the $USDX was about to enter wave 4. At this stage, that's where we think the Index is. Wave four should still extend lower due to bearish sequence in pairs like the $USDSEK and $USDMXN. Both these pairs have not yet reached the target within their own sequence. The $USDMXN peaked on 04.2020. Since then, it has been doing an ABC lower. It already erased the divergence between A and C, but it has not yet reached the ideal Blue Box target.

Monthly USDMXN Elliott Wave Chart​


The chart above shows the monthly view of the $USDMXN and the blue box target where buyers should enter the market. The $USDSEK also shows a bearish sequence from the peak on 09.28.2022. It shows two channels, and the second one comes with momentum divergences. The decline from the peak has a corrective structure, which we labeled as WXY. Now we are entering wave Y leg, which should also reach the extreme. We expect both pairs to trade lower. If that is the case, $USDX should be weak consequently.

Daily $USDSEK Elliott Wave Chart​


The chart above shows the $USDSEK Daily view and how the pair should move. The divergence between wave (W) and (Y) needs to be erased by the time we reach the blue box target.

Source: https://elliottwave-forecast.com/video-blog/usdsek-and-usdmxn-both-holding-the-usdx/
 

Elliottwave-Forecast

Master Trader
Feb 17, 2017
2,453
9
84
www.elliottwave-forecast.com
Brent Crude (BZ) is the leading global price benchmark for Atlantic basin crude oils. It is used to set the price of two-thirds of the world's internationally traded crude oil supplies. It is one of the two main benchmark prices for purchases of oil worldwide, the other being West Texas Intermediate (WTI). Brent Crude formed significant low on 4.20.2020 low at $15.74 and rally almost 10x to $137 in 2022 before pulling back. In this article, we will look at the Elliott Wave outlook for Brent Crude and when to anticipate the pullback is complete.

Brent Crude Weekly Elliott Wave Chart​


The weekly Elliott Wave Chart of Brent Crude above shows it formed Super Cycle wave (II) low at 15.74 in April 2020 during the Covid-19 selloff. Since then it has rallied significantly and ended wave I at 137 in March 2022. It's now doing a pullback in wave II to correct the rally from April 2020 low. We are still waiting for a sign of bottoming. At this stage, not enough separation is seen yet, thus there's still a possibility of extension lower. We will use the descending trend line from March 2022 high to guide and warn us that the correction is already complete. In the meantime, as far as the trend line has not been broken, another leg lower still can't be ruled out to 47.2 - 62.5 where wave (Y) will be equal to wave (W).

Brent Crude Daily Elliott Wave Chart​


The Daily Chart of Brent Crude oil above shows the decline from wave I peak is unfolding as a double three Elliott Wave structure. Down from wave I, wave ((W)) ended at 83.62 and rally in wave ((X)) ended at 99.56. The instrument has resumed lower in wave ((Y)) with internal subdivision as another double three. Down from wave ((X)), wave (W) ended at 75.11 and wave (X) ended at 87.49. As long as it stays below the bearish channel, we can't rule out further downside in Brent Crude.

Source: https://elliottwave-forecast.com/commodities/brent-crude-bz-still-looking-bottoming-sign/
 

Elliottwave-Forecast

Master Trader
Feb 17, 2017
2,453
9
84
www.elliottwave-forecast.com
In this article we’re going to take a quick look at the Elliott Wave charts of GOLD, published in members area of the website. As our members know, we are favoring the long side in the commodity. GOLD is showing bullish sequences in the cycle from the 1614.3 low. We recommended members to avoid selling , while keep favoring the long side. Recently we got 3 waves pull back that has reached our buying zone. In the further text we are going to explain the Elliott Wave Forecast.

GOLD Elliott Wave 1 Hour Chart 05.05.2023​

Current view suggests that cycle from the 1971.7 low ended as 5 waves rally and now the commodity is giving us pull back. The price structure already shows 3 waves down from the peak. GOLD has reached extreme zone at 2007.9-1976.04 and pull back can complete any moment. We don’t recommend selling the commodity against the main bullish trend and favor the long side. From the marked area we expect to see rally toward new highs or 3 waves bounce alternatively.

You can learn more about Elliott Wave Patterns at our Free Elliott Wave Educational Web Page.

GOLD

GOLD Elliott Wave 1 Hour Chart 05.10.2023​

The commodity found buyers at the Equal legs zone and we are getting good reaction from there. Current view suggests wave ((ii)) pull back ended at 1998.9 low. Rally from the zone reached and exceeded 50 fibs against the (b) blue connector. So, any longs from the equal legs area should be risk free with partial profit taken. We would like to see break above (i)) black peak to confirm next leg up is in progress.

Keep in mind that market is dynamic and presented view could have changed in the mean time. You can check most recent charts in the membership area of the site. Best instruments to trade are those having incomplete bullish or bearish swings sequences. We put them in Sequence Report and best among them are shown in the Live Trading Room


GOLD

Source: https://elliottwave-forecast.com/commodities/gold-xauusd-found-buyers-3-waves-pull-back/
 

Elliottwave-Forecast

Master Trader
Feb 17, 2017
2,453
9
84
www.elliottwave-forecast.com
Hello Traders! Today, we will look at the shorter cycles of Micron Technology Inc ($MU) and explain why the stock should remain supported in the near term. This is how we saw it back in March 2023 expecting a bounce to take place first before lower again.

$MU 4H Elliott Wave Analysis May 15th 2023:​

$MU

The stock has been choppy and trading sideways since the peak on Nov 15, 2022 and the low on Dec 22, 2022. Unable to make new highs or new lows below those 2 pivots kept it trapped in a sideways range until April 2022. The break higher triggered multiple bullish sequences against Mar 13th and Dec 22nd. One can also observe the price action making higher lows since Dec 2022. Every pullback was being bought and now with a break higher, it is expected to remain supported towards the extreme area at $68.71 - 78.56 before a pullback can happen. We like buying dips in 3, 7 or 11 swings at extreme areas until that target is reached.

Source: https://elliottwave-forecast.com/uncategorized/micron-technology-inc-mu-calling-upside-tech-sector/
 

Elliottwave-Forecast

Master Trader
Feb 17, 2017
2,453
9
84
www.elliottwave-forecast.com
In this technical blog, we will look at the past performance of the 4-hour Elliott Wave Charts of GBPNZD. In which, the rally from the 03 February 2023 low unfolded as an impulse sequence and showed a higher high sequence with a bullish sequence stamp. Therefore, we knew that the structure in GBPNZD is incomplete & should see another extension higher to complete the sequence. So, we advised members not to sell the pair & buy the dips in 3, 7, or 11 swings at the blue box areas. We will explain the structure & forecast below:

GBPNZD 4-Hour Elliott Wave Chart From 5.10.2023​

GBPNZD Reacting Strongly From The Blue Box Area

Here’s the 4hr Elliott wave Chart from the 5/10/2023 update. In which, the rally to 2.0393 high ended 5 waves from the 2/03/2023 low in wave 1 & made a pullback in wave 2. The internals of that pullback unfolded as Elliott wave zigzag correction where wave ((a)) ended at 1.9978 low. Then a bounce to 2.0250 high-ended wave ((b)) & started the next leg lower in wave ((c)) towards 1.9834-1.9578 blue box area. From there, buyers were expected to appear looking for new highs ideally or for a 3-wave bounce minimum.

GBPNZD 4-Hour Latest Elliott Wave Chart From 5.13.2023​

GBPNZD Reacting Strongly From The Blue Box Area

This is the latest 4hr Elliott wave Chart from the 5/13/2023 Weekend update. In which the pair is showing a strong reaction higher taking place, right after ending the zigzag correction within the blue box area. Allowed members to create a risk-free position shortly after taking the long position at the blue box area. However, a break above 2.0393 high is still needed to confirm the next extension higher & avoid a double correction lower.

Source: https://elliottwave-forecast.com/forex/gbpnzd-reacting-strongly-blue-box-area/
 

Elliottwave-Forecast

Master Trader
Feb 17, 2017
2,453
9
84
www.elliottwave-forecast.com
Cameco Corporation (ticker: $CCJ) is the world's largest publicly traded uranium company, based in Saskatoon, Saskatchewan, Canada. In 2015, it was the world's second largest uranium producer, accounting for 18% of world production. This article provides the Elliott Wave technical outlook of the company.

$CCJ Monthly Elliott Wave Chart​


Monthly chart of Cameco above shows the stock ended wave (II) at 5.30 and it has resumed higher in wave (III). Up from wave (II), wave ((1)) ended at $28.49 and wave ((2)) completed at 18.03. The stock has resumed higher in wave ((3)). Wave (1) ended at 32.49 and pullback in wave (2) ended at 20.02. It has traded sideways since May last year looking for the next direction. We have a bullish bias and thus calling it higher as a diagonal within wave 1 of (3). However, this view still needs validation by breaking above wave (1).

$CCJ Daily Elliott Wave Chart​


Daily Chart of $CCJ above shows that the stock has traded sideways in the past year. The stock needs to either break above wave (1) or below wave (2) to show us the next direction. Either way, we are bullish against wave (II) low at 5.30. Break above wave (1) would confirm the bullish sequence and opens more upside. Break below wave (2) on the other hand suggests a double correction within wave (2). As far as pivot at 5.3 low stays intact, expect pullback to find support in 3, 7, or 11 swing for further upside.

Source: https://elliottwave-forecast.com/stock-market/cameco-ccj-still-sideways-looking-direction/