Deere & Company (DE) manufactures & distributes various equipment worldwide. The company operates through four segments: Production & Precision Agriculture, small Agriculture & Turf, Construction & Forestry, & Financial services. The company is based in Illinois, US, comes under Industrials sector & trades as “DE” ticker at NYSE.
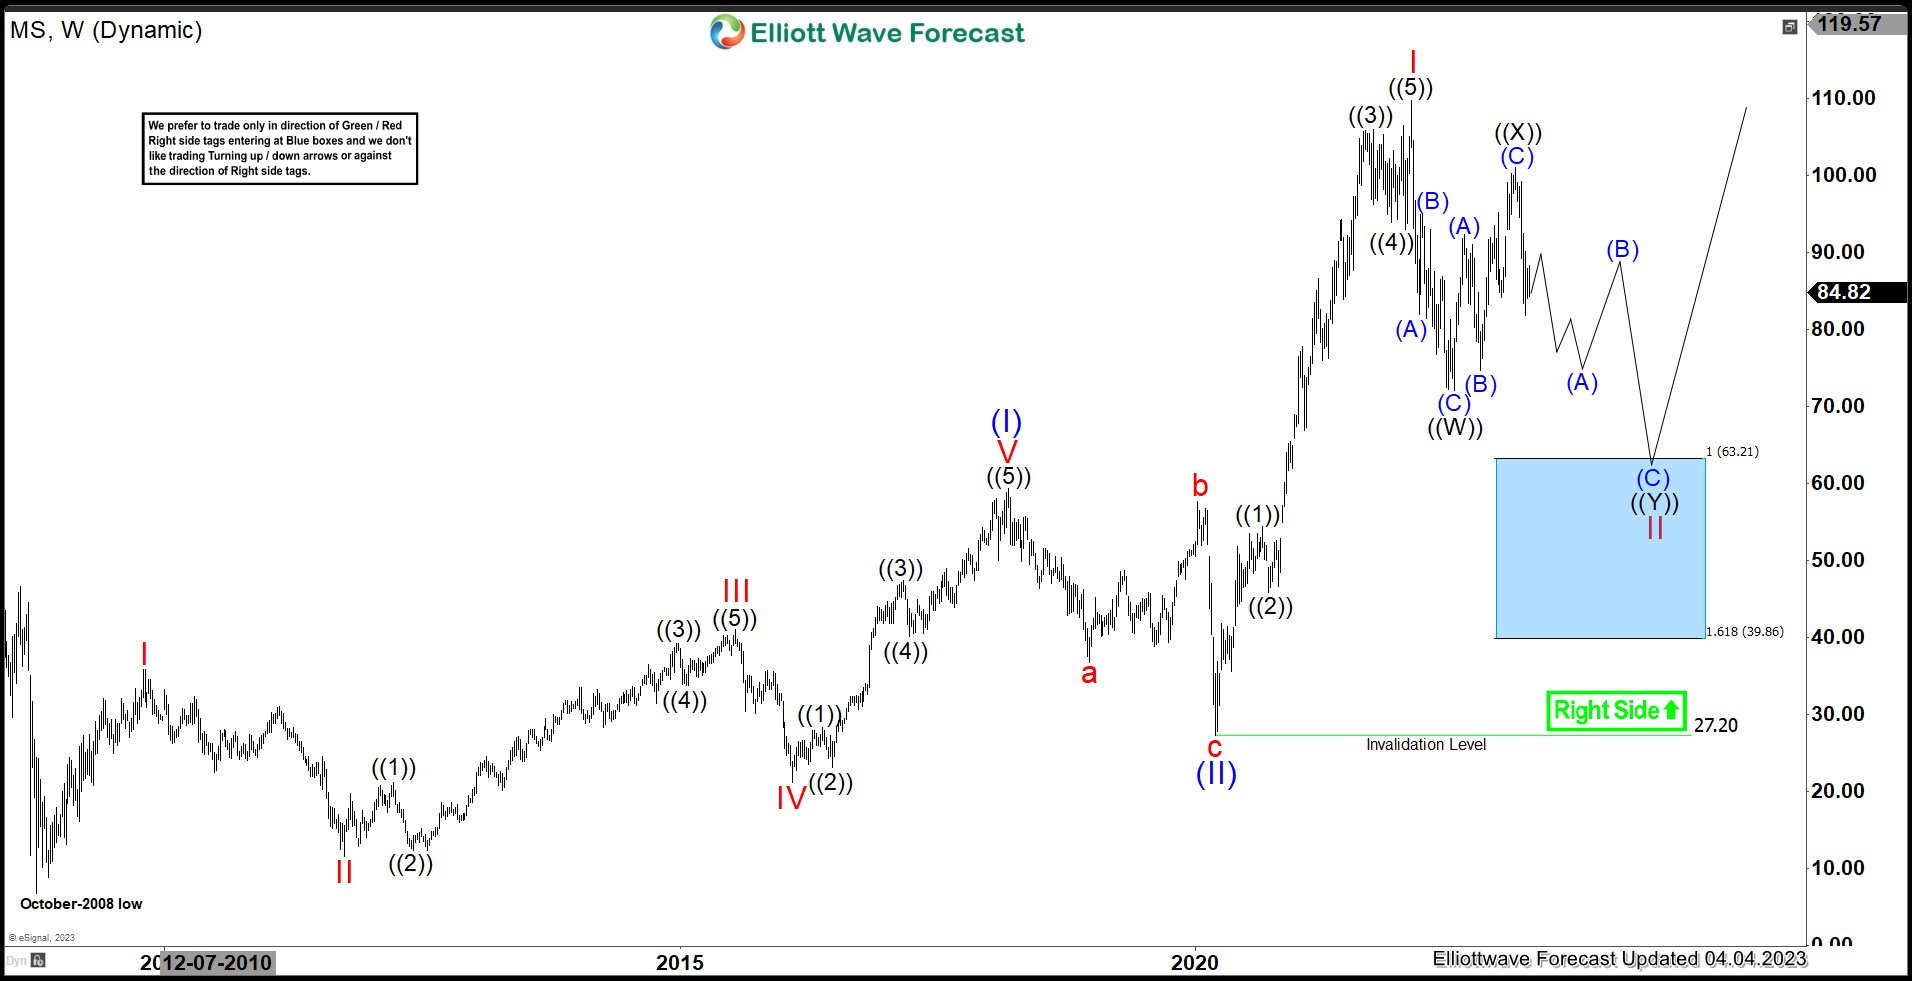
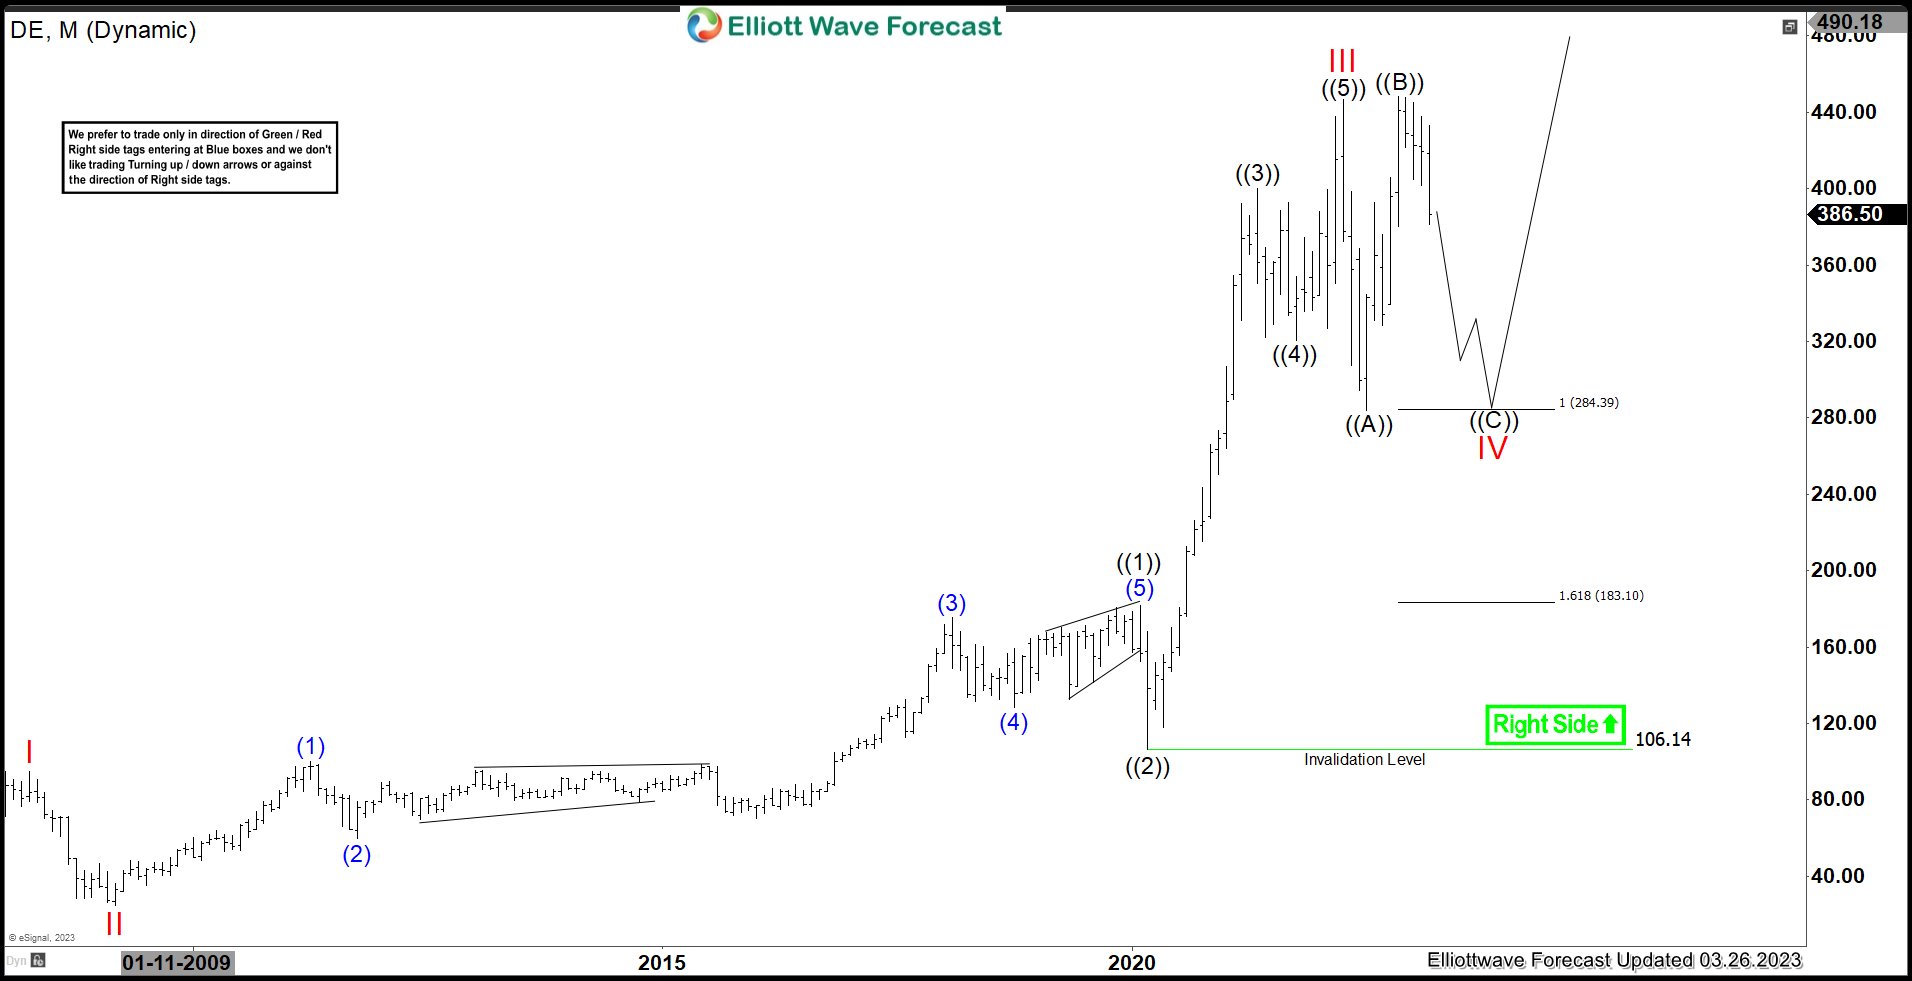
DE showing bullish sequence on monthly chart & favors flat correction in IV before resumes higher. It placed III as impulse at $446.76 high & expect sideways price action in correction before turning higher in V of (I). In previous article, it was expected to extend higher in V, which fails to extend & unfolding in flat correction after reacted higher from the blue box area.
In monthly sequence, it placed I at $94.89 high & II at $24.51 low. Above there, it extended higher in wave III as third wave extension, which finished as III at $446.76 high. Within wave III, it placed ((1)) at $181.99 high & ((2)) at $106.14 low. It favored ended ((3)) at $400.34 high as extended wave & ((4)) at $320.50 low as 0.236 Fibonacci retracement correction. Finally, it ended ((5)) at $446.76 high as wave III.
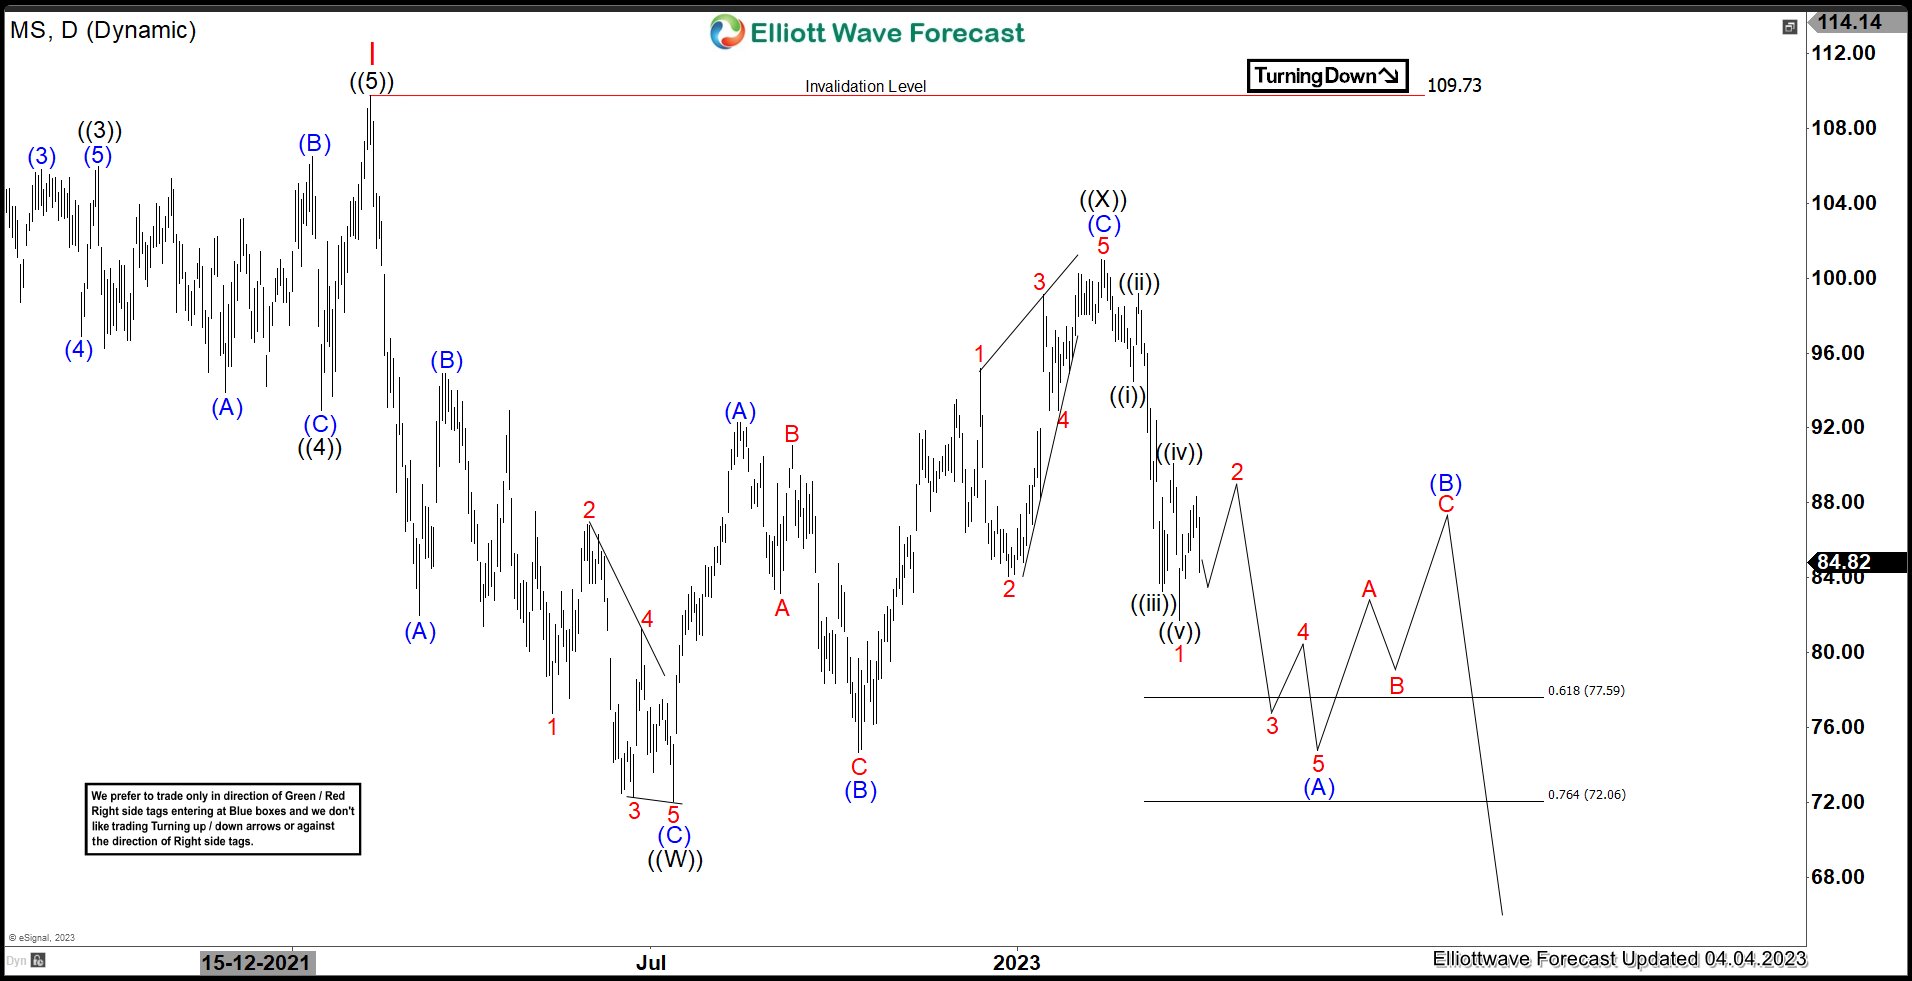
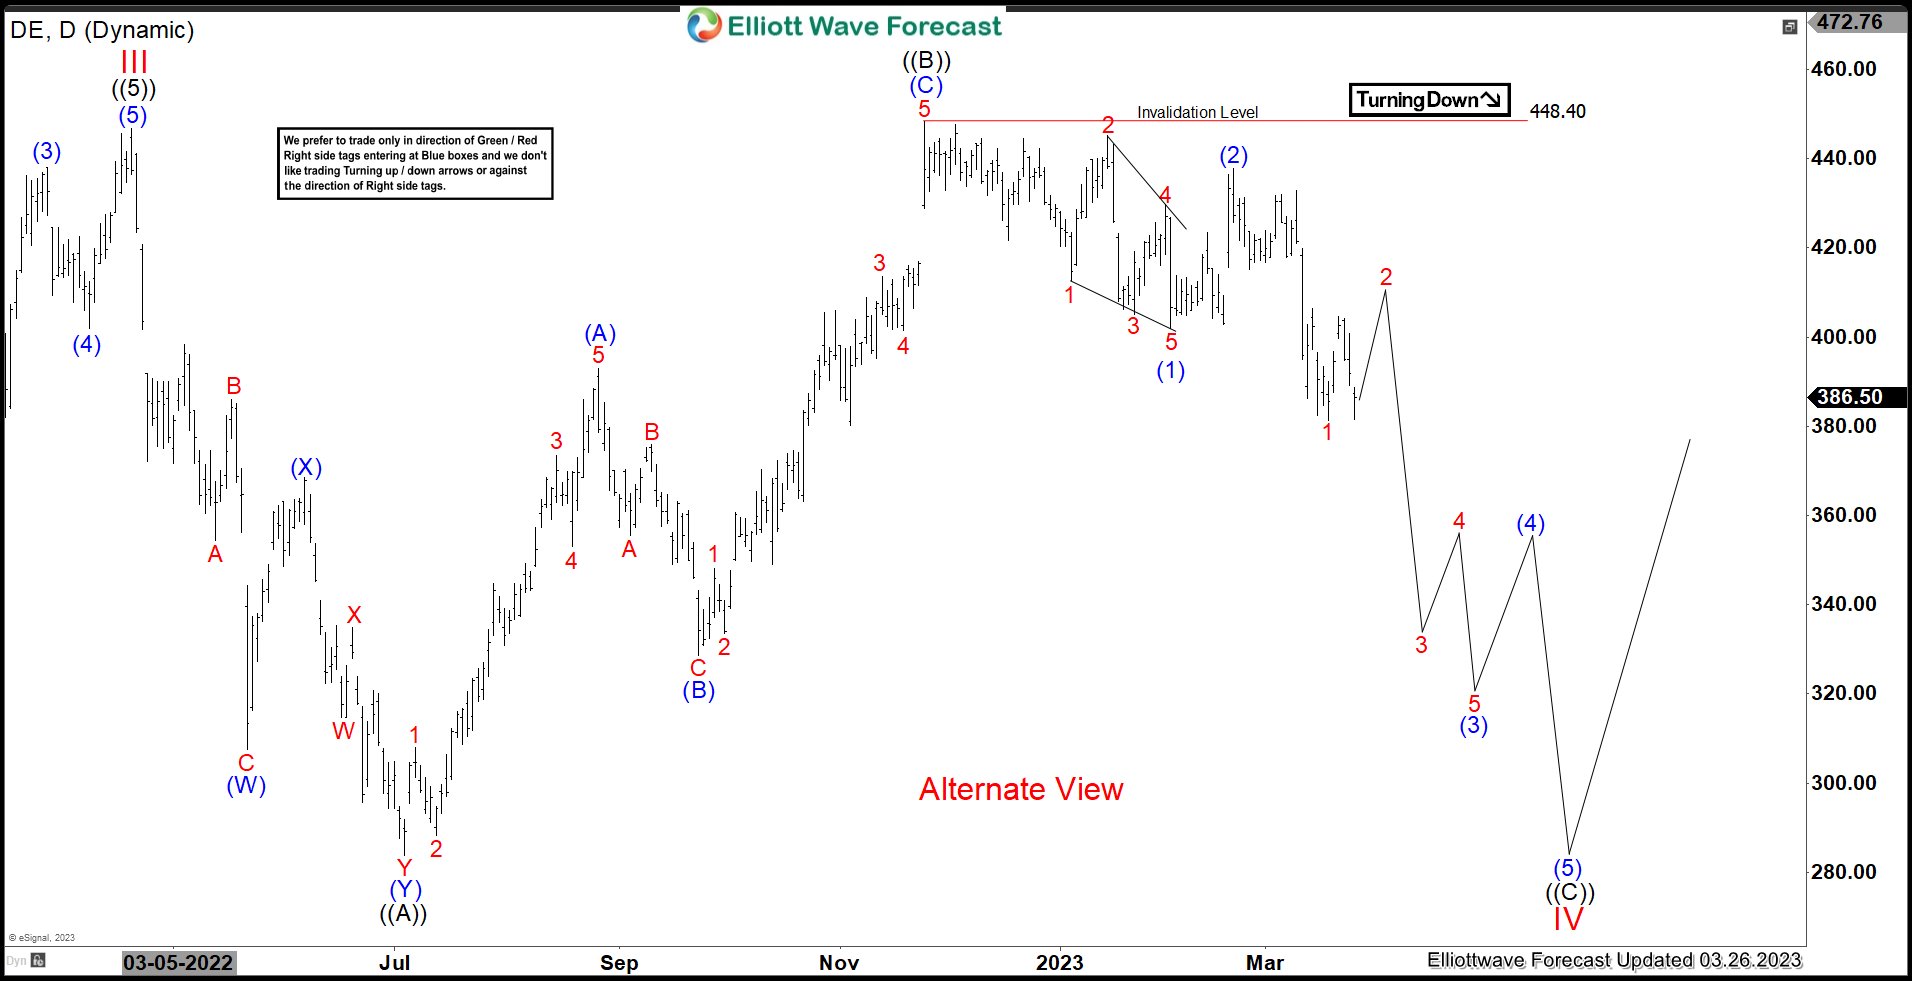
Below III high, it placed ((A)) at $283.81 low on 7/06/2022 as 7 swing correction. Later it placed ((B)) at $448.40 high on 11/23/2022 as 3 swing bounce as the part of flat correction slightly above III high. Currently, it favors pullback in ((C)) leg. It favors lower in (3) of ((C)), while placed (2) at $437.88 high. It expects ((C)) to extend lower towards 284.39 or lower levels to finish it either as running flat or expanded flat correction before upside resumes in V. Short term, it either in 3 of (3), which confirms below 1 low. It even can unfold in triangle IV before upside resumes.
Source: https://elliottwave-forecast.com/stock-market/deere-company-de-favors-sideways-lower-correction/
DE showing bullish sequence on monthly chart & favors flat correction in IV before resumes higher. It placed III as impulse at $446.76 high & expect sideways price action in correction before turning higher in V of (I). In previous article, it was expected to extend higher in V, which fails to extend & unfolding in flat correction after reacted higher from the blue box area.
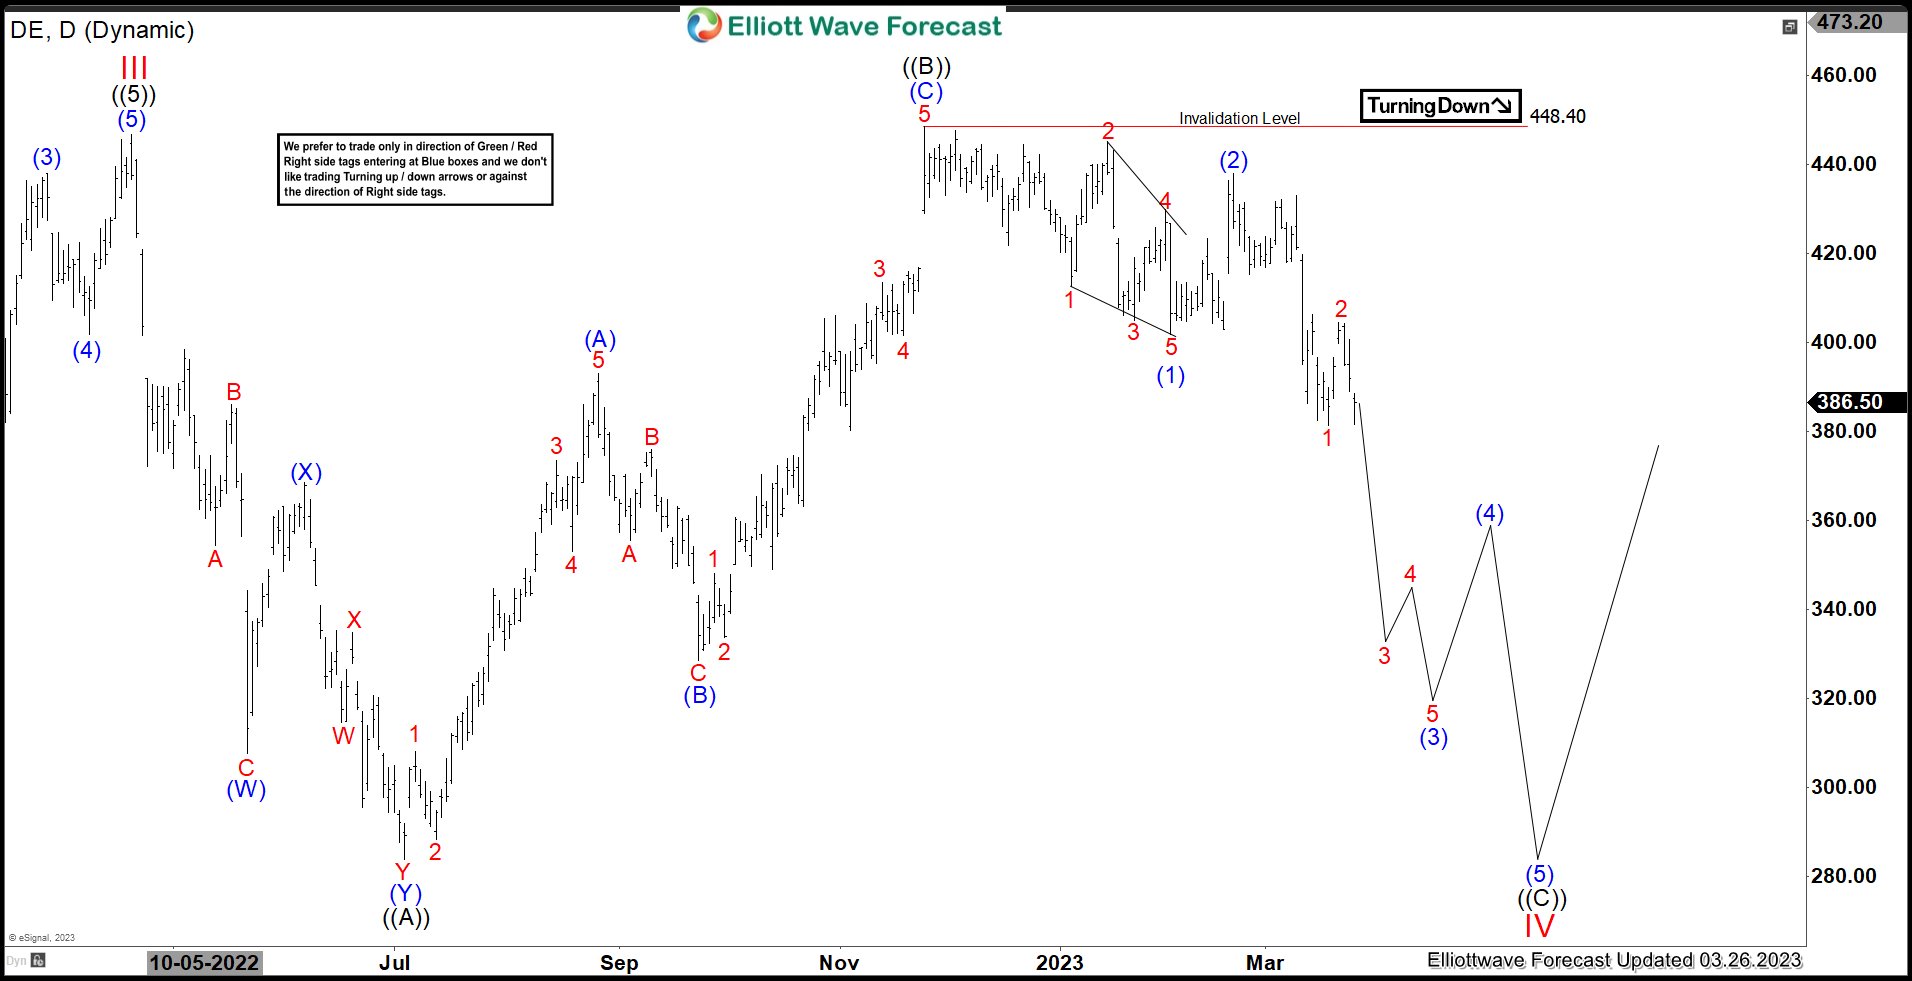
 Daily Elliott Wave Chart")


 Daily Chart April 03 2023")
 Daily Chart April 03 2023 Alternative")