Video | Market Technical | Solid ECN

SOLIDECN

Master Trader
Nov 16, 2021
3,376
23
54
40

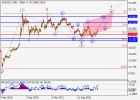
EUR/USD, Elliot Wave Analysis​


The pair may grow.
On the daily chart, the first wave of the higher level 1 of (3) formed, and a downward correction developed as the second wave 2 of (3), within which the wave c of 2 formed. Now, the development of the third wave 3 of (3) started, within which the first wave of the lower level (i) of i of 3 forms. If the assumption is correct, the pair will grow to the levels of 1.1687–1.1907. In this scenario, critical stop loss level is 1.1215.​

eurusd_1.pngeurusd_2.png
 

SOLIDECN

Master Trader
Nov 16, 2021
3,376
23
54
40
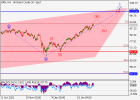
Apple Inc Elliot Wave Analysis

The price is in a correction, a fall is possible.

On the daily chart, the third wave of the higher level 3 developed, within which the wave (5) of 3 formed. Now, a correction has developed as the wave 4 of (5), and a downward correction is developing as the fourth wave 4, within which the wave (A) of 4 is forming. If the assumption is correct, the price will fall to the levels of 148.43–127.03. In this scenario, critical stop loss level is 183.16.


Attachments

  • apple inc_1.png
    apple inc_1.png
    11.2 KB · Views: 0
  • apple inc_2.png
    apple inc_2.png
    10.5 KB · Views: 0

SOLIDECN

Master Trader
Nov 16, 2021
3,376
23
54
40
Brent Crude Oil: prices are holding near record highs


Current trend
Brent Crude Oil prices continue to rise during today's trading, testing the $88.00 per barrel mark and returning to the previous record highs renewed last week. Earlier, the quotes reached their seven-year peaks, reacting to the active recovery of the global economy, as well as interruptions in the supply of oil and oil products in the Middle East. The current growth rate is only slightly lower than in 2009, and optimistic investors suggest that oil prices will be able to consolidate above $100 per barrel by the third quarter of 2022.

Today, traders are focused on an extensive block of macroeconomic statistics from the US. In particular, the markets will be interested in data on the dynamics of business activity indices from Markit for January. Also, during the day, the index of business activity in the industrial sector of the Dallas Fed, as well as the placement of 2-year bonds will be released.

Support and resistance
On the daily chart, Bollinger Bands show a steady growth: the price range is actively narrowing, reflecting the emergence of an ambiguous trading dynamics in the short term. MACD maintains a poor sell signal, being below the signal line but tends to change the trend. Stochastic, retreating from its highs, reversed into a horizontal plane, reacting to the return of the "bullish" dynamics at the end of the last trading week.

Resistance levels: 88.79, 90, 91.
Support levels: 87, 86, 84.5, 83.5.​
 

Attachments

  • usdjpy_1.png
    usdjpy_1.png
    15.7 KB · Views: 0
  • usdjpy_2.png
    usdjpy_2.png
    13.2 KB · Views: 0

SOLIDECN

Master Trader
Nov 16, 2021
3,376
23
54
40
BTC/USD, digital gold remains under pressure

Current trend

Last week, the BTC/USD pair was actively losing value and reached its lowest level since July last year, dropping below 34000.00. The pressure on the first cryptocurrency was caused by a complex of negative factors, although the opinions of investors differ regarding the central one.

Thus, the downward correction of the entire cryptocurrency sector is facilitated by the fall of the American stock market and the growth in the yield of American bonds in anticipation of the imminent increase in interest rates and the meeting of the US Federal Reserve scheduled for Wednesday. Investors fear that the rhetoric of regulator officials may become even more "hawkish" against the background of a record increase in inflation in the country, which could lead to further strengthening of the US currency against alternative assets.

Among other factors putting pressure on the digital market, experts cite the report of the Bank of Russia on cryptocurrencies, which recommends banning both their use and activities for the extraction of digital assets due to threats to financial stability, the well-being of citizens, and the sovereignty of monetary policy. If such a decision is made, BTC mining may suffer since the country accounts for more than 10% of the world's hashrate, and Russia is one of the top three in terms of cryptocurrency mining.

Support and resistance
Now the price of the BTC/USD pair is around 35000.00 (Fibonacci correction 50.0%), consolidation below which allows a decline to 31250.00 (Murrey [5/8]), 28300.00 (Fibonacci correction 61.8%). The breakout of 37500.00 allows an upward correction to the area of 41700.00 (Fibonacci correction of 38.2%, which will unlikely break the currently observed downtrend. Indicators signal the possibility of a decrease: Bollinger bands are directed downwards, the MACD histogram is increasing in the negative zone.

Resistance levels: 37500.00, 41700.00
Support levels: 35000.00, 31250.00, 28300.00.

btcusd_analysis.png
 

SOLIDECN

Master Trader
Nov 16, 2021
3,376
23
54
40
Silver, Elliot Wave Analysis

The pair may grow.
On the daily chart, the first wave of the higher level (1) of 3 formed, a downward correction developed as the wave (2) of 3, and the development of the third wave (3) of 3 started. Now, the first wave of the lower level i of 1 of (3) has formed, a local correction has developed as the wave ii of 1, and the wave iii of 1 is forming, within which the development of the wave (iv) of iii is ending. If the assumption is correct, after the end of the correction, the price will grow to the levels of 26.76–28.68. In this scenario, critical stop loss level is 22.72.​

silver_1.pngsilver_2.png
 

SOLIDECN

Master Trader
Nov 16, 2021
3,376
23
54
40
PayPal Holdings, Elliot Wave Analysis

The price may fall.

On the daily chart, the third wave of the higher level (3) developed, and a downward correction develops as the fourth wave (4). Now, the wave C of (4) is forming, within which the third wave of the lower level iii of C has formed, a local correction has ended as the fourth wave iv of C, and the wave v of C is developing. If the assumption is correct, the price will fall to the levels of 140.00–128.71. In this scenario, critical stop loss level is 179.02.​

paypal_1.pngpaypal_2.png
 

SOLIDECN

Master Trader
Nov 16, 2021
3,376
23
54
40
AUD/USD, the instrument renews local lows

Current trend

During the Asian session, the AUD/USD pair shows flat dynamics, holding near the level of 0.7130. Yesterday, the instrument steadily declined, having renewed local lows of December 20. However, by the time the daily session was closed, it partially restored lost positions.

The asset was supported by poor US macroeconomic data, which reduced the likelihood that the US Federal Reserve would raise rates more than four times in 2022. Thus, Markit Manufacturing PMI for January fell from 57.7 to 55.0 points, while analysts' forecasts suggested a decline to 56.7 points. Service PMI fell from 57.6 to 50.9 points, which was worse than forecasts of 55.0 points.

On Tuesday, further development of the upward dynamics is facilitated by data from Australia. In the fourth quarter of 2021, the consumer price index increased by 1.3% QoQ and 3.5% YoY, which was better than analysts' forecasts of +1.0% QoQ and +3.2% YoY.

Support and resistance
On the daily chart, Bollinger bands try to reverse into a horizontal plane. The price range expands from below, but not as fast as the "bearish" activity develops. The MACD indicator shows a moderate decline and keeps the same sell signal (the histogram is below the signal line). Stochastic keeps its downtrend but is quickly approaching its lows, indicating that the instrument may become oversold in the ultra-short term.

Resistance levels: 0.7160, 0.7200, 0.7250, 0.7300.
Support levels: 0.7128, 0.7100, 0.7050, 0.7000.


Attachments

  • audusd_1.png
    audusd_1.png
    15.9 KB · Views: 0
  • audusd_2.png
    audusd_2.png
    13.4 KB · Views: 0

SOLIDECN

Master Trader
Nov 16, 2021
3,376
23
54
40
GBP/USD, the "bearish" momentum intensifies

Current trend

The British pound remains under pressure due to the difficult epidemiological situation in the country and poor macroeconomic data, and the GBP/USD pair may continue to decline towards the 1.3418–1.3365 area. Thus, Composite PMI in industry and services in the UK fell to 53.4 points from 53.6 points a month earlier, while analysts expected the index to rise to 55.0 points.

The long-term trend in the GBP/USD pair is downwards. After the breakdown of 1.3610, the rate decreases to 1.3418–1.3365. If this area is broken, further development of negative dynamics to the lows of December 2021 is possible.

The medium-term trend remains upwards. A correction is developing within its trend, the target of which is to test the key support at 1.3405–1.3370, after which new purchases can be considered with the target at the year's high.

Support and resistance
Resistance levels: 1.3610, 1.3710, 1.3820.
Support levels: 1.3418, 1.3365, 1.3200.​

gbpusd_1.pnggbpusd_2.png
 

SOLIDECN

Master Trader
Nov 16, 2021
3,376
23
54
40
Ripple Technical analysis

Current trend

The XRP/USD pair continues to trade within a long-term downward channel.

Last week, the token price dropped to the area of 0.5859, where it is now consolidating. The breakdown of this level allows further decline to the levels of 0.4883 and 0.3906. The key “bullish” area is the resistance zone of 0.7812–0.75. Its breakout allows growth to the levels of 0.91 and 0.9766.

In general, the downward trend in the market continues, which is confirmed by a downward reversal of Bollinger bands and an increase in the MACD histogram in the negative zone. However, the upward reversal of Stochastic from the oversold zone does not exclude a corrective growth of the Ripple to the area of 0.75 but is unlikely to break the current downtrend.

Support and resistance
Resistance levels: 0.75, 0.7812, 0.91, 0.9766.
Support levels: 0.5859, 0.4883, 0.3906.​

xrp_1.png
 

SOLIDECN

Master Trader
Nov 16, 2021
3,376
23
54
40
EUR/USD by Solid ECN Securities
US Fed meeting results determine the dynamics of the pair

Current trend

This week, the EUR/USD pair actively fell due to the strengthening of the American currency, currently trading around 1.129.

The dollar is rising as investors await the outcome of the first meeting of the US Federal Reserve this year, which will end today. It is predicted that officials of the department will leave the rate at the same level in January but will announce their readiness to raise it in March. Most experts believe that to combat inflation, which was fixed at 7.0% for December, the regulator may need four or more adjustments this year. Another issue will be the reduction of the department's balance sheet, which has more than doubled during the pandemic. Most likely, the process will be launched as early as May or June after completing the emergency asset purchase program. In general, the market is tuned to the "hawkish" rhetoric of the US Federal Reserve, which, in turn, should contribute to further strengthening of the US currency but may create additional pressure on the stock market.


Support and resistance
The consolidation below 1.1290 allows the EUR/USD pair to decrease to 1.1230 - 1.1185 . The key "bullish" level is 1.1350, Fibonacci correction, 23.6%, the middle line of Bollinger bands, which breakout will become a catalyst for upward dynamics to the area of 1.1470 , Fibonacci correction 38 .2%. The indicators do not give a single signal: Bollinger bands are horizontal, the MACD histogram is near the zero line, its volumes are insignificant, and Stochastic reverses upwards.

Resistance levels: 1.1350, 1.1413, 1.1475.
Support levels: 1.1290, 1.1230, 1.1185.​

eurusd.png
 

SOLIDECN

Master Trader
Nov 16, 2021
3,376
23
54
40
USD/CAD
Decline under pressure from rising oil prices

Current trend

After the USD/CAD pair couldn't break the resistance level of 1.2650, it resumed its downward dynamics to 1.2500. The pressure on the asset is exerted by the growth of quotations for WTI Crude Oil, which reached $86 per barrel. Further strengthening of the oil prices to 90.00 will contribute to the continued decline of the USD/CAD pair and allow the "bears" to reach the level of 1.2500.

The long-term trend in the USD/CAD pair is upwards. At the moment, a correction is developing, and the breakdown of 1.2500 allows reaching the key support near 1.2295.

The medium-term trend is downwards. This week, the pair corrected to the key resistance 1.2706–1.2683, which allowed the "bulls" to close positions at favorable prices, and the "bears" — to form new sales with the targets at the last week's lows. The breakout of the key resistance of the trend allows growth to the target zone 2 (1.2950–1.2926).

Support and resistance
Resistance levels: 1.2650, 1.2850, 1.2936.
Support levels: 1.2500, 1.2295, 1.2161.​

usdcad_1.pngusdcad_2.png
 

SOLIDECN

Master Trader
Nov 16, 2021
3,376
23
54
40
USD/CAD, Elliot Wave Analysis by Solid ECN

The pair may grow.

On the daily chart, a downward correction developed as the wave of the higher level 4, and the development of the fifth wave 5 started, within which the wave (1) of 5 forms. Now, the third wave of the lower level 3 of (1) is developing, within which the wave i of 3 has formed, and a local correction has ended as the wave ii of 3. If the assumption is correct, the pair will grow to the levels of 1.3200–1.3410. In this scenario, critical stop loss level is 1.2446.​
 

Attachments

  • usdcad_2.png
    usdcad_2.png
    10.6 KB · Views: 0
  • usdcad_1.png
    usdcad_1.png
    11 KB · Views: 0

SOLIDECN

Master Trader
Nov 16, 2021
3,376
23
54
40
The pound is under pressure from the results of the US Fed meeting

Currently, the pound is under pressure from the outcome of the US Fed meeting. The regulator, as expected, announced its intention to raise the interest rate on short-term loans by 0.25% in the near future, but the exact date was not announced, however experts continue to believe that this will happen in March. In addition, a reduction in the balance sheet of the US Fed was announced, which now significantly exceeds the required volume. Commenting on the current situation, the head of the regulator Jerome Powell noted that the recovery of the labor market and rising inflation suggest that the economy no longer needs serious stimulation. At the same time, the risks of a long delay in inflation at current levels and even its growth remain, but officials do not consider this scenario to be basic. In general, Powell's comments indicate the intention of the department to continue tightening monetary policy, which in the long term will support the US currency.

Resistance levels: 1.3550, 1.3672, 1.3732.
Support levels: 1.3427, 1.3366, 1.3306.​

gbpusd_1.png
 

SOLIDECN

Master Trader
Nov 16, 2021
3,376
23
54
40
Brent Crude Oil, Elliot Wave Analysis


The price may grow.

On the daily chart, the upward wave C forms, within which the first wave 1 of (1) of C develops. Now, the fifth wave of the lower level v of 1 is forming, within which the wave (iii) of 1 is developing. If the assumption is correct, the price will grow to the levels of 100.00–115.00. In this scenario, critical stop loss level is 69.45.

oil_1.pngoil_2.png
 

SOLIDECN

Master Trader
Nov 16, 2021
3,376
23
54
40
Gold, Elliot Wave Analysis

The pair may grow.

On the daily chart, the fifth wave of the higher level (5) develops, within which the first entry wave 1 of (5) formed, the correctional wave 2 of (5) developed, and the wave 3 of (5) forms. Now, the third wave of the lower level iii of 3 is developing, within which the wave (iii) of iii is forming. If the assumption is correct, the pair will grow within the wave to the levels of 1919.90–2067.60. In this scenario, critical stop loss level is 1752.82.​
 

Attachments

  • gold_1.png
    gold_1.png
    11.3 KB · Views: 0
  • gold_2.png
    gold_2.png
    12.8 KB · Views: 0