Video | Market Technical | Solid ECN

SOLIDECN

Master Trader
Nov 16, 2021
3,165
22
54
39

Netflix Inc, Elliot Wave Analysis


The price may fall.
On the daily chart, the third wave of the higher level (3) developed, and a downward correction started to develop as the fourth wave (4). Now, the wave and of (4) is forming, within which the third wave of the lower level iii of A has formed, and a local correction is developing as the wave iv of A. If the assumption is correct, after the end of the correction, the price will fall to the levels of 465.32–411.70. In this scenario, critical stop loss level is 620.94.​

netflix_1.pngnetflix_2.png
 

SOLIDECN

Master Trader
Nov 16, 2021
3,165
22
54
39

USD/JPY: US dollar wins back its losses​


Current trend
The US dollar shows strong growth against the Japanese yen in Asian trading, quickly retreating from local lows, updated at the end of the last trading week. On Friday, the US currency updated its lows from December 20, 2021, dropping just below 113.50. Nevertheless, the instrument failed to consolidate at new levels, and already on the same day the US dollar won back most of its losses.

It is also worth noting that on Friday a large block of macroeconomic statistics was released in the US, which turned out to be quite weak, but did not cause the expected negative reaction on the market. Anyway, along with a significant drop in Retail Sales, the data also reflected a decline in Industrial Production in December by 0.1%, while analysts had expected it to grow moderately by 0.4%. Michigan Consumer Sentiment Index in January fell from 70.6 to 68.8 points, which turned out to be worse than forecasts for a decline to 70 points.

Support and resistance
In the D1 chart, Bollinger Bands are reversing horizontally. The price range is expanding from below, remaining spacious enough for the current activity level in the market. MACD is going down preserving a stable sell signal (located below the signal line). The indicator is about to test the zero level for a breakdown. Stochastic, on the contrary, indicates the growth of the instrument. The indicator reversed upwards near its lows, reflecting the strongly oversold dollar in the ultra-short term.

Resistance levels: 114.50, 115.00, 115.50, 116.00.
Support levels: 114.00, 113.50, 113.00, 112.50.​

usdjpy_1.pngusdjpy_2.png
 

SOLIDECN

Master Trader
Nov 16, 2021
3,165
22
54
39
S&P 500: the beginning of the reporting season has disappointed investors


Current trend
Due to a not very positive start to corporate reporting, the leading index of the US economy, S&P 500, corrects downwards, trading around 4655.0.

Among the index's major components, financial conglomerate JPMorgan Chase & Co. was one of the first to publish its data, showing a quarterly income of $29.26B, which was below $29.65B a quarter earlier and $29.78B predicted by analysts. Despite the poor earnings performance, earnings per share were $3.33, well above the $3.01 expected. Bad news came from the large pharmacy chain Walgreens Boots Alliance. The company said some pharmacies would close over the weekend as the state is understaffed by the continued spread of the omicron strain. These reports come after fourth-quarter earnings of $33.9B were reported, well ahead of the $32.88B forecasted.

Securities again began to rise, putting additional pressure on the stock market. Leading 10-year US bonds are trading at 1.793%, up from Friday's 1.750%.

Growth leaders include Las Vegas Sands Corp. (+14.15%), Wynn Resorts Ltd. (+8.60%), and Discovery Inc. (+7.04%).

Among the decline leaders there are JPMorgan Chase & Co. (–6.15%), Monster Beverage Corp. (–4.73%), and Simon Property Group Inc. (–4.47%).

Support and resistance
The index quotes move within a global upward channel near the support line. Technical indicators reversed and gave a local sell signal: indicator Alligator's EMA fluctuations range expands downwards, and the histogram of the AO oscillator trades in the sell zone.

Resistance levels: 4710.0, 4800.0.
Support levels: 4593.0, 4500.0.​

sp500.png
 

SOLIDECN

Master Trader
Nov 16, 2021
3,165
22
54
39
Tesla Inc, General Review


Current trend
The stocks of Tesla Inc., the world's leading manufacturer of electric cars, continue the global correction, trading at 1049.00.

Due to a large amount of incoming information, the instrument's volatility remains high. Yesterday, the corporation announced that the production of the long-awaited new Cybertruck was postponed again, and its start is postponed to Q1 2023. It was previously planned to start work in the second half of 2022, but the delay is caused by the desire of the developers to make changes to the features and functionality of the truck.

Global sales of leading US assets by large investors continue. Following the head of Tesla Inc., Elon Musk, they began to sell shares and large funds. On Thursday, the ARK Innovation ETF and ARK Generation Internet ETF sold a total of 87.756K shares of the company for over $90M.

The financial report will be published on 26 January. Analysts expect quarterly revenue to reach a record $16.79B despite the sell-off and negative news, and earnings per share could hit $2.21.

Support and resistance
Quotes are moving within the corrective downward channel, after which the global uptrend may continue. Technical indicators keep a poor buy signal: fast EMAs on the Alligator indicator are above the signal line, and the AO oscillator histogram moves close to the transition level.

Resistance levels: 1105, 1200.
Support levels: 1000, 892.

tesla.png
 

SOLIDECN

Master Trader
Nov 16, 2021
3,165
22
54
39
EURUSD Elliot Wave Analysis


The pair may grow.
On the daily chart, the first wave of the higher level 1 of (3) formed, and a downward correction developed as the second wave 2 of (3), within which the wave c of 2 formed. Now, the development of the third wave 3 of (3) started, within which the first wave of the lower level (i) of i of 3 forms. If the assumption is correct, the pair will grow to the levels of 1.1687–1.1907. In this scenario, critical stop loss level is 1.1268.​

eurusd_1.pngeurusd_2.png
 

SOLIDECN

Master Trader
Nov 16, 2021
3,165
22
54
39
AUD/USD: Australian currency develops a "bearish" momentum


Current trend
The Australian dollar shows an active decline against the US currency during the Asian session, developing the corrective momentum of last Friday and testing the level of 0.7200 for a breakdown.

The US dollar is again in demand on the market amid expectations of an increase in interest rates by the US Fed. In addition, traders are somewhat concerned about the rapid increase in the dynamics of the incidence of coronavirus, which threatens the recovery of the global economy.

Support and resistance
Bollinger Bands in D1 chart demonstrate a stable decrease. The price range is almost constant, remaining rather spacious for the current level of activity in the market. MACD is declining keeping a weak sell signal (located below the signal line). Stochastic keeps a confident downward direction but is rapidly approaching its lows, which indicates the risks of oversold instrument in the ultra-short term.

Resistance levels: 0.72, 0.725, 0.73, 0.7328.
Support levels: 0.716, 0.7128, 0.71, 0.705.​
 

Attachments

  • audusd_1.png
    audusd_1.png
    16.6 KB · Views: 0
  • audusd_2.png
    audusd_2.png
    13.2 KB · Views: 0

SOLIDECN

Master Trader
Nov 16, 2021
3,165
22
54
39
ETH/USD
Singapore government rhetoric reinforces the "bearish" trend


Current trend
The ETH/USD pair started the current week with a decline within the general market trend.

Medium-term pressure on the sector is exerted by investors' expectation of a tightening of the monetary policy of the US Federal Reserve. The completion of the emergency program of bond purchases and the first increase in interest rates may occur as early as March, leading to further strengthening of the US currency. An additional negative factor for ETH could be the tightening of regulation of the cryptocurrency industry in Singapore. The other day, the country's monetary authority (MAS) banned the widespread advertising of digital assets and the installation of cryptomats. Officials explained their decision to complicate access to tokens to prevent rash trade in them and protect their citizens. All firms working with digital assets, including banks, payment services, and exchanges, fall under the new rules.

Singapore is one of the leading countries in terms of the population's degree of acceptance of ETH. According to experts, more than 43% of local traders own this particular cryptocurrency, and tightening regulation of the sector may make it difficult to work with the asset.

Support and resistance
Resistance levels: 3437.50, 3750.00, 4140.00.
Support levels: 3125.00, 2812.50, 2500.00, 2300.00.​

ethusd.png
 

SOLIDECN

Master Trader
Nov 16, 2021
3,165
22
54
39
Crude Oil, Market Analysis in 1 Minute


Current trend
During the Asian session, Brent Crude Oil prices are actively growing, testing the level of 87.00 for a breakout and renewing record highs since October 2018.

The quotes are moderately supported by the weakening of investors' fears that the rapid spread of the Omicron strain will negatively affect the pace of national economic recovery from the consequences of the coronavirus pandemic. In the meantime, indicators continue to stabilize, and the leading central banks are ready to continue the tightening monetary policy cycle. However, some skeptics still fear that the recovery in demand may not be able to keep with the increase in supply, given all the current risks.

On Monday, the quotes of "black gold" traded with restraint against the backdrop of news from Libya, where production volumes recovered to 1.2M barrels per day. Last week, it declined noticeably due to the blocking of several western fields.

Support and resistance
On the daily chart, Bollinger Bands steadily grow. The price range widens, but not as fast as the "bullish" sentiment develops in the short term. The MACD indicator grows, keeping a strong buy signal (the histogram is above the signal line). Stochastic keeps a confident upward trend but is close to its highs, indicating that the instrument may become overbought in the ultra-short term.

It is better to keep the current long positions until the signals from technical indicators are clarified.

Resistance levels: 87.00, 88.50, 89.50.
Support levels: 86.00, 84.50, 83.50, 82.64.​


SOLIDECN

Master Trader
Nov 16, 2021
3,165
22
54
39
Gold is consolidating at $1800


Current trend
Gold prices are consolidating near the psychological support at $1800, developing a weak downtrend since the end of last trading week. Demand for the precious metal is moderately declining as investor activity recovers. Traders ignore the difficult epidemiological situation in the world and focus on the prospects for further tightening of monetary policy by leading financial regulators. First of all, one should expect a rate increase from the US Federal Reserve and the Bank of England, while the European Central Bank is in no hurry to take active steps, waiting for more clear signals from the economy.

The macroeconomic statistics from the US released the day before did not have a noticeable impact on the dynamics of the instrument; however, it attracted attention with a sharp drop in the new york Empire State Manufacturing Index. In January, the indicator fell from 31.9 to -0.7 points, while forecasts suggested a decline to only 25.7 points.

Today, investors are focused on the statistics from the US on the dynamics of the construction market and data from Canada on the Consumer Price Index for December. In turn, statistics on inflation in Germany and the UK will be released in Europe.​


Support and resistance
In the daily chart, Bollinger Bands are reversing horizontally. The price range is slightly narrowing from above, reflecting the correctional decline in the short term. MACD is declining keeping a weak sell signal. Stochastic shows a more confident decline, but at the moment it is quickly approaching its lows, indicating growing risks of the instrument being oversold in the ultra-short term.

Resistance levels: $1814, $1823, $1831.
Support levels: $1805, $1800, $1790, $1778.32​


Attachments

  • gold_1.png
    gold_1.png
    17.8 KB · Views: 0
  • gold_2.png
    gold_2.png
    13.7 KB · Views: 0

SOLIDECN

Master Trader
Nov 16, 2021
3,165
22
54
39
XRP/USD Technical Analysis


Current trend
The XRP/USD pair continues to trade within the long-term descending channel.

Last week, the token price attempted to rise to the level of 0.7812 (Murray [0/8]), supported by the middle line of Bollinger Bands, but could not break above it and resumed the decline. Currently, the quotes are trying to gain a foothold below 0.7500 (Fibo retracement of 61.8%) in order to continue the downward trend to the area of 0.5860 (Murray [-2/8]) and 0.5110 (the area of the lows of July last year).

The 0.7812 level remains key for the "bulls". Its breakout will give the prospect of growth of the trading instrument to 0.9100 (Fibo retracement of 50.0%), however, this option of price movement seems less likely, since the indicators point out the continuation of the downward trend: the Bollinger Bands and Stochastic are directed downwards, the MACD histogram is stable in the negative zone.

Support and resistance
Resistance levels: 0.7812, 0.9100, 0.9766.
Support levels: 0.7500, 0.6836, 0.5860, 0.5110.​

xrpusd.png
 

SOLIDECN

Master Trader
Nov 16, 2021
3,165
22
54
39

GBP/USD​

Political uncertainty weighs on the pound​


Current trend
This week, the GBP/USD pair corrected down to 1.3570, but today it is trying to restore lost positions. In general, the British currency is influenced by a number of opposite factors.

The December data on inflation in the United Kingdom published today confirmed its further growth: the consumer price index rose from 5.1% to 5.4%, reaching its highest since 1992. The negative dynamics due to the increase in the cost of energy carriers should prompt the Bank of England to raise the interest rate again in early February, which, in turn, will serve as a catalyst for strengthening the pound. In addition, the UK has signs of a gradual exit from the coronavirus pandemic caused by the Omicron strain. The incidence in the country is gradually decreasing, which allows officials to announce the mitigation of existing quarantine measures as early as next week.

On the other hand, the growth of quotations is hindered by the problems of the national labor market and the intensifying political crisis, which now occupy significant attention of investors. According to November data, wage growth in the UK is slowing down and is seriously not keeping up with the increase in inflation, which may negatively affect consumption and the state of the economy as a whole. Meanwhile, investors are following the development of the situation in the country's parliament: Boris Johnson is getting closer to losing the post of prime minister due to the scandal caused by his presence at the event, while strict coronavirus restrictions were in effect on the territory of the United Kingdom. Members of the Conservative Party have already begun collecting parliamentary requests to begin the procedure for removing a politician from office.

Under these conditions, the US currency looks more stable and attractive for investment, as the market expects a cycle of interest rate hikes by the US Fed, the first of which may take place as early as March.

Support and resistance
The price of the GBP/USD pair has returned to the framework of the descending channel and is close to 1.3549 (Murray [7/8], middle line of Bollinger Bands). Its breakdown will give the prospect of further decline to the area of 1.3427 (Murray [6/8]). In case of a breakout of the level of 1.3672 (Murray [8/8]), the upward dynamics of the trading instrument will be able to continue to 1.3740 (January highs) and 1.3795 (Murray [+1/8]). The indicators do not give a single signal, confirming the uncertainty of the market: the Bollinger Bands are directed up, the Stochastic is directed down, while the MACD histogram is decreasing in the positive zone.

Resistance levels: 1.3672, 1.3740, 1.3795.
Support levels: 1.3549, 1.3427, 1.3305.​

gbpusd.png
 

SOLIDECN

Master Trader
Nov 16, 2021
3,165
22
54
39
Key Releases


United States of America
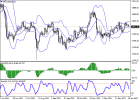
The US currency is weakening today against its main competitors – the yen, the pound and the euro.

The published December data of the American labor market turned out to be positive: the number of construction permits issued increased from 1.717M to 1.873M, and the number of new homes whose construction has just begun increased from 1.678M to 1.702M. Today, the head of the White House, Joe Biden, is due to speak at a press conference on the occasion of the anniversary of his inauguration. He will inform citizens about his new legislative initiatives, as well as about further plans to combat the coronavirus pandemic.​


Eurozone
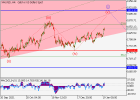
The European currency is strengthening against the USD, weakening against the pound and has ambiguous dynamics paired with the Japanese yen.

December data on the consumer price index in Germany were published today, which recorded an acceleration of inflation in the country. On a monthly basis, the index increased from -0.2% to 0.5%, and on an annual basis – from 5.2% to 5.3%. The pressure in the German and European economies as a whole continues to increase. In these circumstances, investors are turning their attention to the decisions of the European Central Bank (ECB), hoping that the regulator's officials will begin a more active fight against price increases following their colleagues from the Bank of England and the US Fed. However, the matter does not go beyond comments and hints yet. Last week, ECB Head Christine Lagarde said that inflation in the eurozone this year should decrease from the record high levels currently observed, and the agency is ready to take any measures necessary to reduce it to the target of 2.0%. The official's rhetoric was interpreted by some investors as a hint at the possibility of raising rates, but more specifically, the regulator's intention will be known only in early February, when the first meeting of the current year will take place. The head of the French central bank and ECB member Francois Villeroy de Galhau noted that France's economic growth has not slowed down from the rapid spread of the COVID-19 Omicron strain, but inflation in the eurozone's second-largest economy is still too high.​


United Kingdom
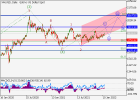
The British currency today is strengthening against its main competitors – the euro, the yen and the USD.

The December data on inflation in the United Kingdom published today confirmed its further growth: the consumer price index rose from 5.1% to 5.4%, reaching its highest since 1992. The negative dynamics due to the increase in the cost of energy carriers should prompt the Bank of England to raise the interest rate again in early February, which, in turn, will serve as a catalyst for strengthening the pound. In addition, the UK has signs of a gradual exit from the coronavirus pandemic caused by the Omicron strain. The incidence in the country is gradually decreasing, which allows officials to announce the mitigation of existing quarantine measures as early as next week. On the other hand, the growth of quotations is hindered by the problems of the national labor market and the intensifying political crisis, which now occupy significant attention of investors. According to November data, wage growth in the UK is slowing down and is seriously not keeping up with the increase in inflation, which may negatively affect consumption and the state of the economy as a whole. Meanwhile, investors are following the development of the situation in the country's parliament: Boris Johnson is getting closer to losing the post of prime minister due to the scandal caused by his presence at the event, while strict coronavirus restrictions were in effect on the territory of the United Kingdom. Members of the Conservative Party have already begun to collect parliamentary requests to begin the procedure for removing the politician from office, but he himself does not intend to resign.​


Japan
The Japanese currency is weakening against the pound, strengthening against the USD and has ambiguous dynamics paired with the euro.

Today, the Japanese government has extended emergency measures to the capital Tokyo and more than a dozen other regions of the country to stop the rapid spread of the COVID-19 Omicron strain. These measures will allow local authorities to limit the mobility of the population and business activity, reducing the opening hours of bars and restaurants and other establishments of mass attendance. So far, the incidence in Japan remains at high levels, and officials fear that the national health system may not be able to withstand the increased number of hospitalizations. Tomorrow, bidders expect the publication of data on foreign trade for December. It is predicted that the volume of imports of Japanese goods may slow down growth from 43.8% to 42.5%, and exports – from 20.5% to 16.0%. The implementation of forecasts may put pressure on the Japanese currency.​


Australia
The Australian currency is strengthening against its main competitors – the euro, the pound, the yen and the USD.

The Australian dollar shows an upward trend in trading, despite the negative January data on the consumer sentiment index from Westpac: the indicator decreased from -1.0% to -0.2%. Australian citizens fear the deterioration of the epidemic situation and the tightening of quarantine restrictions, but Australian Prime Minister Scott Morrison said that the government does not plan to introduce additional sanitary measures, even despite the surge in the incidence. Moreover, the official announced the cancellation of visa fees for students and people who want to get a job at local enterprises for the next 12 weeks. These measures should reduce the labor shortage created during the pandemic.​


Oil
Oil quotes are making moderate attempts to decline today.

The pressure on prices was exerted by statements from representatives of the International Energy Agency (IEA). Officials of the ministry noted that the supply of oil will soon exceed demand, as some producers may reach historical production peaks in Q1 2022. In particular, the department believes that the USA, Canada, Brazil, Saudi Arabia and Russia can seriously increase production. During the day, investors also expect the publication of a weekly report on the amount of oil reserves in the USA from the American Petroleum Institute (API). The last time the indicator decreased by 1.077M barrels, and the continuation of this trend may support oil quotes.​
 

SOLIDECN

Master Trader
Nov 16, 2021
3,165
22
54
39
AUD/USD: wave analysis


The probability of the pair reduction remains.
On the daily chart, the development of the first wave of the higher level (1) of C has completed and a downward correction as wave (2) of C continues to be formed. At the moment, wave A of (2) has formed and wave B of (2) is developing, in which wave b of B is being formed. If the assumption is correct, after the completion of wave B of (2) the pair will continue to decline to the levels of 0.6742–0.6446. The level of 0.7616 is critical and stop-loss for this scenario.

audusd_1.pngaudusd_2.png
 

SOLIDECN

Master Trader
Nov 16, 2021
3,165
22
54
39
Gold, Elliot Wave Analysis


The pair may grow.
On the daily chart, the fifth wave of the higher level (5) develops, within which the first entry wave 1 of (5) formed, the correctional wave 2 of (5) developed, and the wave 3 of (5) forms. Now, the first wave of the lower level i of 3 is developing, within which a local correction has ended as the wave (iv) of i, and the fifth wave (v) of i is developing. If the assumption is correct, the pair will grow within the wave to the levels of 1919.90–2067.60. In this scenario, critical stop loss level is 1752.82.​
 

Attachments

  • gold_1.png
    gold_1.png
    10.9 KB · Views: 0
  • gold_2.png
    gold_2.png
    11.6 KB · Views: 0

SOLIDECN

Master Trader
Nov 16, 2021
3,165
22
54
39
McDonald’s Corp. Elliot Wave Analysis


The price may rise.
On the daily chart, the fifth wave of the higher level (5) is developing, as part of which the wave 3 of (5) continues forming. At the moment, the third wave of the lower level iii of 3 is developing, as part of which wave (iii) of iii is developing. If the assumption is correct, the price will rise in wave (iii) of iii to 280.00–295.00. The level of 244.07 is critical and stop-loss for this scenario.​

mcdonald_1.pngmacdonald_2.png
 

SOLIDECN

Master Trader
Nov 16, 2021
3,165
22
54
39
GBP/USD
The pound is developing flat dynamics​


Current trend
The pound is traded in different directions against the US currency during the morning session, consolidating near 1.3600 and local lows from January 18.

The US dollar is actively recovering its positions at the end of the week; however, its growth is limited by not the most confident macroeconomic statistics from the US. Disappointing data came out the day before, reflecting an increase in the number of Initial Jobless Claims from 231K to 286K, while analysts expected a further decrease in the figure to 220K. The number of Continuing Jobless Claims for the week ended January 7 increased from 1.551M to 1.635M, which also turned out to be worse than preliminary market estimates at 1.58M.

Today, investors are waiting for the publication of December data on the dynamics of Retail Sales in the UK. Analysts' forecasts, however, do not promise any support for the pound, and therefore the corrective sentiment in the asset may develop further.​


Support and resistance
On the D1 chart, Bollinger Bands are reversing into a horizontal plane. The price range is narrowing, reflecting the appearance of mixed dynamics of trading in the short and ultra-short term. MACD is going down preserving a stable sell signal (located below the signal line). Stochastic, having approached its lows, is trying to reverse into a horizontal plane, indicating risks of an oversold pound in the ultra-short term. Under these conditions, trading participants should look at the possibility of the appearance of corrective dynamics for the instrument in the nearest time intervals.

Resistance levels: 1.3650, 1.3700, 1.3750, 1.3800.
Support levels: 1.3600, 1.3550, 1.3500, 1.3460.​

gbpusd_1.pnggbpusd_2.png
 

SOLIDECN

Master Trader
Nov 16, 2021
3,165
22
54
39
AUD/USD
The Australian dollar ends the week with flat dynamics​


Current trend
The Australian dollar, thanks to the active actions of the “bears”, is losing ground at the end of the current trading week, testing the level of 0.7200 for a breakdown. AUD/USD pair is losing ground and moving into the “red” zone, despite the fact that there are not many fundamental reasons for the growth of the American currency. The data released the day before from the US failed to support the “bullish” sentiment of investors in the US currency, neither within the data on Initial Jobless Claims, nor on the statistics of Existing Home Sales.

In turn, on Thursday, the Australian dollar managed to enlist fairly strong support from market participants after the publication of a strong report on the Australian labor market for December. The Employment Change increased by 64.8K jobs, which turned out to be significantly better than market expectations of 30K jobs. At the same time, the Unemployment Rate in the country in December fell to new record lows at around 4.2%, although analysts' forecasts suggested a decline from only 4.6% to 4.5%.

Support and resistance
On the daily chart, Bollinger Bands show flat dynamics. The price range remains virtually unchanged, remaining spacious enough for the current level of activity in the market. MACD is stretching into a line along the zero level, signaling an approximate balance of power between sellers and buyers in the short term. Stochastic is trying to reverse upwards, near the level of “20” and indicating the continuation of the “bullish” momentum since the middle of the week.

Resistance levels: 0.7250, 0.7300, 0.7328, 0.7369.
Support levels: 0.7200, 0.7160, 0.7128, 0.7100.​

audusd_1.pngaudusd_2.png
 

SOLIDECN

Master Trader
Nov 16, 2021
3,165
22
54
39
USD/CAD
Negative trend in the US labor market intensifies


Current trend
The Canadian currency continues to resist the growth of the US dollar quite successfully, and USD/CAD has been relatively neutral throughout the current trading week. The instrument demonstrates local lateral dynamics against the background of the publication of economic statistics from Canada and is located in the area of 1.2522.

The key inflation indicator, the Consumer Price Index, remained at the level of 4.8% in December, having fallen by 0.1% compared to the November indicator; however, the Core CPI showed an increase to 4.0% in annual terms, which reflects high net consumer demand within the country, signaling the active pace of economic recovery in this direction. Statistics on the volume of Wholesale Sales also turned out to be positive: the indicator increased by 3.5% against the forecast of 2.7%. In general, one can already observe a slowdown in inflation, which indicates the effectiveness of the actions of the Bank of Canada in the field of monetary policy.

American investors expect decisive action from the US Federal Reserve as well, as annual inflation in the country has reached its highest level in almost 40 years, but many experts doubt that the tightening of monetary policy will have a positive impact, given the maximum amount of economic stimulus introduced by the authorities during the pandemic. In addition, since the beginning of the year, a negative trend has been observed in the national labor market, where an increase in jobless claims is observed. Initial Jobless Claims rose to 286K from 231K a week earlier, according to data yesterday, beating economists' expectations of 220K. Continuing Jobless Claims increased to 1.635M, well above last week's 1.551M and putting quite a bit of pressure on the US dollar.


Support and resistance
On the global chart of the asset, the price has finished working out the Head and Shoulders pattern and is ready to fix it with a reverse retest of the Neckline. Technical indicators are in a global sell signal state: the EMA fluctuation range on the Alligator indicator is still quite wide, and the AO oscillator histogram is forming up bars, hinting at a possible correction.

Support levels: 1.2467, 1.2315.
Resistance levels: 1.2556, 1.2637.

usdcad_1.png
 

SOLIDECN

Master Trader
Nov 16, 2021
3,165
22
54
39
EUR/USD
The dollar continues to dominate the pair​


Current trend
Quotes of EUR/USD are being corrected, trading around 1.1322 after updating of the local lows of January 10 yesterday. The European currency continues unsuccessful attempts to consolidate in the uptrend, but the growth of quotations is hindered by weak macroeconomic statistics from the eurozone, which once again pointed to record inflation rates in the region.

According to published data, in December, the growth of consumer prices in annual terms reached 5.0%, while the monthly rate was fixed at 0.4%. Representatives of the European Central Bank (ECB) continue to assure that the current situation is the result of high energy prices, and the indicator of the Core Consumer Price Index, which does not include this category of goods, indirectly confirms this, remaining at the level of 2.6%. For this reason, the regulator is in no hurry to adjust the parameters of monetary policy and, in particular, to raise interest rates, limiting itself only to curtailing the asset purchase program (PEPP) until the end of March, which undoubtedly hinders the growth of the euro.

In the meantime, the US currency cannot decide on the priority direction of movement. On the one hand, investors hope for the beginning of a cycle of raising interest rates, and on the other hand, the labor market is again actively declining. According to statistics, the number of Initial Jobless Claims increased by 55K, amounting to 286K against 220K expected by analysts. It is also alarming that the negative dynamics have been observed for the fourth week in a row.

Support and resistance
Despite all attempts to grow, EUR/USD remains within the framework of the global Flag pattern, the implementation of which has not yet begun. The EMA fluctuation range on the Alligator indicator narrowed almost completely, and the AO oscillator histogram began to form descending bars again.

Support levels: 1.1271, 1.1050.
Resistance levels: 1.1378, 1.1525.

eurusd_1.png