Video | Market Technical | Solid ECN

SOLIDECN

Master Trader
Nov 16, 2021
3,376
23
54
40
AUDUSD
Australian currency shows neutrality


The Australian currency is showing neutral trading dynamics due to ambiguous macroeconomic statistics, being currently around 0.715.

On the one hand, the position of the AUDUSD pair was strengthened by the report on building permits, the number of which increased by 8.2%.

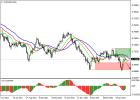
On the global chart, the price moves within a long downtrend. Technical indicators are in the state of a weakening sell signal: indicator Alligator’s EMA fluctuations range narrows actively, and the AO histogram forms rising bars in the sell zone.

Resistance levels: 0.7182, 0.7315.
Support levels: 0.7100, 0.6991.​

audusd.png
 

SOLIDECN

Master Trader
Nov 16, 2021
3,376
23
54
40
Gold | By Solid ECN Securities
Trading participants reduce positions in gold


The development of the global sideways range of 1850–1730 in the gold continues, and the quotes are once again holding slightly above the key level of $1,800 per ounce.

There are no serious prerequisites for the growth of the asset yet, but there are not so many pressure factors either. The situation may change only in March during the meeting of the US Federal Reserve when the regulator's decision to raise the interest rate will be announced. To this point, traders should focus on the US dollar index and investment demand. Currently, the USD Index consolidates at the level of 95.5 after one of the most dynamic falls in recent years, which led to the current upward correction in gold. However, the observed dynamics have little prospects for further development in light of Friday's positive employment report in the US.

Support and resistance
On the daily chart, the price moves within the global sideways channel, correcting towards the resistance line. Technical indicators maintain a sell signal.

Fast EMAs on the Alligator indicator are below the signal line, and the AO oscillator histogram has moved into the sell zone and is forming local rising bars.

Resistance levels: 1830, 1870.
Support levels: 1790, 1720.

gold.png
 

SOLIDECN

Master Trader
Nov 16, 2021
3,376
23
54
40
BTCUSD Technical Analysis by Solid ECN Securities

Current trend

The BTCUSD pair attempted to rise last week and is currently testing the level of 42000 (Fibonacci retracement 38.2%), but for the “bullish” momentum to develop, the quotes will have to break the resistance zone of 42000–43750. In this case, the trading instrument may reach the level of 50000.

The key “bearish” level is the middle line of Bollinger bands around 38500. The consolidation below it allows a decrease to the levels of 34375 and 31250. In general, despite the correction, the downside potential does not look exhausted, which is confirmed by technical indicators.

Bollinger bands are directed downwards, and Stochastic has entered the overbought zone, which may mean the end of the corrective growth.

Resistance levels: 42000, 43750, 46875, 50000.
Support levels: 38500, 34375, 31250.​

btcusd.png
 

SOLIDECN

Master Trader
Nov 16, 2021
3,376
23
54
40
USDCAD market update by Solid ECN Securities
The pair is testing 1.2700 for a breakout

Current trend

The US dollar demonstrates active growth in pair with the Canadian currency during the trading in Asia, once again testing the level of 1.27 for a breakout.

The US currency received short-term support on Friday after the publication of a strong report on the labor market for January, which turned out to be much better than investors' forecasts. Strong data reinforced the belief of market participants that the US Fed may act more aggressively in choosing the vector of monetary policy. In particular, it is possible that at the March meeting of the regulator, the rate will be raised immediately by 50 basis points.

In turn, the Canadian report on the labor market, also released last Friday, was extremely disappointing.

Resistance levels: 1.27, 1.275, 1.2786, 1.2812.
Support levels: 1.265, 1.26, 1.2558, 1.25.​

usdcad_1.pngusdcad_2.png
 

SOLIDECN

Master Trader
Nov 16, 2021
3,376
23
54
40
USDCHF Market Analysis by Solid ECN Securities
Consolidation in anticipation of new drivers


Yesterday, the quotes were supported by the publication of data on unemployment. At the end of January, the indicator fell from 2.4% to 2.3%, better than the market's neutral forecasts. The report on the labor market for January also surpassed the preliminary estimates of experts. In particular, Nonfarm Payrolls amounted to 467K, which was more than three times better than market expectations. Wage data also added optimism: hourly wages rose by 0.7% MoM and 5.7% YoY for January, which was better than analysts' forecasts of 0.5% and 5.2%.

On the daily chart, Bollinger bands are steadily growing.
The price range narrows slightly, remaining quite spacious for the current level of activity in the market. The MACD indicator reverses upwards, keeping a relatively strong buy signal. Stochastic shows a more confident upward trend but is rapidly approaching its highs, indicating that the US dollar may become overbought in the ultra-short term.

Resistance levels: 0.926, 0.9276, 0.93, 0.9341.
Support levels: 0.922, 0.92, 0.9177, 0.9157.​

usdchf_1.pngusdchf_2.png
 

SOLIDECN

Master Trader
Nov 16, 2021
3,376
23
54
40
ETHUSD Market Analysis by Solid ECN Securities
upward correction may end
Current trend
This week, the ETHUSD pair continues to add value and has now risen to the area of 3235.00, which corresponds to four-week highs.

Experts do not have a consensus on the drivers of the current upward dynamics, but many of them believe that the growth is caused by the enthusiasm of investors against the background of the release of January data from the American labor market. The indicators turned out to be significantly better than preliminary estimates and confirmed the overall resilience of the American economy to the consequences of the pandemic caused by the COVID-19 Omicron strain. This, in turn, aroused interest in risky assets, including digital ones, on the part of bidders.

As for the ETH positions, in the long term they continue to be supported by the expectation of the merger of the Ethereum and Ethereum 2.0 networks and the transition to the Proof-of-Stake (PoS) algorithm. The main operating network is still experiencing significant problems due to high fees and limited bandwidth, which specialists cannot solve in any way. The other day, Ethereum founder Vitalik Buterin and lead developer Tim Beiko proposed a new improvement option – to use transactions with a large amount of binary data ("blob-carrying transactions"). This measure is seen as temporary, for a period until the Ethereum 2.0 network becomes fully functional. The launch of the new function may take place after the next hard fork.

Resistance levels: 3125, 3437.5, 3750.
Support levels: 3000, 2700, 2500.​

ethusd.png
 

SOLIDECN

Master Trader
Nov 16, 2021
3,376
23
54
40

EURUSD Market Analysis by Solid ECN Securities​

Recovery attempts after a "bearish" start to the week

The European currency shows weak growth against the US dollar during the Asian trading session, trying to recover from the "bearish" start of the week. The instrument is testing 1.1430 for a breakout, waiting for additional growth drivers to appear.

Meanwhile, macroeconomic statistics from Europe, released at the beginning of the week, does not provide any support to the single currency. In particular, on Monday, investors were disappointed by the data from Germany.

The instrument was also influenced by the results of the speech of the head of the European Central Bank (ECB), Christine Lagarde. The official again noted that inflation in the region does not yet threaten economic stability, and therefore does not require an immediate response in the form of tightening monetary policy. So far, the European regulator is following the path of the US Federal Reserve, which for quite a long time refused to recognize systemic inflationary risks, preferring to call the rapid rise in prices only a temporary phenomenon.

Conclusion & signal
> The economic data is against the Euro.
> The pair roams in the ichimoko cloud.
> The pair broke the trendline and the level 23.6 of the Fibonacci level
> Sideway warket for the day.

Sell area @1.151 targeting @1.135

eurusd_signal.png
 

SOLIDECN

Master Trader
Nov 16, 2021
3,376
23
54
40
XAUUSD by Solid ECN Securities
Gold renews local highs

During the Asian session, gold prices are rising moderately, developing the "bullish" momentum since the beginning of the month and recovering from a sharp decline at the end of January. Supported by relatively poor positions in the American currency, the instrument approached testing the level of 1830 for a breakout upwards. Also, the "bulls" on the dollar are waiting for the data on consumer inflation in the US for January, hoping that they will become another signal in favor of a faster tightening of monetary policy by the US Federal Reserve. In turn, a further increase in gold quotes is hindered by a noticeable increase in the yield of treasury bonds both in the US and in Europe.

The US macroeconomic statistics released yesterday did not provide any noticeable support to the dollar. Thus, the business optimism index from the NFIB for January fell from 98.9 to 97.1 points. The index of economic optimism from IBD/TIPP retreated from 44.7 to 44.0 points in February, while the forecasts suggested that the indicator would increase to 47.2 points.

Support and resistance
Resistance levels: 1831, 1840, 1847, 1853.
Support levels: 1823, 1814, 1805.5, 1800.

gold.png
 

SOLIDECN

Master Trader
Nov 16, 2021
3,376
23
54
40

GBPUSD by Solid ECN Securities​

The market is waiting for US inflation data​


Current trend
The GBPUSD pair is trading around 1.355, waiting for new serious drivers for the movement, which may appear on Thursday after the publication of January inflation data in the USA and comments by the head of the Bank of England Andrew Bailey.

Investors expect the official to hint at further actions of the regulator in relation to the current price increase, exerting increasing pressure on local households. It should be noted that the National Institute of Economic and Social Research of Great Britain (NIESR) has recognized that the cycle of rate increases in the country does not keep pace with the rate of inflation, and the government should support the actions of the Bank of England by postponing tax increases and expanding public spending. Also, the strengthening of the pound's position is hindered by the situation around Prime Minister Boris Johnson, whose resignation is still likely.

Resistance levels: 1.361, 1.3732, 1.3793.
Support levels: 1.3488, 1.3366, 1.33.​

gbpusd.png
 

SOLIDECN

Master Trader
Nov 16, 2021
3,376
23
54
40
Ripple technical analysis

Current trend
The XRPUSD is trading within a long-term descending channel, however, since the beginning of this month, there has been a corrective growth in quotations.

Currently, the price is testing the 0.91 mark (Fibonacci retracement 50.0%) and in case of consolidation above it, it will continue to grow to the upper boundary of the descending channel (1.0000 area) or to the 1.0742 level (Murray [7/8], Fibo retracement 38.2%). The key support zone for the bears remains 0.7812–0.7500 (Murray [4/8], 61.8% Fibo retracement). Its breakdown will give the prospect of the price returning to the area of annual lows of 0.5859 (Murray [2/8]) or to the level of 0.4883 (Murray [1/8]).

Technical indicators do not give a single signal: the MACD is increasing in the positive zone, but the Stochastic is preparing to leave the overbought zone and form a sell signal. In addition, the price chart has gone beyond the upper Bollinger Band, which also points out the possibility of a downward reversal.

Support and resistance
Resistance levels: 0.91, 1, 1.0742.
Support levels: 0.75, 0.5859, 0.4883.​

xrpusd.png
Post automatically merged:

USDJPY by Solid ECN Securities

The pair is aiming for the January high

Due to the difference in approaches to regulating monetary processes by the Bank of Japan and the US Federal Reserve, the USDJPY pair is strengthening its position and has now reached the level of 115.4, preparing to continue its upward trend towards 116.10.

The long-term trend is upwards. Yesterday, the price broke through the resistance level of 115.40, and the next growth target was 116.1, which breakout allows the quotes to rise to the 117 area.

The medium-term trend is upwards. Last week, the price reversed at the support level of 114.45. It renewed the local high at 115.60, which breakout will allow the rate to rise to the 116.25 area.

Resistance levels: 116.1, 117.
Support levels: 114.3, 113.5, 112.7.​

usdjpy_1.pngusdjpy_2.png
 

SOLIDECN

Master Trader
Nov 16, 2021
3,376
23
54
40

Brent Crude Oil Brent Crude Oil insights by Solid ECN Securities​

Investors fear Iranian oil entering the market

Brent Crude Oil prices are correcting, trading around 90.20. The day before, the quotes of the trading instrument significantly lost in value against the backdrop of resumed negotiations in Vienna on the "nuclear deal" between Iran and the leading countries of Europe, in addition to which representatives of Russia and China take part. According to analysts' forecasts, it is the current eighth round of negotiations that has the highest chances of success. In the event that sanctions are lifted from the Iranian oil industry, up to 1.6M barrels of cheap oil per day may begin to enter the market, which, as investors fear, will upset the current balance of supply and demand.

The day before, the US Department of Energy published a traditional forecast for the oil market in the near future. Expected energy demand for 2022 rose to 100.6M barrels per day from 100.5M barrels. The forecast for the average oil production in the United States in 2022 was raised to 11.97M barrels per day, and to 12.6M barrels for 2023. The average oil price, according to the agency's expectations, will rise to 82.87 dollars instead of 74.95 dollars.

Support and resistance
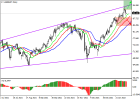
On the global chart, the asset continues to rise as part of the global pattern Expanding Formation. Technical indicators are still holding a fairly strong buy signal: the fluctuation range of the Alligator EMA is still quite wide and the histogram of the AO oscillator, being in the buy zone, forms local bars with a downtrend.

Support levels: 88.07, 84.20.
Resistance levels: 92.20, 95.00.​

oil_1.png
 

SOLIDECN

Master Trader
Nov 16, 2021
3,376
23
54
40

NZDUSD market insights by Solid ECN Securities​

The pair is consolidation at local highs

The New Zealand dollar traded flat against the US dollar during the Asian session, holding near 0.668. The day before, NZDUSD showed active growth, updating local highs from January 26, in response to a general improvement in market sentiment.

In addition, the US currency remains under pressure ahead of today's publication of statistics on consumer inflation, as well as the monthly report on the state of the US budget for January. The market expects confirmation of a moderate increase in price pressure in the country, which will become an additional argument for the US Federal Reserve to tighten monetary policy. The start of the interest rate hike cycle is expected in March, but now the main question is how much the rate will be adjusted.

Tomorrow, investors will be focused on a block of statistics from New Zealand. In particular, traders expect January statistics on Electronic Card Retail Sales, as well as Business NZ PMI. The index is projected to moderately increase from 53.7 to 55.3 points.

Resistance levels: 0.67, 0.6732, 0.6761, 0.68.
Support levels: 0.665, 0.66, 0.6528, 0.65.​

nzdusd_chart.png
 

SOLIDECN

Master Trader
Nov 16, 2021
3,376
23
54
40

USDJPY insights by Solid ECN Securities​

The market is waiting for US inflation data

During the Asian session, the USDJPY pair shows moderate growth, holding near local highs, renewed yesterday. The instrument is testing the level of 115.6 for a breakout, waiting for additional drivers to move.

Today, the focus of American investors is the January statistics on consumer inflation. It is expected that the price pressure in the US will continue to rise moderately and renew the previous 40-year highs. It will be an additional argument in favor of a more rapid tightening of the US Federal Reserve's monetary policy, which counts on launching a rate hike cycle in March.

Resistance levels: 115.67, 116, 116.34, 117.
Support levels: 115, 114.5, 114, 113.5.​

usdjpy.png
 

SOLIDECN

Master Trader
Nov 16, 2021
3,376
23
54
40

AUDUSD market insights by Solid ECN Securities​

Australia's economy is recovering steadily

The Australian currency demonstrates relative stability against the background of the neutrality of the US dollar, currently forming a local uptrend and trading around 0.7172.

Macroeconomic statistics coming from Australia indicate that the country's economy continues to recover from the effects of the coronavirus pandemic confidently.The index of building permits issued for January added 8.2%, which coincided with preliminary market estimates and exceeded the December increase of 2.6%. Thus, the probability that the Australian dollar will end the trading week with positive dynamics is quite high.

The situation in the currency pair may seriously change today after the publication of inflation data in the US. Investors are closely watching the dynamics of consumer prices in light of the possible start of a cycle of interest rate hikes by the US Federal Reserve in March this year. According to analysts, the figure will rise to 7.3%, surpassing the December value of 7.0%. If the forecast is implemented, the probability of a rate increase will increase significantly, locally supporting the US dollar, which has been trading almost neutral since Monday.

On the global chart, the price moves within a long downtrend. Technical indicators are in the state of a sell signal, which is already ready to change to an upward one: the EMA fluctuation range on the Alligator indicator is actively narrowing, and the AO histogram forms upward bars in the sell zone.

Resistance levels: 0.7227, 0.7415.
Support levels: 0.71, 0.698.​

audusd.png
 

SOLIDECN

Master Trader
Nov 16, 2021
3,376
23
54
40

ADAUSD Market Insights by Solid ECN Securities


Current trend
Since the beginning of this month, the ADAUSD pair has been growing in line with the general market trend.

At present, the price has risen to the level of 1.1718 but cannot consolidate above it yet. The asset is in consolidation, waiting for more serious movement drivers. The key "bullish" level is 1.27. Its breakout allows growth to the levels of 1.47 and 1.5625 (Murrey [8/8]). The breakdown of 1.0742, supported by the middle line of Bollinger bands, will ensure the resumption of decline to the levels of 0.9675, 0.8789, 0.7812.

Currently, the market is in a state of uncertainty: Bollinger bands narrows, as it happens before a significant price movement, the MACD histogram prepares to move into the positive zone and form a buy signal, but Stochastic reversed downwards.

Support and resistance
Resistance levels: 1.27, 1.47, 1.5625.
Support levels: 1.0742, 0.9675, 0.8789, 0.7812.​

adausd.png
 

SOLIDECN

Master Trader
Nov 16, 2021
3,376
23
54
40
GBPUSD Market insight by Solid ECN Securities
Consolidation ahead of the release of statistics from the USA

Now the price of the GBPUSD pair is trying to gain a foothold above 1.355, but a serious increase will be possible if the asset leaves the descending channel, breaking through the level of 1.361. At the same time, the targets of the upward dynamics will be 1.3732 and 1.3793. If the level of 1.3488 breaks down, the decline may continue to 1.3366 and 1.3300.

The indicators still do not give a single signal: the Bollinger Bands are horizontal, the MACD histogram is near the zero zone, its volumes are insignificant, and the Stochastic is directed downwards.

Resistance levels: 1.3610, 1.3732, 1.3793.
Support levels: 1.3488, 1.3366, 1.33.​

gbpusd.png
 

SOLIDECN

Master Trader
Nov 16, 2021
3,376
23
54
40

AUDUSD market insight by Solid ECN Securities​

Australian currency updates local lows

The Australian dollar is developing a strong "bearish" momentum in tandem with the US currency, testing the level of 0.7120 for a breakdown and updating local lows from February 8.

In addition to technical correction factors at the end of the week, the downtrend was facilitated by strong macroeconomic statistics on inflation in the US, published the day before. The data showed a further acceleration in domestic consumer inflation to 7.5%, which is likely to require the US Federal Reserve to tighten monetary policy sooner during 2022. The start of the interest rate hike cycle is expected in March, when the quantitative easing (QE) program comes to an end.

The focus of investors today will also be on the Fed Monetary Policy Report and data on Michigan Consumer Sentiment Index for February.

Support and resistance
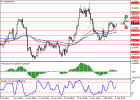
In the D1 chart, Bollinger Bands are reversing horizontally. The price range is almost unchanged, but it remains rather spacious for the current level of activity in the market. MACD is reversing downwards preserving the previous weak buy signal. Stochastic, having rebounded from the level of "80" is declining, signaling in favor of the development of correctional dynamics in the ultra-short term.

Current showings of the indicators do not contradict the further development of the "bearish" trend in the short term.

Resistance levels: 0.716, 0.72, 0.7250, 0.73.
Support levels: 0.71, 0.705, 0.7, 0.695.​

audusd_1.pngaudusd_2.pngaudusd_3.png
 

SOLIDECN

Master Trader
Nov 16, 2021
3,376
23
54
40
GBPUSD market insights by Solid ECN Securities
Correction after the publication of US inflation data

Current trend
During the Asian session, the GBPUSD pair is falling, testing the level of 1.352 for a breakdown.

The development of corrective dynamics at the end of the week is due to the appearance of strong US statistics on inflation, which forces investors to act ahead of the curve. There is practically no doubt that the US Federal Reserve will start a cycle of raising interest rates during the March meeting. Now the whole question is how fast the US regulator will tighten its monetary policy and whether the risks of rising consumer prices were correctly assessed from the very beginning.

Meanwhile, British investors expect on Friday a block of macroeconomic statistics from the UK on GDP dynamics for the fourth quarter. Forecasts suggest some slowdown in the indicator from 6.8% to 6.4%. Also, December data on the dynamics of industrial production and an estimate of GDP growth rates from NIESR for January 2022 will be published during the day.

Support and resistance
On the daily chart, Bollinger Bands move flat. The price range narrows slightly, remaining quite spacious for the observed trading dynamics for the instrument. MACD falls, keeping a poor sell signal (the histogram is below the signal line). Stochastic shows a more confident decline, quickly approaching its lows, indicating that the pound may become oversold in the ultra-short term.

Resistance levels: 1.3550, 1.3600, 1.3650, 1.3700.
Support levels: 1.3500, 1.3460, 1.3435, 1.3400.

gbpusd_1.pnggbpusd_2.png
 

SOLIDECN

Master Trader
Nov 16, 2021
3,376
23
54
40

USDCHF market insights by Solid ECN

The US currency received an impetus to grow

The US dollar shows active growth against the Swiss franc during the Asian session, testing 0.927 for a breakout. The day before, the instrument had already attempted a steady growth and even updated local highs from January 31 near the level of 0.93, but the dollar failed to consolidate on new highs.

Considerable support for the US currency is provided by macroeconomic statistics from the US on consumer inflation published the day before. In January, the Consumer Price Index rose by 0.6% in monthly terms and by 7.5% in annual terms, which turned out to be stronger than market forecasts at 0.5% and 7.3%, respectively. Consumer inflation excluding Food and Energy over the same period increased by 0.6% MoM and by 6% YoY, which also turned out to be higher than the growth by 0.1% projected in both cases.

Today, investors are awaiting the publication of Consumer Price Index in Switzerland for January. Market forecasts suggest that the rate of price growth will remain at the level of 1.5%.

Support and resistance
Bollinger Bands on the daily chart show a steady increase. The price range is narrowing, pointing at the ambiguous nature of trading in the short/medium term. MACD indicator is growing, while preserving a rather stable buy signal (located above the signal line). Stochastic, approaching the level of "80" reversed into a downward plane and so far practically does not react to the appearance of upward dynamics.

Resistance levels: 0.9276, 0.93, 0.9341, 0.9372.
Support levels: 0.926, 0.922, 0.92, 0.9177.​

usdchf_1.pngusdchf_2.png