Technical Analysis from IFC Markets

IFC Markets

Master Trader
Oct 31, 2012
1,938
10
84
London (Great Britain)
www.ifcmarkets.com

EUR/CHF Technical Analysis - EUR/CHF Trading: 2022-08-31​


EUR/CHF Technical Analysis Summary​
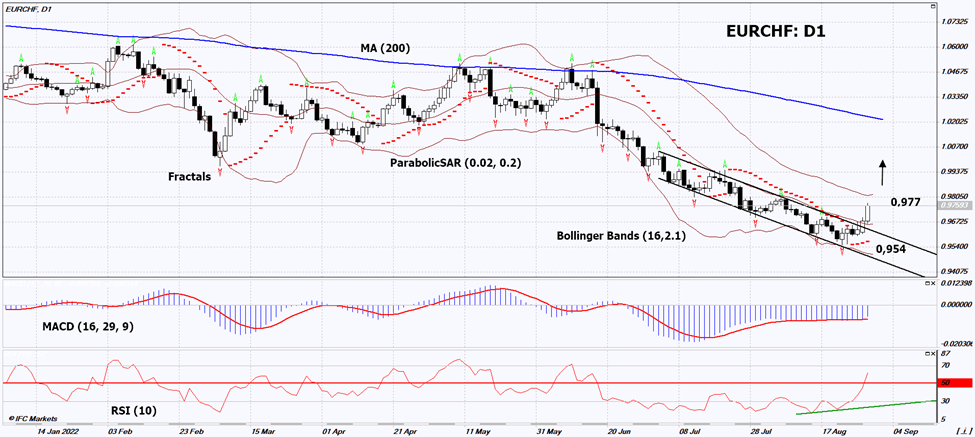
Above 0,977
Buy Stop

Below 0,954
Stop Loss


IndicatorSignal
RSIBuy
MACDBuy
MA(200)Neutral
FractalsBuy
Parabolic SARBuy
Bollinger BandsNeutral


EUR/CHF Chart Analysis​


EUR/CHF Technical Analysis​

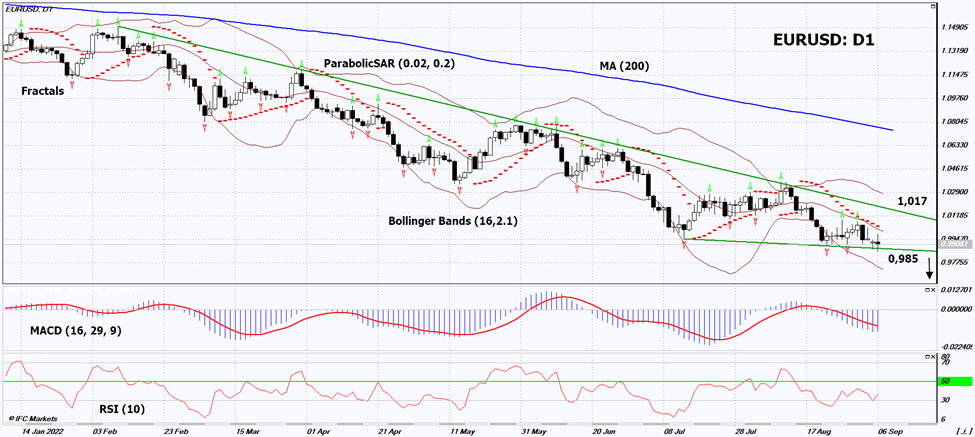
On the daily timeframe, EURCHF: D1 went up from the downward channel. The currency pair is correcting upwards from the actual historical low, if we do not take into account the emotional collapse of the rate on January 15, 2015. A number of technical analysis indicators formed signals for further growth. We do not rule out a bullish movement if EURCHF: D1 rises above its most recent high of 0.977. This level can be used as an entry point. Initial risk cap is possible below the last down fractal and the Parabolic signal: 0.954. After opening a pending order, we move the stop following the Bollinger and Parabolic signals to the next fractal low. Thus, we change the potential profit/loss ratio in our favor. The most cautious traders, after making a trade, can switch to a four-hour chart and set a stop loss, moving it in the direction of movement. If the price overcomes the stop level (0.954) without activating the order (0.977), it is recommended to delete the order: there are internal changes in the market that were not taken into account.

Fundamental Analysis of Forex - EUR/CHF​

Investors do not rule out a rate hike by the European Central Bank (ECB). Will the EURCHF quotes continue to rise?

ECB board member Isabel Schnabel said that central banks should fight high inflation despite the risks of a recession. Recall that in July the growth of the European Union Consumer Price Index reached a 40-year high and amounted to +8.9% y/y. The next meeting of the ECB will take place on 8 September. Investors believe that a rate increase of 0.75% from the current level of 0.5% to 1.25% is possible. In turn, the Swiss National Bank (SNB) meeting will take place on September 22, after the ECB. Inflation in Switzerland was 3.4% y/y in July, while the SNB rate is negative at -0.25%. Switzerland Consumer Price Index for August will be released on September 1st. Its further growth is expected, which may negatively affect the Swiss currency. Other significant economic data will be published this week in Switzerland: Switzerland Retail Sales and procure.ch PMI (September 1), as well as Employment Level (September 2). On Monday, September 5, data on GDP will be released. Note that inflation in the Eurozone for August will be released on August 31, and the trade balance of Germany and the producer price index in the EU on September 2. The combination of all these economic indicators will affect the EURCHF rate.
 

IFC Markets

Master Trader
Oct 31, 2012
1,938
10
84
London (Great Britain)
www.ifcmarkets.com

Toyota Motor Technical Analysis - Toyota Motor Trading: 2022-09-01​

Toyota Motor Technical Analysis Summary​

Below 149.24
Sell Stop

Above 159.43
Stop Loss

IndicatorSignal
RSINeutral
MACDSell
Donchian ChannelSell
MA(200)Sell
FractalsSell
Parabolic SARSell


Toyota Motor Chart Analysis​


Toyota Motor Technical Analysis​

The technical analysis of the Toyota Motor stock price chart on daily timeframe shows #S-TM, Daily is falling after reverting back below the 200-day moving average MA(200) five months ago. We believe the bearish momentum will continue after the price breaches below the lower boundary of the Donchian channel at 149.24. This level can be used as an entry point for placing a pending order to sell. The stop loss can be placed above the upper boundary of the Donchian channel at 159.43. After placing the order, the stop loss is to be moved every day to the next fractal high, following Parabolic indicator signals. Thus, we are changing the expected profit/loss ratio to the breakeven point. If the price meets the stop loss level (159.43) without reaching the order (149.24), we recommend cancelling the order: the market has undergone internal changes which were not taken into account.

Fundamental Analysis of Stocks - Toyota Motor​

Toyota Motor announced it would invest up to $5.27 billion (¥730 billion) in Japan and the United States to make batteries for electric vehicles. Will the Toyota Motor stock price reverse its retreating?

Toyota Motor Corporation on Wednesday said new investment in batteries production will increase output capacity by 40 gigawatt-hours when the additional facilities come on line between 2024 and 2026. About 400 billion yen will be invested in Japan, remaining 325 billion yen would be invested in Toyota Battery Manufacturing in North Carolina. Increased output expectations are bullish for a stock price.
 

IFC Markets

Master Trader
Oct 31, 2012
1,938
10
84
London (Great Britain)
www.ifcmarkets.com

Deutsche Lufthansa AG Technical Analysis - Deutsche Lufthansa AG Trading: 2022-09-02​

Deutsche Lufthansa AG Technical Analysis Summary​

Below 5.68
Sell Stop

Above 6.55
Stop Loss


IndicatorSignal
MACDSell
Donchian ChannelSell
MA(200)Sell
FractalsSell
Parabolic SARSell
MACDSell


Deutsche Lufthansa AG Chart Analysis​

Deutsche Lufthansa AG Technical Analysis​

The technical analysis of the Lufthansa stock price chart on daily timeframe shows #D-LHA, Daily is falling under the 200-day moving average MA(200) after breaching above the moving average. We believe the bearish momentum will continue after the price breaches below the lower boundary of Donchian channel at 5.68. This level can be used as an entry point for placing a pending order to sell. The stop loss can be placed above 6.55. After placing the order, the stop loss is to be moved every day to the next fractal high, following Parabolic indicator signals. Thus, we are changing the expected profit/loss ratio to the breakeven point. If the price meets the stop loss level (6.55) without reaching the order (5.68), we recommend cancelling the order: the market has undergone internal changes which were not taken into account.

Fundamental Analysis of Stocks - Deutsche Lufthansa AG​

Lufthansa stock price closed 3.1% lower after the airline said flights would be canceled due to pilots’ strike. Will the Lufthansa stock price continue retreating?

Deutsche Lufthansa AG said it will have to cancel 800 flights today, likely affecting 130,000 passengers because of a one-day pilots' union strike. The Vereinigung Cockpit (VC) pilot’s union said late on Wednesday that pay talks had failed. Lufthansa had offered a total of 900 euros more in basic pay per month in two stages over an 18-month term as well as an agreement guaranteeing cockpit staff a minimum fleet size. VC is demanding a 5.5% pay rise this year for its more than 5,000 pilots and automatic inflation compensation thereafter. Flight cancellations are bearish for airline stock.
 

IFC Markets

Master Trader
Oct 31, 2012
1,938
10
84
London (Great Britain)
www.ifcmarkets.com

Cotton Technical Analysis - Cotton Trading: 2022-09-05

Cotton Technical Analysis Summary​

Above 102,5
Buy Stop

Below 117
Stop Loss


IndicatorSignal
RSINeutral
MACDSell
MA(200)Neutral
FractalsSell
Parabolic SARSell
Bollinger BandsNeutral


Cotton Chart Analysis​


Cotton Technical Analysis​

On the daily timeframe, COTTON: D1 has broken through the uptrend support line and the double top. A number of technical analysis indicators formed signals for further decline. We do not rule out a bearish movement if COTTON: D1 falls below the latest low: 102.5. This level can be used as an entry point. The initial risk limit is possible above the last upper fractal, 200-day moving average line and Parabolic signal: 117. After opening a pending order, we move the stop following the Bollinger and Parabolic signals to the next fractal high. Thus, we change the potential profit/loss ratio in our favor. The most cautious traders, after making a trade, can switch to a four-hour chart and set a stop loss, moving it in the direction of movement. If the price overcomes the stop level (117) without activating the order (102.5), it is recommended to delete the order: there are internal changes in the market that were not taken into account.

Fundamental Analysis of Commodities - Cotton​

US cotton consumption has declined. Will the COTTON quotes continue to decline?

According to USDA, US cotton consumption in July 2022 amounted to 607 bales or 301 thousand pounds, which is 2 times less compared to July 2021 and 8% less than in June 2022. Note that earlier USDA predicted a reduction in cotton consumption for the entire 2022/2023 season by only 10% compared to the 2021/2022 season. Meanwhile, against the background of declining demand, US cotton stocks in July 2022 also doubled compared to July last year and amounted to 2.04 million pounds. The US is the 3rd largest cotton producer in the world (after China and India) and recently became the 1st largest cotton exporter in the world thanks to the US-China Trade Agreement.
 

IFC Markets

Master Trader
Oct 31, 2012
1,938
10
84
London (Great Britain)
www.ifcmarkets.com

Oil vs Gas Technical Analysis - Oil vs Gas Trading: 2022-09-06​

Oil vs Gas Technical Analysis Summary​


Above 0,433
Buy Stop

Below 0,333
Stop Loss


IndicatorSignal
RSIBuy
MACDBuy
MA(200)Neutral
FractalsNeutral
Parabolic SARBuy
Bollinger BandsNeutral


Oil vs Gas Chart Analysis​


Oil vs Gas Technical Analysis​

On the daily timeframe, SumOIL/GAS: D1 approached the downtrend resistance line. It must be broken up before opening a position. A number of technical analysis indicators formed signals for further growth. We do not rule out a bullish movement if SumOIL/GAS: D1 rises above its latest up fractal: 0.433. This level can be used as an entry point. Initial risk cap is possible below the Parabolic signal, the lower Bollinger band and the last 4 lower fractals: 0.333. After opening a pending order, we move the stop following the Bollinger and Parabolic signals to the next fractal low. Thus, we change the potential profit/loss ratio in our favor. The most cautious traders, after making a trade, can switch to a four-hour chart and set a stop loss, moving it in the direction of movement. If the price overcomes the stop level (0.333) without activating the order (0.433), it is recommended to delete the order: there are internal changes in the market that were not taken into account.

Fundamental Analysis of PCI - Oil vs Gas​

Let's review the Personal Composite Instrument (PCI) &SumOIL/GAS. It reflects the price dynamics of a portfolio of futures for two brands of oil - Brent and WTI against natural gas futures. Will the SumOIL/GAS quotes go up?

OPEC+ has decided to cut oil production in October by 100,000 bpd. At the same time, it will return to the level of August this year and remain at the pre-coronavirus level. The main reason for the decline in production was the emerging slowdown in global economic growth, which could have a negative impact on oil demand. Another factor could be the introduction of a coronavirus lockdown in the Chinese city of Chengdu. Stabilization of oil quotes may support the increase (correction) &SumOIL/GAS, as oil is far behind natural gas in growth. Over the past 12 months, Brent has risen in price by 30.5%, WTI - by 27.6%. During the same time, the price of Natural Gas Futures soared 90.3%. Against this background, &SumOIL/GAS at the end of August fell to the lows of the coronavirus epidemic in April 2020 and the global economic crisis in 2008.
Post automatically merged:

EUR/USD Technical Analysis - EUR/USD Trading: 2022-09-07​


EUR/USD Technical Analysis Summary​

Below 0,985
Sell Stop

Above 1,018
Stop Loss


IndicatorSignal
RSINeutral
MACDSell
MA(200)Neutral
FractalsSell
Parabolic SARSell
Bollinger BandsNeutral


EUR/USD Chart Analysis​


EUR/USD Technical Analysis​


On the daily timeframe, EURUSD: D1 is in a downtrend and has formed a triangle. He must be out of it down before opening a position. A number of technical analysis indicators have formed downward signals. We do not rule out a bearish movement if EURUSD: D1 falls below the latest low: 0.985. This level can be used as an entry point. Initial risk cap is possible above the latest up fractal, downtrend resistance line and triangle, and Parabolic signal: 1.018. After opening a pending order, we move the stop following the Bollinger and Parabolic signals to the next fractal low. Thus, we change the potential profit/loss ratio in our favor. The most cautious traders, after making a trade, can switch to a four-hour chart and set a stop loss, moving it in the direction of movement. If the price overcomes the stop level (1.018) without activating the order (0.985), it is recommended to delete the order: there are internal changes in the market that were not taken into account.

Fundamental Analysis of Forex - EUR/USD​

The meeting of the European Central Bank will take place on Thursday, September 8. Will the EURUSD quotes continue to decline?

It is predicted that the ECB will raise the rate by 0.75% to 1.25% from the current level of 0.5%. Inflation in Europe in August this year amounted to +9.1% y/y. It is worth noting that the Federal Reserve System rate is now higher and is 2.5% with US inflation of +8.1% in July. The United States Consumer Price Index for August will be released on September 13th. The next meeting of the Fed will be held on September 21. According to CME FedWatch, the Fed rate will be raised by 0.75% (to 3.25%) with a 76% probability. In theory, higher US rates and lower inflation could push the EURUSD down further. On Wednesday, September 7, significant data on GDP in the 3rd reading for the 2nd quarter will be published in the EU.
 

IFC Markets

Master Trader
Oct 31, 2012
1,938
10
84
London (Great Britain)
www.ifcmarkets.com

Rio Tinto Ltd Technical Analysis - Rio Tinto Ltd Trading: 2022-09-08​

Rio Tinto Ltd Technical Analysis Summary​


Below 89.06

Sell Stop

Above 92.6

Stop Loss


IndicatorSignal
RSINeutral
MACDBuy
Donchian ChannelNeutral
MA(200)Sell
FractalsSell
Parabolic SARSell


Rio Tinto Ltd Chart Analysis​


Rio Tinto Ltd Technical Analysis​

The technical analysis of the RIO TINTO stock price chart in daily timeframe shows #A-RIO, Daily is retracing down under the 200-day moving average MA(200) after rebounding to two-month high four weeks ago. We believe the bearish momentum will continue after the price breaches below the lower bound of Donchian Channel at 89.06. This level can be used as an entry point for placing a pending order to sell. The stop loss can be placed above the fractal high at 92.60. After placing the order, the stop loss is to be moved every day to the next fractal high, following Parabolic indicator signals. Thus, we are changing the expected profit/loss ratio to the breakeven point. If the price meets the stop loss level (92.60) without reaching the order (89.06), we recommend cancelling the order: the market has undergone internal changes which were not taken into account.

Fundamental Analysis of Stocks - Rio Tinto Ltd​

RIO TINTO stock dipped after a report the miner faces lawsuit in US over Mongolian mine cost overruns. Will the RIO TINTO stock price continue retreating?

Rio Tinto Plc is a publicly traded Anglo-Australian multinational mining company with headquarters in London, the United Kingdom. Company’s market capitalization is at A$133.41 billion. Rio stock is trading at P/E Ratio (Trailing Twelve Months) of 5.96. The company earned $60.19 billion revenue (ttm), a Return on Assets (ttm) of 14.46% and a Return on Equity (ttm) of 32.83%. A US court ruled Rio Tinto Plc must face a lawsuit accusing the mining giant of concealing delays and huge cost overruns at a Mongolian copper and gold mine owned by Turquoise Hill Resources in which Rio Tinto has a majority stake. Pentwater Capital Management LP, Turquoise's largest minority shareholder with about a 10% stake, accuse Rio Tinto and Turquoise of fraudulently assuring that the $5.3 billion Oyu Tolgoi mine was "on plan" and "on budget," even as it was falling up to 2-1/2 years behind schedule and coming in as much as $1.9 billion over budget. Shareholders of Turquoise, who are seeking damages from Rio, said their investments lost close to three-quarters of their value as the truth became known. Rio Tinto said Pentwater's claims were unfounded and said it had consistently complied with its disclosure obligations. Earlier this month, Rio Tinto agreed to pay about $3.3 billion for the 49% of Turquoise it does not already own. RIO TINTO stock retreated 1.1% on the day after the lawsuit news was made public. Possibility of big legal liability is bearish for a company stock price.
 

IFC Markets

Master Trader
Oct 31, 2012
1,938
10
84
London (Great Britain)
www.ifcmarkets.com

Palladium Technical Analysis - Palladium Trading: 2022-09-12​


Palladium Technical Analysis Summary​

Above 2230

Buy Stop

Below 1930

Stop Loss


IndicatorSignal
RSINeutral
MACDNeutral
MA(200)Neutral
FractalsNeutral
Parabolic SARBuy
Bollinger BandsNeutral


Palladium Chart Analysis​


Palladium Technical Analysis​

On the daily timeframe, XPDUSD: D1 is in the rising channel and is moving towards its upper border. It must overcome the 200-day moving average before entering a position. A number of technical analysis indicators formed signals for further growth. We do not rule out a bullish movement if XPDUSD: D1 rises above its latest up fractal, 200-day moving average and upper Bollinger band: 2230. This level can be used as an entry point. The initial risk limit is possible below the Parabolic signal and the last lower fractal: 1930. After opening a pending order, we move the stop following the Bollinger and Parabolic signals to the next fractal low. Thus, we change the potential profit/loss ratio in our favor. The most cautious traders, after making a trade, can switch to a four-hour chart and set a stop loss, moving it in the direction of movement. If the price overcomes the stop level (1930) without activating the order (2230), it is recommended to delete the order: the market is undergoing internal changes that were not taken into account.

Fundamental Analysis of Precious Metals - Palladium​

Precious metals rise in price amid the correction of the US dollar index. Will the XPDUSD quotes continue to rise?

Last week, the US dollar index hit a 20-year high. However, it failed to consolidate above the psychological mark of 110 points and corrected down. Investors are looking forward to the publication of the United States Consumer Price Index for August, which will be released on September 13th. It is forecast to increase to 9% y/y from 8.5% y/y in July. This may slow down the strengthening of the US currency and support the demand for precious metals. Russia ranks first in the world in palladium production. Its share is about 40%. Accordingly, economic sanctions against Russia may contribute to the rise in the price of palladium. Worth noting, this metal is actively used in various industries as a catalyst.
 

IFC Markets

Master Trader
Oct 31, 2012
1,938
10
84
London (Great Britain)
www.ifcmarkets.com

Oats Technical Analysis - Oats Trading: 2022-09-13​


Oats Technical Analysis Summary​


Above 405
Buy Stop

Below 360
Stop Loss


IndicatorSignal
RSIBuy
MACDNeutral
MA(200)Neutral
FractalsBuy
Parabolic SARBuy
Bollinger BandsNeutral


Oats Chart Analysis​


Oats Technical Analysis​

On the daily timeframe, OATS: D1 came out of the downtrend up. A number of technical analysis indicators formed signals for further growth. We do not rule out a bullish movement if OATS: D1 rises above its most recent high of 405. This level can be used as an entry point. The initial risk limit is possible below the Parabolic signal, the lower Bollinger band, the 15-month low and the last lower fractal: 360. After opening a pending order, we move the stop following the Bollinger and Parabolic signals to the next fractal low. Thus, we change the potential profit/loss ratio in our favor. The most cautious traders, after making a trade, can switch to a four-hour chart and set a stop loss, moving it in the direction of movement. If the price overcomes the stop level (360) without activating the order (405), it is recommended to delete the order: there are internal changes in the market that were not taken into account.


Fundamental Analysis of Commodities - Oats​

USDA has updated its forecast for the global oat crop. Will the OATS quotes continue to rise?

USDA expects a significant increase in the global yield of this crop from 2.35 tons per hectare to 2.57 tons per hectare. According to preliminary estimates, in the 2021/2022 season, 22.54 million tons of oats will be harvested in the world on an area of 9.61 million hectares, and in the 2022/2023 season - already 24.21 million tons, with the expected decrease in crops to 9.42 million hectares. Theoretically, drought and worsening weather conditions could have a negative impact on this yield estimate. Note that in August USDA was more optimistic and estimated the global harvest in the 2022/2023 season at 24.3 million tons. In addition, anti-Russian sanctions may have a positive impact on quotes. Russia ranks second in the world in oat production after Canada. Its share in the world harvest is almost 16%, while Canada's share is 19%.
 

IFC Markets

Master Trader
Oct 31, 2012
1,938
10
84
London (Great Britain)
www.ifcmarkets.com

AUD JPY Technical Analysis - AUD JPY Trading: 2022-12-19​


AUD/JPY Technical Analysis Summary​


Below 90,6

Sell Stop

Above 96

Stop Loss


IndicatorSignal
RSINeutral
MACDSell
MA(200)Neutral
FractalsNeutral
Parabolic SARSell
Bollinger BandsNeutral


AUD/JPY Chart Analysis​


AUD/JPY Chart Analysis

AUD/JPY Technical Analysis​

On the daily timeframe, AUDJPY: D1 broke down the 200-day moving average line and built a Triangle. Before opening a position, he must go down from the "Triangle". A number of technical analysis indicators formed signals for further decline. We do not rule out a bearish movement if AUDJPY: D1 falls below its most recent down fractal: 90.6. This level can be used as an entry point. The initial risk limit is possible above the last upper fractal, the upper Bollinger band and the Parabolic signal: 96. After opening a pending order, we move the stop following the Bollinger and Parabolic signals to the next fractal high. Thus, we change the potential profit/loss ratio in our favor. The most cautious traders, after making a trade, can switch to a four-hour chart and set a stop loss, moving it in the direction of movement. If the price overcomes the stop level (96) without activating the order (90.6), it is recommended to delete the order: there are internal changes in the market that were not taken into account.

Fundamental Analysis of Forex - AUD/JPY​

The Australian dollar showed weakening. Will AUDJPY quotes go down?

Such dynamics is observed with the weakening of the Australian dollar against the Japanese yen. China is an important trading partner for Australia, so the Australian dollar often reacts to Chinese statistics. In this review, we consider the AUDJPY currency pair, but it can be noted that on December 15, AUDUSD showed the maximum daily decline since March 2020. This was facilitated by weak Chinese and Australian economic data. China Retail Sales and Industrial Production turned out to be worse than expected in November. In addition, in November, Chinese unemployment increased to a 5-month high of 5.7%. In Australia itself, the S&P Global Manufacturing PMI was also weaker than forecasts. In turn, Japanese economic indicators last week were relatively good. The meeting of the Bank of Japan (BoJ) will take place on December 20. If he somehow tightens his monetary policy, it could strengthen the yen. Recall that now the BoJ is the only global central bank with a negative rate of -0.1%.
 

IFC Markets

Master Trader
Oct 31, 2012
1,938
10
84
London (Great Britain)
www.ifcmarkets.com

EUR USD Technical Analysis - EUR USD Trading: 2023-01-06​


EUR/USD Technical Analysis Summary​


Below 1.048

Sell Stop

Above 1.076

Stop Loss


IndicatorSignal
RSISell
MACDSell
MA(200)Neutral
FractalsSell
Parabolic SARSell
Bollinger BandsNeutral


EUR/USD Chart Analysis​

e85eeb7f3c6bf1160a9bc3f5c9debc8eab010f17.png


EUR/USD Technical Analysis​

On the daily timeframe, EURUSD: D1 is in a long-term downtrend but has been correcting up lately. Before opening a position, the 200-day moving average line must be broken down. A number of technical analysis indicators have formed downward signals. We do not rule out a bearish movement if EURUSD: D1 falls below the 200-day moving average and lower Bollinger band: 1.048. This level can be used as an entry point. Initial risk cap is possible above the last 3 upper fractals, the upper Bollinger band, and the Parabolic signal: 1.076. After opening a pending order, we move the stop following the Bollinger and Parabolic signals to the next fractal low. Thus, we change the potential profit/loss ratio in our favor. The most cautious traders, after making a trade, can switch to a four-hour chart and set a stop loss, moving it in the direction of movement. If the price overcomes the stop level (1.076) without activating the order (1.048), it is recommended to delete the order: there are internal changes in the market that were not taken into account.

Fundamental Analysis of Forex - EUR/USD​

In the US, good data on the labor market came out from the independent agency ADP. Will EURUSD quotes fall?

United States ADP Nonfarm Employment Change (Nonfarm Employment Change) in December 2022 increased to 235 thousand compared to 127 thousand in November. This is much better than the forecast. Now investors expect the same positive publication of official data on the labor market (United States Nonfarm Payrolls) on January 6. On the same day, the European Union Consumer Price Index will be released. Inflation in the EU is forecast to remain high at 10.5% y/y. This could be a negative factor for the euro.