Technical Analysis from IFC Markets

IFC Markets

Master Trader
Oct 31, 2012
1,938
10
84
London (Great Britain)
www.ifcmarkets.com

COFFEE Technical Analysis - COFFEE Trading: 2022-05-31​


COFFEE Technical Analysis Summary​


Buy Stop։ Above 230​

Stop Loss: Below 208​


Indicator Signal
RSI Buy
MACD Buy
MA(200) Buy
Fractals Buy
Parabolic SAR Buy
Bollinger Bands Neutral


COFFEE Chart Analysis​


b4761a066cf68a847c028ace21b88eb7649f2624.png


COFFEE Technical Analysis​

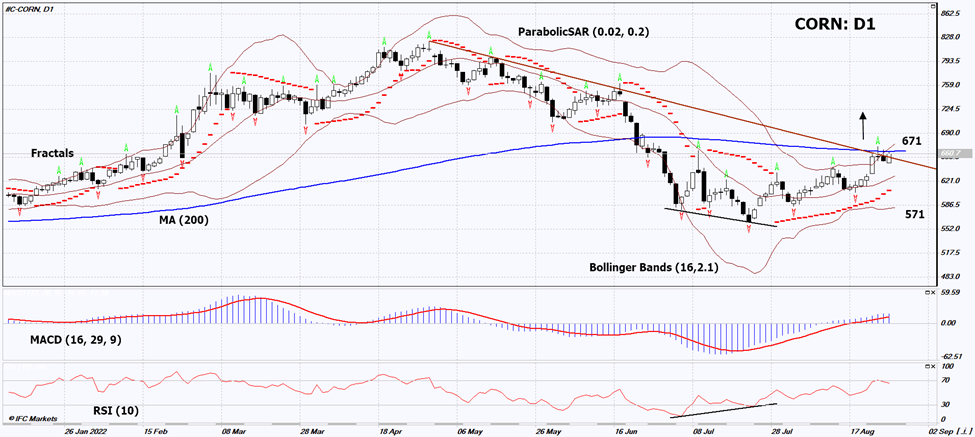
On the daily timeframe, COFFEE: D1 has exceeded the downtrend resistance line and is trying to exit the triangle for the 2nd time. A number of technical analysis indicators formed signals for further growth. We do not rule out a bullish movement if COFFEE: D1 rises above its latest high and upper Bollinger band: 230. This level can be used as an entry point. The initial risk limit is possible below the 200-day moving average line, the Parabolic signal and the last two lower fractals: 208. After opening a pending order, we move the stop following the Bollinger and Parabolic signals to the next fractal low. Thus, we change the potential profit/loss ratio in our favor. The most cautious traders after making a trade can switch to a four-hour chart and set a stop loss, moving it in the direction of movement. If the price overcomes the stop level (208) without activating the order (230), it is recommended to delete the order: there are internal changes in the market that were not taken into account.

Fundamental Analysis of Commodities - COFFEE​

Brazil is experiencing drought and is at risk of frost. Will the COFFEE quotes continue to rise?

Somar Meteorologia reported that in the Brazilian state of Minas Gerais, last week the rainfall was 52% less than the historical average. This state produces 30% of Brazilian Arabica coffee. CONAB has cut its coffee production forecast for Brazil in the 2022/2023 season by 2.3 million bags (60kg) from its previous estimate in January to 53.43 million bags. At the same time, it may still be 12% more compared to the previous season, but 15.3% less than the 2020/2021 season. It should be noted that various Western agricultural agencies are expecting a much larger coffee crop in Brazil this season - approximately 63-64 million bags. If they start to revise their forecasts downward before the official CONAB estimate, then this could positively affect the quotes. In the meantime, the Cecafé agency reported a decrease in coffee exports from Brazil in January-April 2022 by 10.6% compared to the same period in 2021. In April, Brazilian coffee exports fell 24.3% to 2.56 million bags. The Colombian Coffee Growers Federation reported an 18% y/y cut in coffee exports from Colombia in April to 875,000 bags.
 

IFC Markets

Master Trader
Oct 31, 2012
1,938
10
84
London (Great Britain)
www.ifcmarkets.com

Platinum Technical Analysis - Platinum Trading: 2022-06-06​


Platinum Technical Analysis Summary​

Buy Stop։ Above 1033​

Stop Loss: Below 913

Indicator Signal
RSI Neutral
MACD Neutral
MA(200) Neutral
Fractals Buy
Parabolic SAR Buy
Bollinger Bands Buy


Platinum Chart Analysis​


7a10e31a2cbb81db159f3995274d8da32d084eb2.png


Platinum Technical Analysis​

On the daily timeframe, XPTUSD: D1 went up from the triangle. Some indicators of technical analysis have formed signals for a further increase. We do not rule out a bullish movement if XPTUSD rises above the last high and the 200-day moving average line: 1033. This level can be used as an entry point. The initial risk limit is possible below the Parabolic signal, the last three lower fractals and the lower Bollinger line: 913. After opening a pending order, we move the stop following the Bollinger and Parabolic signals to the next fractal low. Thus, we change the potential profit/loss ratio in our favor. The most cautious traders after making a trade can switch to a four-hour chart and set a stop loss, moving it in the direction of movement. If the price overcomes the stop level (913) without activating the order (1033), it is recommended to delete the order: there are internal changes in the market that were not taken into account.

Fundamental Analysis of Precious Metals - Platinum​

The World Platinum Investment Council (WPIC) has lowered its global surplus forecast for 2022. Will the XPTUSD quotes continue to rise?

WPIC has updated its forecast for the global platinum market for the 1st quarter of 2022. He now expects a 5% decline in global supply (-332 thousand ounces) and a 2% increase in demand (+126 thousand ounces) for the full 2022 compared to 2021. Because of this, the global surplus of platinum at the end of the current year may be reduced by almost 2 times compared to 2021, to +627 thousand ounces. The main reason for the decrease in global supply may be accidents at fields in South Africa and Zimbabwe, as well as anti-Russian sanctions. Russia produces 10% of the world's platinum, while African countries produce 80%. The rest of the production is concentrated mainly in Canada and the USA. The increase in demand, according to WPIC, may occur due to the replacement of expensive palladium in automotive catalysts with cheaper platinum. There may also be an increase in the production of diesel trucks and an increase in freight traffic after the coronavirus epidemic. In addition, demand in the petrochemical and medical industries may increase. Theoretically, it is possible to increase the purchase of physical platinum in coins and bars, for investment purposes, since it is much cheaper than gold.
 

IFC Markets

Master Trader
Oct 31, 2012
1,938
10
84
London (Great Britain)
www.ifcmarkets.com

USD/CZK Technical Analysis - USD/CZK Trading: 2022-06-13​


USD/CZK Technical Analysis Summary​

Buy Stop։ Above 23,5​

Stop Loss: Below 22,5​


Indicator Signal
RSI Neutral
MACD Sell
MA(200) Neutral
Fractals Buy
Parabolic SAR Buy
Bollinger Bands Neutral


USD/CZK Chart Analysis​


d6a448f19c8b12b9b7c5e270b6915c9044d6698d.png


USD/CZK Technical Analysis​

On the daily timeframe, USDCZK: D1 is in a rising channel. Price pushed off from its lower border and moves towards the upper border. A number of technical analysis indicators formed signals for further growth. We do not rule out a bullish movement if USDCZK: D1 rises above the last high of 23.5. This level can be used as an entry point. Initial risk cap possible below Parabolic signal, 3 latest down fractals and 200-day moving average line: 22.5. After opening a pending order, we move the stop following the Bollinger and Parabolic signals to the next fractal low. Thus, we change the potential profit/loss ratio in our favor. The most cautious traders after making a trade can switch to a four-hour chart and set a stop loss, moving it in the direction of movement. If the price overcomes the stop level (22.5) without activating the order (23.5), it is recommended to delete the order: there are internal changes in the market that were not taken into account.

Fundamental Analysis of Forex - USD/CZK​

Czech companies are going to pay taxes in euros. Will the USDCZK quotes continue to rise?

Czech finance minister Zbynek Stanjura said the Czech government plans to allow local companies to pay taxes in euros from 2024. The corresponding decision can be approved by the parliament at the end of this year or at the very beginning of the next. In his opinion, this will increase the volume of loans received from the European Union. Recall that now the EU includes 27 countries. Of these, 8 countries, including the Czech Republic, have their own currencies. An additional negative for the Czech crown may be weak economic data published last week. In April, the trade deficit of the Czech Republic turned out to be almost 2 times worse than the forecast and showed a record deficit of CZK 28.4 billion. Industrial Production was also 2 times worse than expected and decreased by -3.8% y/y. Czech inflation in May increased for the 11th consecutive month and soared to 16% y/y. This is the highest since December 1993. In this review, we consider the USDCZK pair, as it has more technical signals than EURCZK.
 

nonghang

Newbie
Jun 14, 2022
1
0
0
23
1. Indica/Sativa Ratio
Indicas are known for their high THC content, while Sativas have higher CBD levels. In general, Indicas tend to be more sedative than Sativas. However, this ratio can vary greatly depending on genetics, environment, and other factors.
2. Yield Potential
Yield potential refers to how much weight a plant produces per square foot of space. This number is determined by many different variables, including genetics, light intensity, temperature, humidity, nutrition, and water supply.
3. Flowering Time
Flowering time refers to how long it takes from seed germination until the first flower appears. Some strains take longer to mature than others.
 

IFC Markets

Master Trader
Oct 31, 2012
1,938
10
84
London (Great Britain)
www.ifcmarkets.com

USD/MXN Technical Analysis - USD/MXN Trading: 2022-06-14​


USD/MXN Technical Analysis Summary​

Buy Stop։ Above 20,5​

Stop Loss: Below 19,4​


Indicator Signal
RSI Neutral
MACD Buy
MA(200) Buy
Fractals Neutral
Parabolic SAR Buy
Bollinger Bands Buy

USD/MXN Chart Analysis​


c6871e67793b7ade56ce5a884a5551ba3aaf120e.png


USD/MXN Technical Analysis​

On the daily timeframe, USDMXN: D1 has exceeded the triangle resistance line and is moving towards the upper border of the descending channel. A number of technical analysis indicators formed signals for further growth. We do not rule out a bullish movement if USDMXN rises above its latest high, 200-day moving average and upper Bollinger band: 20.5. This level can be used as an entry point. The initial risk limit is possible below the Parabolic signal and the last 2 lower fractals: 19.4. After opening a pending order, we move the stop following the Bollinger and Parabolic signals to the next fractal low. Thus, we change the potential profit/loss ratio in our favor. The most cautious traders after making a trade can switch to a four-hour chart and set a stop loss, moving it in the direction of movement. If the price overcomes the stop level (19.4) without activating the order (20.5), it is recommended to delete the order: there are internal changes in the market that were not taken into account.

Fundamental Analysis of Forex - USD/MXN​

Economic statistics increase the likelihood of a rate hike in the United States and reduce it in Mexico. Will the growth of USDMXN quotes continue?

Inflation in Mexico fell to 7.65% y/y in May from 7.68% in April. This is noticeably better than the forecast +8.2% y/y. Previously, the Bank of Mexico rate was raised 8 times in a row and now stands at 7%. The slowdown in consumer price growth reduces the likelihood of further rate hikes at the June 23 meeting. This week in Mexico is not expected to publish significant economic data. U.S. meeting The Federal Reserve will take place on June 15th. Market participants expect to increase the rate to 1.5% from 1%. Moreover, some investors do not exclude its growth up to 1.75%. The main reason for this could be high inflation in the US. In May, it reached a 40-year high of 8.6% per annum. Against this background, the yield of the US 10-Year Bond reached a maximum since April 2011 and amounted to 3.35% per annum. This contributes to a noticeable strengthening of the US dollar.
 

IFC Markets

Master Trader
Oct 31, 2012
1,938
10
84
London (Great Britain)
www.ifcmarkets.com

Mondelez Technical Analysis - Mondelez Trading: 2022-06-22​


Mondelez Technical Analysis Summary​


Sell Stop: Below 57.79​

Stop Loss: Above 63.29​


Indicator Signal
RSI Neutral
MACD Buy
Donchian Channel Neutral
MA(200) Sell
Fractals Sell
Parabolic SAR Sell


Mondelez Chart Analysis​


e73eff43fabae14327db8184c4ee7c4195fd2e89.png


Mondelez Technical Analysis​

The technical analysis of the Mondelez International stock price chart on daily timeframe shows #S-MDLZ,Daily is falling under the 200-day moving average MA(200) which is declining. We believe the bearish momentum will continue after the price breaches below the lower boundary of Donchian channel at 57.79. This level can be used as an entry point for placing a pending order to sell. The stop loss can be placed above the fractal high at 63.29. After placing the order, the stop loss is to be moved every day to the next fractal high, following Parabolic indicator signals. Thus, we are changing the expected profit/loss ratio to the breakeven point. If the price meets the stop loss level (63.29) without reaching the order (57.79), we recommend cancelling the order: the market has undergone internal changes which were not taken into account.

Fundamental Analysis of Stocks - Mondelez​

Mondelez International stock gained after the news company is acquiring energy bar maker Clif Bar & Company. Will the Mondelez International stock price retreating reverse?

Mondelez International, Inc. is an American multinational company which manufactures and sells snack food and beverage products globally. Company’s market capitalization is $81.4 billion. Mondelez International’s stock trades at price-to-earnings (P/E) ratio of 19.78 for trailing twelve months (ttm). Over the past 12 months, it has generated revenue of $29.25 billion, Return on Assets (ttm) of 4.65% and Return on Equity (ttm) 15.20%. Mondelez International Inc said on Monday it will buy energy bar maker Clif Bar & Company for $2.9 billion to expand its global snack bar business. Clif Bar's acquisition marks the ninth deal since 2018. Mondelez said the company will also pay additional amounts to the sellers depending upon its earnings from Clif Bar. Stock price closed up 1.73% over day after the news
 

IFC Markets

Master Trader
Oct 31, 2012
1,938
10
84
London (Great Britain)
www.ifcmarkets.com

Rolls-Royce Holdings PLC Technical Analysis - Rolls-Royce Holdings PLC Trading: 2022-06-27​

Rolls-Royce Holdings PLC Technical Analysis Summary​


Sell Stop: Below 78.94​

Stop Loss: Above 92.70​


Indicator Signal
RSI Neutral
MACD Sell
Donchian Channel Sell
MA(200) Sell
Fractals Neutral
Parabolic SAR Sell


Rolls-Royce Holdings PLC Chart Analysis​


a5e956bb9ac51e2c39d3800ebd948d7fae6b961d.png


Rolls-Royce Holdings PLC Technical Analysis​

The technical analysis of the Rolls Royce stock price chart on daily timeframe shows #L-RR,Daily is retreating after hitting twenty-month high eight months ago and has fallen below the 200-day moving average MA(200) which is falling too. We believe the bearish momentum will continue after the price breaches below the lower boundary of Donchian channel at 78.94. This level can be used as an entry point for placing a pending order to sell. The stop loss can be placed above the fractal high at 92.70. After placing the order, the stop loss is to be moved every day to the next fractal high, following Parabolic indicator signals. Thus, we are changing the expected profit/loss ratio to the breakeven point. If the price meets the stop loss level (92.70) without reaching the order (78.94), we recommend cancelling the order: the market has undergone internal changes which were not taken into account.

Fundamental Analysis of Stocks - Rolls-Royce Holdings PLC​

Rolls Royce stock ended down after the workers’ union rejected company’s offer on inflation compensation. Will the Rolls Royce stock price rebound?

Rolls Royce Corporation is a British industrial corporation. The company manufactures and sells engines for aircrafts and ships as well as power generators globally. Company’s market capitalization is $8.87 billion. Rolls Royce’s stock trades at price-to-earnings (P/E) ratio of 58.8 for trailing twelve months (ttm). Over the past 12 months, it has generated revenue of $11.22 billion and Return on Assets (ttm) of 1.00%. Last Wednesday a union representing Rolls Royce Holdings workers in the UK rejected the company's offer of a £2,000 single payment to compensate for inflation. The union known as Unite argued that the offer "falls far short of the real cost of living challenges which our members are experiencing." Rolls-Royce CEO Warren East, who made the offer, said that a "simple wage increase" was "just not affordable”” as it would damage the company's "future competitiveness in the UK, by adding too much cost into the long-term wage bill at times of such high uncertainty." Stock price closed 4.6% down on the day after the news.


IFC Markets

Master Trader
Oct 31, 2012
1,938
10
84
London (Great Britain)
www.ifcmarkets.com

Deutsche Lufthansa AG Technical Analysis - Deutsche Lufthansa AG Trading: 2022-06-28​


Deutsche Lufthansa AG Technical Analysis Summary​


Sell Stop: Below 5.68​

Stop Loss: Above 6.58​


Indicator Signal
RSI Neutral
MACD Sell
Donchian Channel Neutral
MA(200) Sell
Fractals Sell
Parabolic SAR Buy


Deutsche Lufthansa AG Chart Analysis​


6a1db5eb6b01cc7debb1d1b7b9d0701028b7c905.png


Deutsche Lufthansa AG Technical Analysis​

The technical analysis of the Lufthansa stock price chart on daily timeframe shows #D-LHA, Daily is falling under the 200-day moving average MA(200) after multiple tests of the moving average. We believe the bearish momentum will continue after the price breaches below the lower boundary of Donchian channel at 5.68. This level can be used as an entry point for placing a pending order to sell. The stop loss can be placed above 6.58. After placing the order, the stop loss is to be moved every day to the next fractal high, following Parabolic indicator signals. Thus, we are changing the expected profit/loss ratio to the breakeven point. If the price meets the stop loss level (6.58) without reaching the order (5.68), we recommend cancelling the order: the market has undergone internal changes which were not taken into account.

Fundamental Analysis of Stocks - Deutsche Lufthansa AG​

Lufthansa stock price closed virtually flat after the airline said didn’t expect improvement until 2023. Will the Lufthansa stock price continue retreating?

Deutsche Lufthansa AG is a major German airline. Its market capitalization is €7.19 billion. The stock is trading at P/E ratio (Trailing Twelve Months) of -1.02 currently and the revenue for the trailing twelve months was €19.65 billion, while the Return on Equity (ttm) was -46.03% and Return on Assets (ttm) was -1.96%. The airline said does not expect its global airline operations to return to normal until 2023. Lufthansa announced plans to scrap around 3,000 flights, or some 15% of its capacity, at its hubs in Frankfurt and Munich this summer. Lower capacity utilization means lower revenue expectations which is bearish for stock price.
 

IFC Markets

Master Trader
Oct 31, 2012
1,938
10
84
London (Great Britain)
www.ifcmarkets.com

Rough Rice Technical Analysis - Rough Rice Trading: 2022-07-06​


Rough Rice Technical Analysis Summary​

Sell Stop։ Below 16,1​

Stop Loss: Above 17,4​


Indicator Signal
RSI Neutral
MACD Neutral
MA(200) Neutral
Fractals Sell
Parabolic SAR Parabolic SAR Sell
Bollinger Bands Neutral


Rough Rice Chart Analysis​


d80b98db1582cf5adb37b3e15369f201290854fe.png


Rough Rice Technical Analysis​

On the daily timeframe, RICE: D1 has broken down the support line of the neutral range and the uptrend. A number of technical analysis indicators formed signals for further decline. We do not rule out a bearish movement if RICE: D1 falls below its most recent low of 16.1. This level can be used as an entry point. The initial risk limit is possible above the last 2 upper fractals, the upper Bollinger band and the Parabolic signal: 17.4. After opening a pending order, we move the stop following the Bollinger and Parabolic signals to the next fractal high. Thus, we change the potential profit/loss ratio in our favor. The most cautious traders after making a trade can switch to a four-hour chart and set a stop loss, moving it in the direction of movement. If the price overcomes the stop level (17.4) without activating the order (16.1), it is recommended to delete the order: there are internal changes in the market that were not taken into account.

Fundamental Analysis of Commodities - Rough Rice​

The United States Department of Agriculture (USDA) has increased its forecast for the global rice harvest. Will the RICE quotes continue to correct?

USDA forecasts an increase in global rice production in the 2021/2022 agricultural season to 513.7 million tons, compared with 509.3 million tons a season earlier. The harvest forecast for the 2022/2023 season has been increased to 515.4 million tons. Remember that the main producers of rice are China and India. Their share in the world harvest is 29% and 25%, respectively. Followed by Bangladesh (7%), Indonesia (7%), Vietnam (5%) and Thailand (4%). The weather in these countries may affect rice quotes. Note that global rice exports are much less than production. Last season it amounted to 52.6 million tons. India's plans to increase exports by 1 million tons of rice to a record level of 22 million tons may become a negative factor for quotations.
 

IFC Markets

Master Trader
Oct 31, 2012
1,938
10
84
London (Great Britain)
www.ifcmarkets.com

Walmart Technical Analysis - Walmart Trading: 2022-07-07​


Walmart Technical Analysis Summary​


Buy Stop։ Above 126.15​

Stop Loss: Below 119.87​


Indicator Signal
RSI Neutral
MACD Buy
Donchian Channel Buy
MA(200) Sell
Fractals Buy
Parabolic SAR Buy


Walmart Chart Analysis​

Walmart Technical Analysis​

The technical analysis of the Walmart stock price chart on daily timeframe shows #S-WMT,Daily is rebounding toward the 200-day moving average MA(200) after hitting two-year low eight weeks ago. We believe the bullish momentum will resume after the price breaches above the upper Donchian bound at 126.15. This level can be used as an entry point for placing a pending order to buy. The stop loss can be placed below the lower Donchian bound at 119.87. After placing the order, the stop loss is to be moved every day to the next fractal low, following Parabolic indicator signals. Thus, we are changing the expected profit/loss ratio to the breakeven point. If the price meets the stop loss level (119.87) without reaching the order (126.15), we recommend cancelling the order: the market has undergone internal changes which were not taken into account.

Fundamental Analysis of Stocks - Walmart​

Walmart announced it will start charging suppliers pickup and fuel fees. Will the Walmart stock price continue recovering?

Walmart Inc is a United States based retail and wholesale giant which operates globally. Its market capitalization is $343 billion. The stock is trading at P/E ratio (Trailing Twelve Months) of 26.97 currently, company’s revenue (ttm) was $576.0 billion, while the Return on Equity (ttm) was 15.53% and the Return on Assets (ttm) at 6.31%. Walmart has announced it will charge some of its suppliers from next month new fees to transport goods to its warehouses and stores. A "collect pickup charge" calculated as a percentage of the cost of goods received and a fuel surcharge based on the cost of fuel to transport the goods will be charged to Walmart's "Valued Collect Suppliers." This May Walmart, the nation's largest retailer, cut its full-year profit outlook citing rising costs of labor and fuel with fuel costs, in particular, running over $160 million higher than it had anticipated.
 

IFC Markets

Master Trader
Oct 31, 2012
1,938
10
84
London (Great Britain)
www.ifcmarkets.com

Sugar Technical Analysis - Sugar Trading: 2022-07-11​


Sugar Technical Analysis Summary​


Buy Stop։ Above 19.15​

Stop Loss: Below 17.35​


Indicator Signal
RSI Buy
MACD Neutral
MA(200) Buy
Fractals Neutral
Parabolic SAR Buy
Bollinger Bands Neutral


Sugar Chart Analysis​


f6cf6113a7642d4eb5a2fa6a965892373e8fa831.png


Sugar Technical Analysis​

On the daily timeframe, SUGAR: D1 is moving towards the upper border of a wide neutral range. A number of technical analysis indicators formed signals for further growth. We do not rule out a bullish movement if SUGAR: D1 rises above its most recent high of 19.15. This level can be used as an entry point. Initial risk cap is possible below the 200-day moving average and the latest down fractal and lower Bollinger band: 17.35. After opening a pending order, we move the stop following the Bollinger and Parabolic signals to the next fractal low. Thus, we change the potential profit/loss ratio in our favor. The most cautious traders after making a trade can switch to a four-hour chart and set a stop loss, moving it in the direction of movement. If the price overcomes the stop level (17.35) without activating the order (19.15), it is recommended to delete the order: there are internal changes in the market that were not taken into account.

Fundamental Analysis of Commodities - Sugar​

India is in no hurry to restore sugar exports. Will the SUGAR quotes continue to rise?

In May this year, the Indian authorities, for the first time in 6 years, limited the export of sugar in order to secure the domestic market. At the same time, sugar producers were given an export quota of 0.8 million tons. It was valid until July 5, but on Friday it was extended until July 20 due to the slow pace of shipments of Indian sugar to foreign buyers. Theoretically, this could be a sign of a slowdown in exports. Earlier in the 2021/2022 agricultural season, USDA predicted a record 8.8 million tons of sugar exports from India. At the same time, in the 2022/2023 season, it should already be reduced to 5.2 million tons. India and Brazil are the world's largest sugar producers with 35-36 million tons per year each, and the global sugar production is about 182 million tons. Brazil is also the world's largest exporter (26.6 million tons). India is in 3rd place in world sugar exports, and Thailand is in 2nd place (11 million tons). Another negative factor for sugar may be relatively expensive oil. This could increase the processing of sugar cane into motor fuel (ethanol) in Brazil and the US.
 

IFC Markets

Master Trader
Oct 31, 2012
1,938
10
84
London (Great Britain)
www.ifcmarkets.com

Hang Seng Index Technical Analysis - Hang Seng Index Trading: 2022-07-18​


Hang Seng Index Technical Analysis Summary​

Sell Stop։ Below 20000​

Stop Loss: Above 22200​


Indicator Signal
RSI Neutral
MACD Sell
MA(200) Neutral
Fractals Sell
Parabolic SAR Sell
Bollinger Bands Sell

Hang Seng Index Chart Analysis​


770bfe3588bbc73c150ac1916e9b44f4180f0266.png


Hang Seng Index Technical Analysis​

On the daily timeframe, HK50: D1 went down from the triangle. A number of technical analysis indicators formed signals for further decline. We do not rule out a bearish movement if HK50: D1 falls below the last low and lower Bollinger band: 20000. This level can be used as an entry point. The initial risk limit may be higher than the last 2 upper fractals and the Parabolic signal: 22200. After opening a pending order, we move the stop following the Bollinger and Parabolic signals to the next fractal maximum. Thus, we change the potential profit/loss ratio in our favor. The most cautious traders after making a trade can switch to a four-hour chart and set a stop loss, moving it in the direction of movement. If the price overcomes the stop level (22200) without activating the order (20000), it is recommended to delete the order: there are internal changes in the market that were not taken into account.

Fundamental Analysis of Indices - Hang Seng Index​

China's GDP turned out to be worse than expected. Will the correction of HK50 quotes continue?

Chinese GDP in the 2nd quarter of this year decreased by -2.6% q/q. Investors expected it to grow by 1.6%. Recall that since the 90s of the last century, a quarterly drop in China's GDP was observed only in the 1st quarter of 2020 (-6.8% q/q) at the height of the coronavirus lockdown. In annual terms, GDP increased by +0.4% y/y. This is also worse than the forecast +5.3% y/y. China Gross Domestic Product Year to Date (according to the results of the 1st half of 2022) amounted to +2.5%. In the same period in 2021, it was +12.7%. Theoretically, this allows us to predict that by the end of 2022, the Chinese economy will still continue to grow. The last time its annual decline was observed in 1976 (-1.6%). However, economic risks could have a negative impact on Chinese stocks.
 

IFC Markets

Master Trader
Oct 31, 2012
1,938
10
84
London (Great Britain)
www.ifcmarkets.com

GBP/USD Technical Analysis - GBP/USD Trading: 2022-07-20​


GBP/USD Technical Analysis Summary​

Buy Stop։ Above 1,206​

Stop Loss: Below 1,176​


Indicator Signal
RSI Buy
MACD Neutral
MA(200) Neutral
Fractals Neutral
Parabolic SAR Buy
Bollinger Bands Neutral


GBP/USD Chart Analysis​


47f7d677c47ca777d4ee956072dd63c0d2a1e4c3.png


GBP/USD Technical Analysis​

On the daily timeframe, GBPUSD: D1 went up from the triangle. A number of technical analysis indicators formed signals for further growth. We do not rule out a bullish movement if GBPUSD: D1 rises above its latest up fractal: 1.206. This level can be used as an entry point. Initial risk cap possible below Parabolic signal, low since March 2020 and latest down fractal: 1.176. After opening a pending order, we move the stop following the Bollinger and Parabolic signals to the next fractal low. Thus, we change the potential profit/loss ratio in our favor. The most cautious traders after making a trade can switch to a four-hour chart and set a stop loss, moving it in the direction of movement. If the price overcomes the stop level (1.176) without activating the order (1.206), it is recommended to delete the order: there are internal changes in the market that were not taken into account.

Fundamental Analysis of Forex - GBP/USD​

Britain is to release important inflation data for June. Will the GBPUSD quotes continue to rise?

On July 20, the United Kingdom Consumer Price Index, Producer Price Index (PPI) Input and PPI Output, as well as other indicators of consumer and industrial inflation for June will be published. Preliminary forecasts are negative for the British pound. Accordingly, a further increase in the GBPUSD may occur if the real statistics again turn out to be better than expected. Prior to this, the figures had already exceeded forecasts twice. In particular, on July 19, data on the British labor market also for June were released, which turned out to be better than forecasts. This caused the strengthening of the British pound. It can be recalled that last week in Britain came the GDP and industrial production for May. They were also better than expected. On Friday, July 22, significant data on retail sales will be published.
 

IFC Markets

Master Trader
Oct 31, 2012
1,938
10
84
London (Great Britain)
www.ifcmarkets.com

Intel Technical Analysis - Intel Trading: 2022-07-21​


Intel Technical Analysis Summary​

Buy Stop։ Above 40.7​

Stop Loss: Below 36.29​


Indicator Signal
RSI Neutral
MACD Buy
Donchian Channel Neutral
MA(200) Sell
Fractals Buy
Parabolic SAR Buy


Intel Chart Analysis​


1b89f7b5ccb091a52b3b3c24f329b122b68b9cef.png


Intel Technical Analysis​

The technical analysis of the Intel stock price chart on daily timeframe shows #S-INTC,Daily is rebounding toward the 200-day moving average MA(200) after hitting four-and-half-year low three weeks ago. We believe the bullish momentum will continue after the price breaches above the upper boundary of Donchian channel at 40.7. This level can be used as an entry point for placing a pending order to buy. The stop loss can be placed below the fractal low at 36.29. After placing the order, the stop loss is to be moved every day to the next fractal low, following Parabolic indicator signals. Thus, we are changing the expected profit/loss ratio to the breakeven point. If the price meets the stop loss level (36.29) without reaching the order (40.7), we recommend cancelling the order: the market has undergone internal changes which were not taken into account.

Fundamental Analysis of Stocks - Intel​

Intel stock edged up after news the Senate may vote on a bill of chip industry subsidies this week. Will the Intel stock price persist advancing?

Intel Corporation is a major US chip manufacturer that designs, manufactures and sells computer products and technologies worldwide. The company capitalization is at $164.5 billion currently, the stock is trading at P/E Ratio (Trailing Twelve Months) of 6.68, Intel earned a revenue (ttm) of $77.7 billion and Return on Assets (ttm) of 7.38% and Return on Equity (ttm) of 26.92%. US Senate may vote on $52 billion in CHIPS Act as soon as this week which is aimed at bolstering the US computer chip industry. The bill includes $52 billion in subsidies and an investment tax credit to boost US manufacturing and has bipartisan support. Intel might get $20 billion from CHIPS Act, and another $5 billion from FABS Act introduced in the US House of Representatives which has the support of the Semiconductor Industry Association. Subsidies and tax credits are bullish for a company stock.
 

IFC Markets

Master Trader
Oct 31, 2012
1,938
10
84
London (Great Britain)
www.ifcmarkets.com

Johnson & Johnson Technical Analysis - Johnson & Johnson Trading: 2022-08-15​


Johnson & Johnson Technical Analysis Summary​

Sell Stop։ Below 166.95​

Stop Loss: Above 171.82​


Indicator Signal
RSI Buy
MACD Sell
Donchian Channel Sell
MA(200) Buy
Fractals Sell
Parabolic SAR Sell
Fibonacci Sell


Johnson & Johnson Chart Analysis​


07604cf8b2cfaeac67da0d0947e85b2f02f29b5c.png


Johnson & Johnson Technical Analysis​

The technical analysis of the Johnson & Johnson stock price chart on daily timeframe shows #S-JNJ,Daily is falling after breaching below the 200-day moving average MA(200) and has fallen below a support. The RSI however is in the oversold zones. We believe the bearish momentum will resume after the price breaches below the lower Donchian bound at 166.95. This level can be used as an entry point for placing a pending order to sell. The stop loss can be placed above 171.82. After placing the order, the stop loss is to be moved every day to the next fractal high, following Parabolic indicator signals. Thus, we are changing the expected profit/loss ratio to the breakeven point. If the price meets the stop loss level (171.82) without reaching the order (166.95), we recommend cancelling the order: the market has undergone internal changes which were not taken into account.

Fundamental Analysis of Stocks - Johnson & Johnson​

Johnson & Johnson announced it will discontinue talc-based baby powder in 2023. Will the Johnson & Johnson stock price continue retreating?

Johnson & Johnson is a United States corporation that develops, manufactures and sells various products in the healthcare field worldwide. Its market capitalization is $434.4 billion. The stock is trading at P/E ratio (Trailing Twelve Months) of 24.33 currently, company’s revenue (ttm) was $95.6 billion, while the Return on Equity (ttm) was 25.17% and the Return on Assets (ttm) at 8.9%. Johnson & Johnson has announced it will stop selling talc-based baby powder globally in 2023. J&J faces more than 40,000 lawsuits for its talc-based products, which allege that its talc products contain asbestos that causes cancer. J&J has established a $2 billion trust to resolve this claims, as well as allocated a royalty revenue stream with a present value of over $350 million to supplement the fund. The stock price closed down 1.1% over day after announcement.
 

IFC Markets

Master Trader
Oct 31, 2012
1,938
10
84
London (Great Britain)
www.ifcmarkets.com

COFFEE Technical Analysis - COFFEE Trading: 2022-08-23​

COFFEE Technical Analysis Summary

Buy Stop։ Above 225​

Stop Loss: Below 203​


IndicatorSignal
RSINeutral
MACDBuy
MA(200)Buy
FractalsNeutral
Parabolic SARBuy
Bollinger BandsNeutral

COFFEE Chart Analysis​

1661236290848.png

COFFEE Technical Analysis​

On the daily timeframe, COFFEE: D1 is growing towards the resistance line of the descending channel. It broke the 200-day moving average. A number of technical analysis [URL deleted] indicators formed signals for further growth. We do not rule out a bullish movement if COFFEE: D1 rises above the last upper fractal and the upper Bollinger band: 225. This level can be used as an entry point. The initial risk limit is possible below the Parabolic signal, the last lower fractal, the 200-day moving average line and the lower Bollinger line: 203. After opening a pending order, we move the stop following the Bollinger and Parabolic signals to the next fractal low. Thus, we change the potential profit/loss ratio in our favor. The most cautious traders after making a trade can switch to a four-hour chart and set a stop loss, moving it in the direction of movement. If the price overcomes the stop level (203) without activating the order (225), it is recommended to delete the order: there are internal changes in the market that were not taken into account.

Fundamental Analysis of Commodities - COFFEE​

Drought in Brazil could have a negative impact on the coffee crop. Will the COFFEE quotes continue to rise?

The Somar Meteorologia agency reported no rain in the Brazilian state of Minas Gerais. It accounts for 30% of the arabica coffee crop. According to weather forecast channel Climatempo the drought will continue in Brazil until the end of August. Maxar Technologies does not exclude the lack of rain in South America until the end of the year due to the natural phenomenon La Nina. Earlier, Cecafe reported a 16% y/y decline in Brazilian coffee exports in July to 2.17 million bags.
 
Last edited by a moderator:

IFC Markets

Master Trader
Oct 31, 2012
1,938
10
84
London (Great Britain)
www.ifcmarkets.com

WTI Technical Analysis - WTI Trading: 2022-08-24​


WTI Technical Analysis Summary​


IndicatorSignal
RSIBuy
MACDBuy
MA(200)Neutral
FractalsNeutral
Parabolic SARBuy

WTI Chart Analysis​

1661323615011.png


WTI Technical Analysis​

On the daily timeframe, OIL: D1 went up from the triangle. A number of technical analysis indicators formed signals for further growth. We do not rule out a bullish movement if OIL: D1 rises above the last up fractal: 94.5. This level can be used as an entry point. The initial risk limit is possible below the Parabolic signal and the last lower fractal: 84. After opening a pending order, we move the stop following the Bollinger and Parabolic signals to the next fractal low. Thus, we change the potential profit/loss ratio in our favor. The most cautious traders, after making a trade, can switch to a four-hour chart and set a stop loss, moving it in the direction of movement. If the price overcomes the stop level (84) without activating the order (94.5), it is recommended to delete the order: there are internal changes in the market that were not taken into account.

Fundamental Analysis of Commodities - WTI​

OPEC+ may cut production if Iran increases oil production. Will the OIL quotes continue to increase ?

Opinion was expressed by Abdulaziz bin Salman (Minister of Energy of Saudi Arabia) regarding the information about a possible mitigation of Iran's demands (position) during negotiations with Western countries on the "nuclear deal". The next OPEC+ meeting is scheduled for September 5, 2022. It should be noted that OPEC+ production in July was already 2.89 million barrels per day (bpd) less than previously approved quotas. This was mainly due to Western economic sanctions against Russia. A significant factor in the rise in oil prices may be its use for heating and power generation in European countries against the backdrop of rising natural gas prices on August 22, 2022 to $3,000 per thousand cubic meters (according to the Title Transfer Facility).
 

IFC Markets

Master Trader
Oct 31, 2012
1,938
10
84
London (Great Britain)
www.ifcmarkets.com

Antofagasta PLC Technical Analysis - Antofagasta PLC Trading: 2022-08-25​


Antofagasta PLC Technical Analysis Summary​


Below 1096
Sell Stop

Above 1197.75
Stop Loss

Indicator
Signal
RSINeutral
MACDNeutral
Donchian ChannelNeutral
MA(200)Sell
FractalsSell
Parabolic SARSell


Antofagasta PLC Chart Analysis​


Antofagasta PLC Technical Analysis​

The technical analysis of the Antofagasta stock price chart in daily timeframe shows #L-ANTO, Daily is retracing down toward the two-year low it hit six weeks ago under the 200-day moving average MA(200). We believe the bearish momentum will continue after the price breaches below the lower boundary of the Donchian channel at 1096. This level can be used as an entry point for placing a pending order to sell. The stop loss can be placed above the upper boundary of the Donchian channel at 1197.75. After placing the order, the stop loss is to be moved every day to the next fractal high, following Parabolic indicator signals. Thus, we are changing the expected profit/loss ratio to the breakeven point. If the price meets the stop loss level (1197.75) without reaching the order (1096), we recommend cancelling the order: the market has undergone internal changes which were not taken into account.

Fundamental Analysis of Stocks - Antofagasta PLC​

Antofagasta stock rose after a report the company had sued the US government to revive its proposed Minnesota copper and nickel mine. Will the Antofagasta stock price continue rebounding?

Antofagasta plc is a Chilean publicly traded multinational mining company. Company’s market capitalization is at £11.31 billion. ANTOFAGASTA stock is trading at P/E Ratio (Trailing Twelve Months) of 15.09 currently. The company earned £6.41 billion revenue (ttm) and a Return on Assets (ttm) of 8.45% and a Return on Equity (ttm) of 14.95%. Antofagasta Plc's Twin Metals subsidiary sued the US government on Monday to revive its proposed Minnesota copper and nickel mine. The company claims the lease cancellations in January by the US Department of the Interior were "arbitrary and capricious". Twin Metals asked the US District Court in Washington to restore the leases, which were first granted in 1966 and have been passed between successor companies. No mining has taken place at the site. Restoration of leases may lead to copper and nickel mining which will be bullish for stock price. The stock price gained 2.8% on day after the news.
 

IFC Markets

Master Trader
Oct 31, 2012
1,938
10
84
London (Great Britain)
www.ifcmarkets.com

Nvidia Technical Analysis - Nvidia Trading: 2022-08-26​

Nvidia Technical Analysis Summary​

Below 168.82
Sell Stop

Above 191.48
Stop Loss


IndicatorSignal
RSINeutral
MACDNeutral
Donchian ChannelSell
MA(200)Sell
FractalsSell
Parabolic SARSell

Nvidia Chart Analysis​


Nvidia Technical Analysis​


The technical analysis of the Nvidia stock price chart on daily timeframe shows #S-NVDA, Daily is attempting to retrace up toward the 200-day moving average MA(200) which is declining itself. We believe the bearish momentum will resume after the price breaches below the lower boundary of Donchian channel at 168.82. This level can be used as an entry point for placing a pending order to sell. The stop loss can be placed above the upper boundary of Donchian channel at 191.48. After placing the order, the stop loss is to be moved every day to the next fractal high, following Parabolic indicator signals. Thus, we are changing the expected profit/loss ratio to the breakeven point. If the price meets the stop loss level (191.48) without reaching the order (168.82), we recommend cancelling the order: the market has undergone internal changes which were not taken into account.

Fundamental Analysis of Stocks - Nvidia​


Nvidia stock price edged up despite the chip maker forecast next quarter revenue below analysts' estimates. Will the Nvidia stock price continue rebounding?

Nvidia reported on Wednesday second quarter 2022 revenue of $6.7 billion, versus forecasts of $6.83 billion. Its earnings missed expectations 1.9%. Data center revenue grew 61% over year to a record $3.81 billion in the second quarter. Gaming revenue fell 33% from a year ago to $2.04 billion. As to next quarter guidance, Nvidia expects third quarter revenue of about $5.9 billion, plus or minus 2%, compared with analysts' consensus estimate of $6.92 billion. Shares edged up 0.1% on the day after quarterly report.
 

IFC Markets

Master Trader
Oct 31, 2012
1,938
10
84
London (Great Britain)
www.ifcmarkets.com

Corn Technical Analysis - Corn Trading: 2022-08-29​


Corn Technical Analysis Summary​

Above 671
Buy Stop

Below 571
Stop Loss


IndicatorSignal
RSINeutral
MACDBuy
MA(200)Neutral
FractalsNeutral
Parabolic SARBuy
Bollinger BandsNeutral


Corn Chart Analysis​

Corn Technical Analysis​

On the daily timeframe, CORN: D1 has broken through the downtrend resistance line upwards. It must also exceed the 200-day moving average before entering a position. A number of technical analysis indicators formed signals for further growth. We do not rule out a bullish movement if CORN: D1 rises above the latest up fractal, 200-day moving average and upper Bollinger band: 671. This level can be used as an entry point. The initial risk limit is possible below the Parabolic signal, the lower Bollinger band, the 9-month low and the last 2 lower fractals: 571. After opening a pending order, we move the stop following the Bollinger and Parabolic signals to the next fractal low. Thus, we change the potential profit/loss ratio in our favor. The most cautious traders, after making a trade, can switch to a four-hour chart and set a stop loss, moving it in the direction of movement. If the price overcomes the stop level (571) without activating the order (671), it is recommended to delete the order: there are internal changes in the market that were not taken into account.

Fundamental Analysis of Commodities - Corn​

The EU lowered the forecast for the corn crop. Will the CORN quotes continue to rise?

The European Commission has lowered the forecast for the corn crop in European countries for the 2022/2023 agricultural season from 65.8 million tons to 59.3 million tons. The main reason for this was the drought in France, Hungary, Romania and Bulgaria. The United States Department of Agriculture expects U.S. corn production to fall 5% this season to 14.36 billion bushels compared to 2021/2022 due to a 4% reduction in planted area and a slight decrease in yields. It is worth noting that earlier the International Grains Council cut its forecast for world corn production.
 
Last edited: