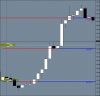
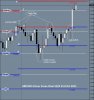
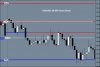
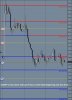
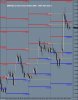
Three of yesterdays Intraday Charts for your interest. I have highlighted with white arrows where the previous days levels were. As you can see, previous levels are important. I always mark these Levels myself in my Day Trading - they play a big part in my analysis.
For more examples and for details of the free trial please visit:
Three of yesterdays Intraday Charts for your interest, on different Time Frames. I have marked previous days levels with a white arrow and Line to show their continuation.
Have a look at the Blog for more Chart examples which illustrate the accuracy of the Indicator. Also there is info on the new beta version and the two week free trial which is still available.
Apologies for lack of posts and the lateness of this one. I've been having real problems with my Hosting service but hopefully all should be sorted out now.
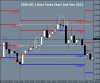
Three of last weeks Four Hour Charts for your interest. Please visit the blog for more of the same with different currency pairs.
I thought I would show the Daily Levels that were predicted for Oct 2011 for three currency pairs. Previous levels are marked with a white arrow to show their continuation.
Please visit the blog for more of the same with different currency pairs.
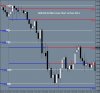
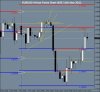
Three charts for you from yesterday, including a AUDJPY 1 Hour chart, with just the 4 Hour Levels showing. This demonstrates the scope of the indicator. You could have daily levels on a 5 Min chart if you so wished, or Hourly levels on a 15 Min chart. There are many variations and combinations.
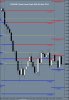
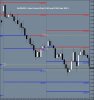
Three of yesterdays charts for you, including another "just four hour levels" on a smaller Time Frame chart, this time being USDCAD on a 30 Min Chart which shows from the beginning of this week. I have marked previous days/week levels with white arrows on all charts.
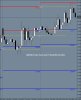
Three of last weeks four hour charts for your interest. I have marked last weeks levels with white arrows and yellow trendlines to show their continuation.
Three charts for you, all one hour time frames from yesterday and up to today (approx 9PM UK Time), so basically two days charts in one picture. As usual I have marked the previous days levels with white arrows.
Three Hourly charts from Monday and Tuesday together. I have illustrated previous levels with white arrows. See how even Levels from Friday can act as support and resistance.
Three of last weeks Four Hour Charts for your interest. The previous week levels are marked with white arrows to show their continuation. More of last weeks charts on the blog.
Three of last weeks Four Hour Charts for your interest. As usual, previous Week levels are marked with white arrows and Gold coloured Lines to how their continuation. Other white Lines are my own support and resistance lines.
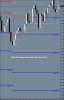
I have three charts for your interest. They are One Hour Tome Frame charts from the beginning of the week till today. As usual I have marked the Previous Days levels with White Arrows and Gold Lines to show their continuation, so you can see how they provide support and resistance.
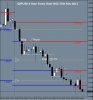
Three of last weeks Four Hour Charts for your interest. Previous Week Levels are marked with White Arrows and Gold Trend Lines to show their continuation. I have added some of my own Support and Resistance Trend Lines coloured in Thin White.