Superb Forex levels

  • Thread starter Thread starter RobT
  • Start date Start date
  • Watchers Watchers 2
Hi There,

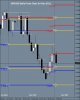
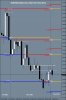
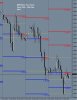
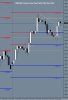
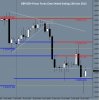
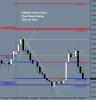
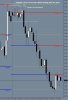
Three of November 2011 Daily Charts for your interest. Previous Month Levels (October) are marked with White Arrows and Gold Trend Lines to show their continuation. I have also added some of my own Support and Resistance Trend Lines coloured in Thin White.

As you can see, December 2011 Levels are visible and I have also illustrated where Novembers Levels continue on with White Arrows and Gold trend Lines.

There's more of last months Daily Charts on the blog.

http://superbforexlevels.com/blog

Best Regards and Good Trading

RobT
 

Attachments

  • GBPJPY Daily Chart Nov 2011.JPG
    GBPJPY Daily Chart Nov 2011.JPG
    93.4 KB · Views: 2
  • GBPUSD Daily Chart Nov 2011.JPG
    GBPUSD Daily Chart Nov 2011.JPG
    97.7 KB · Views: 1
  • EURUSD Daily Chart Nov 2011.JPG
    EURUSD Daily Chart Nov 2011.JPG
    99.2 KB · Views: 3
Hi There,

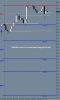
OK, two charts for you. They are one hour charts from the beginning of the week to yesterday (5th - 7th). Previous days levels have been marked with Gold Trend Lines to show their continuation.

More on the Blog.

http://superbforexlevels.com/blog

Cheers and Good Trading

RobT
 

Attachments

  • EURUSD 1 Hour Forex Chart 5th - 7th Dec 2011.JPG
    EURUSD 1 Hour Forex Chart 5th - 7th Dec 2011.JPG
    119.5 KB · Views: 3
  • GBPUSD 1 Hour Forex Chart 5th - 7th Dec 2011.JPG
    GBPUSD 1 Hour Forex Chart 5th - 7th Dec 2011.JPG
    118.9 KB · Views: 3
Hi There,

Three of last weeks Four Hour Charts for your interest. As usual Previous Weeks levels have been marked with Gold Trend Lines and White Arrows to show their continuation. I have also included some of my own Support and Resistance Levels which are marked in White Thin trend Lines.

More on the Blog

http://superbforexlevels.com/blog

Cheers and Good Trading

RobT
 

Attachments

  • EURUSD 4 Hour Forex Chart Week Ending 9th Dec 2011.JPG
    EURUSD 4 Hour Forex Chart Week Ending 9th Dec 2011.JPG
    107.1 KB · Views: 3
  • GBPUSD 4 Hour Forex Chart Week Ending 9th Dec 2011.JPG
    GBPUSD 4 Hour Forex Chart Week Ending 9th Dec 2011.JPG
    96.6 KB · Views: 1
  • USDCAD 4 Hour Forex Chart Week Ending 9th Dec 2011.JPG
    USDCAD 4 Hour Forex Chart Week Ending 9th Dec 2011.JPG
    101.1 KB · Views: 1
Hi There,

Two Charts for your interest both from Monday till today, both one hour charts. I have marked the previous days levels with Gold trend Lines.

As always - more new charts and other info on the Blog

http://superbforexlevels.com/blog

Cheers and Good trading

RobT
 

Attachments

  • EURUSD 1 hour Forex Chart 12th - 14th Dec 2011.JPG
    EURUSD 1 hour Forex Chart 12th - 14th Dec 2011.JPG
    110.1 KB · Views: 1
  • GBPUSD 1 hour Forex Chart 12th - 14th Dec 2011.JPG
    GBPUSD 1 hour Forex Chart 12th - 14th Dec 2011.JPG
    107.1 KB · Views: 1
Hi There,

Three of last weeks 4 Hour Charts for your interest.

As usual I have marked the previous week levels with gold coloured trend lines to show their continuations, so as to illustrate how they act as support and resistance. I have also marked some of my own support and resistance lines with white trend lines.

More on the Blog.

http://superbforexlevels.com/blog

Cheers and Good Trading

RobT
 

Attachments

  • GBPUSD 4 hour forex chart week ending 16th Dec 2011.JPG
    GBPUSD 4 hour forex chart week ending 16th Dec 2011.JPG
    90.8 KB · Views: 1
  • EURUSD 4 hour forex chart week ending 16th Dec 2011.JPG
    EURUSD 4 hour forex chart week ending 16th Dec 2011.JPG
    96.3 KB · Views: 2
  • USDCAD 4 hour forex chart week ending 16th Dec 2011.JPG
    USDCAD 4 hour forex chart week ending 16th Dec 2011.JPG
    101.4 KB · Views: 1
Hi There,

OK - two midweek charts for your interest, both 1 Hour time frames. As ususal I have marked the previous days levels with Gold Trend Lines.

More of the same on the Blog.

http://superbforexlevels.com/blog

Cheers and Good Trading

RobT
 

Attachments

  • EURUSD 1 hour Forex Chart 19th - 20th Dec 2011.JPG
    EURUSD 1 hour Forex Chart 19th - 20th Dec 2011.JPG
    103.9 KB · Views: 1
  • GBPUSD 1 hour Forex Chart 19th - 20th Dec 2011.JPG
    GBPUSD 1 hour Forex Chart 19th - 20th Dec 2011.JPG
    106.6 KB · Views: 1
Hi There,

Three Charts for your interest. One is a AUDUSD 1 Hour Chart for the whole week with just the 4 Hour Levels activated. This shows the scope of the Indicator and how you can mix different Time Frames with different Time Frame Levels.

The other two are 4 Hour Charts from last week. As usual, previous week levels are marked with gold coloured trend lines to show their continuation. I have also illustrated some of my own support and resistance lines illustrated in white trend lines.

More of the same on the blog.

http://superbforexlevels.com/blog

I wish you all a happy xmas and a prosperous new year.

Cheers
 

Attachments

  • AUDUSD 1 Hour Forex Chart With Just 4 Hour Levels Week Ending 23rd Dec 2011.JPG
    AUDUSD 1 Hour Forex Chart With Just 4 Hour Levels Week Ending 23rd Dec 2011.JPG
    126.2 KB · Views: 3
  • GBPUSD 4 Hour Forex Chart Week Ending 23rd Dec 2011.JPG
    GBPUSD 4 Hour Forex Chart Week Ending 23rd Dec 2011.JPG
    96.6 KB · Views: 3
  • EURUSD 4 Hour Forex Chart Week Ending 23rd Dec 2011.JPG
    EURUSD 4 Hour Forex Chart Week Ending 23rd Dec 2011.JPG
    85.6 KB · Views: 1
Hi There,

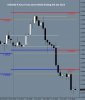
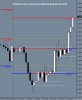
Two Charts for your interest - a EURUSD Weekly (End of year) Chart and a Cable Daily Chart for December. More of these charts are on the blog plus some 4 Hour Charts.

As usual I have marked previous Levels with Gold Trend Lines and some my own Support and Resistance levels with White trend Lines.

Happy New Year and good Trading to you All.

Cheers

RobT

http://superbforexlevels.com/blog
 

Attachments

  • EURUSD Weekly Chart for 2011.JPG
    EURUSD Weekly Chart for 2011.JPG
    171 KB · Views: 3
  • GBPUSD Daily Forex Chart Dec 2011.JPG
    GBPUSD Daily Forex Chart Dec 2011.JPG
    94.3 KB · Views: 1
Hi There,

Happy New Year Traders - I wish you all a fantastic, highly profitable 2012.

OK - three of last weeks four hour charts for your interest. As always, Previous Week Levels are marked with gold coloured trend lines to show their continuation and how they act as support and resistance. I have also illustrated some of my own support and resistance lines illustrated in white trend lines.

Much more on the Blog.

http://superbforexlevels.com/blog

Cheers

RobT
 

Attachments

  • GBPUSD 4 Hour Forex Chart Week Ending 6th Jan 2012.JPG
    GBPUSD 4 Hour Forex Chart Week Ending 6th Jan 2012.JPG
    90 KB · Views: 1
  • EURUSD 4 Hour Forex Chart Week Ending 6th Jan 2012.JPG
    EURUSD 4 Hour Forex Chart Week Ending 6th Jan 2012.JPG
    73.7 KB · Views: 3
  • USDCAD 4 Hour Forex Chart Week Ending 6th Jan 2012.JPG
    USDCAD 4 Hour Forex Chart Week Ending 6th Jan 2012.JPG
    83.1 KB · Views: 1
Hi There,

Three Charts for your interest. Two are Forex and also a Silver chart (these levels are available for Gold, Silver, FTSE and a host of others).

Please visit the Blog for more charts and info.

http://superbforexlevels.com/blog

Cheers and Good Trading.

RobT
 

Attachments

  • SILVER 4 Hour Chart Week Ending 13th Jan 2012.JPG
    SILVER 4 Hour Chart Week Ending 13th Jan 2012.JPG
    82.8 KB · Views: 3
  • GBPUSD 4 Hour Forex Chart Week Ending 13th Jan 2012.JPG
    GBPUSD 4 Hour Forex Chart Week Ending 13th Jan 2012.JPG
    85.9 KB · Views: 1
  • EURCAD 4 Hour Forex Chart Week Ending 13th Jan 2012.JPG
    EURCAD 4 Hour Forex Chart Week Ending 13th Jan 2012.JPG
    90.4 KB · Views: 1
Hi There,

Three of last weeks charts for your interest. As usual Previous Week Levels are marked with gold coloured trend lines to show their continuation and how they act as support and resistance. I have also illustrated some of my own support and resistance lines illustrated in white trend lines.

Please visit the blog for five more recent charts and info.

http://superbforexlevels.com/blog

Cheers and Good Trading.

RobT
 

Attachments

  • EURUSD 4 Hour Forex Chart Week Ending 20th Jan 2012.JPG
    EURUSD 4 Hour Forex Chart Week Ending 20th Jan 2012.JPG
    110.9 KB · Views: 3
  • GBPUSD 4 Hour Forex Chart Week Ending 20th Jan 2012.JPG
    GBPUSD 4 Hour Forex Chart Week Ending 20th Jan 2012.JPG
    93.6 KB · Views: 1
  • USDCHF 4 Hour Forex Chart Week Ending 20th Jan 2012.JPG
    USDCHF 4 Hour Forex Chart Week Ending 20th Jan 2012.JPG
    101.4 KB · Views: 3
Hi There,

There seems to have been a problem with this forum but all seems ok now so here are 3 intraday charts from this week. As usual Previous Days Levels are marked with gold coloured trend lines to show their continuation. You can see how they can act as support and resistance.

More on the blog.

http://superbforexlevels.com/blog

Cheers All

RobT
 

Attachments

  • EURUSD 15 min Forex Chart 24th and 25th Jan 2012.JPG
    EURUSD 15 min Forex Chart 24th and 25th Jan 2012.JPG
    133.4 KB · Views: 3
  • GBPUSD 15 min Forex Chart 24th and 25th Jan 2012.JPG
    GBPUSD 15 min Forex Chart 24th and 25th Jan 2012.JPG
    135 KB · Views: 1
  • USDCAD 15 min Forex Chart 24th and 25th Jan 2012.JPG
    USDCAD 15 min Forex Chart 24th and 25th Jan 2012.JPG
    127.9 KB · Views: 3
Hi There,

An assortment of new charts are now on the blog including Daily, 4 Hour, 30 Min and 15 Min. There are also some charts illustrating lower time frame levels on higher time frame charts (for example: Hourly levels on a 15 Min chart). These charts show the versatility of the Indicator and how it can be customised to suit your own needs.

As usual Previous Levels are marked with gold coloured trend lines to show their continuation so you can see how they can act as support and resistance.

http://superbforexlevels.com/blog

Cheers and good trading

RobT
 

Attachments

  • AUDUSD 1 Hour Chart with just H4 and D1 Levels 20th Jan to 27th Jan 2012.JPG
    AUDUSD 1 Hour Chart with just H4 and D1 Levels 20th Jan to 27th Jan 2012.JPG
    140 KB · Views: 3
  • GBPUSD 4 Hour Forex Chart 9th Jan to 27th Jan 2012.JPG
    GBPUSD 4 Hour Forex Chart 9th Jan to 27th Jan 2012.JPG
    126 KB · Views: 1
  • EURJPY 30 min Forex Chart 27th Jan 2012.JPG
    EURJPY 30 min Forex Chart 27th Jan 2012.JPG
    95.3 KB · Views: 1
Hi There,

Three of last weeks 4 hour charts for your interest. As always, Previous Weeks Levels are marked with gold coloured trend lines to show their continuation. You can see how they can act as great support and resistance. I have also added some of my own support and resistance lines illustrated in white trend lines.

More on the blog.

http://superbforexlevels.com/blog

Cheers and Good Trading

RobT
 

Attachments

  • GBPUSD 4 Hour Forex Chart Week Ending 3rd Feb 2011.JPG
    GBPUSD 4 Hour Forex Chart Week Ending 3rd Feb 2011.JPG
    94 KB · Views: 3
  • EURUSD 4 Hour Forex Chart Week Ending 3rd Feb 2011.JPG
    EURUSD 4 Hour Forex Chart Week Ending 3rd Feb 2011.JPG
    107.6 KB · Views: 4
  • USDCHF 4 Hour Forex Chart Week Ending 3rd Feb 2011.JPG
    USDCHF 4 Hour Forex Chart Week Ending 3rd Feb 2011.JPG
    81.8 KB · Views: 2
Hi There,

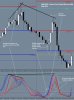
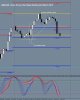
Three of last weeks charts for your interest. You will see there is more analysis and and an introduction to a stochastic indicator that i have been using for a while now and which i think is very useful in conjuction with the Levels Indicator. I also use Murrey math levels in my trading, which can be very useful especially if they are at or around the Support and Resistance Levels.

As usual Previous Weeks/Days Levels are marked with gold coloured trend lines to show their continuation. You can see how they can act as support and resistance. I have also added some of my own support and resistance lines illustrated in white trend lines.

Much more on the blog including details/download of my own Template and Indicators and also the Stochastic Indicator set up.

http://superbforexlevels.com/blog

Cheers and Good Trading

RobT
 

Attachments

  • GBPUSD 4 Hour Forex Chart Week Ending 10th Feb 2011.JPG
    GBPUSD 4 Hour Forex Chart Week Ending 10th Feb 2011.JPG
    195.5 KB · Views: 1
  • EURUSD 4 Hour Forex Chart Week Ending 10th Feb 2011.JPG
    EURUSD 4 Hour Forex Chart Week Ending 10th Feb 2011.JPG
    163.5 KB · Views: 1
  • GBPUSD 1 Hour Forex Chart 9th and 10th Feb 2011.JPG
    GBPUSD 1 Hour Forex Chart 9th and 10th Feb 2011.JPG
    170.1 KB · Views: 1
Hi There,

Three of last weeks 4 hour charts for you with analysis. As usual, Previous Weeks Levels are marked with gold coloured trend lines to show their continuation so you can see how they can act as great support and resistance. I have also added some of my own support and resistance lines illustrated in white trend lines.

More of the same on the blog.

http://superbforexlevels.com/blog

Cheers and Good Trading

RobT
 

Attachments

  • EURUSD 4 Hour Forex Chart Week Ending 17th Feb 2012.JPG
    EURUSD 4 Hour Forex Chart Week Ending 17th Feb 2012.JPG
    183.8 KB · Views: 3
  • GBPUSD 4 Hour Forex Chart Week Ending 17th Feb 2012.JPG
    GBPUSD 4 Hour Forex Chart Week Ending 17th Feb 2012.JPG
    170.6 KB · Views: 3
  • AUDUSD 4 Hour Forex Chart Week Ending 17th Feb 2012.JPG
    AUDUSD 4 Hour Forex Chart Week Ending 17th Feb 2012.JPG
    171.8 KB · Views: 3
Hi There,

Three of last weeks 4 hour charts for your interest. As usual, Previous Weeks Levels are marked with gold coloured trend lines to show their continuation. You can see how they can act as great support and resistance.I have also added some of my own support and resistance lines illustrated in white trend lines.

More on the Blog

http://superbforexlevels.com/blog

Cheers and Good Trading

RobT
 

Attachments

  • EURUSD 4 Hour Forex Chart Week Ending 24th Feb 2012.JPG
    EURUSD 4 Hour Forex Chart Week Ending 24th Feb 2012.JPG
    140.4 KB · Views: 1
  • GBPUSD 4 Hour Forex Chart Week Ending 24th Feb 2012.JPG
    GBPUSD 4 Hour Forex Chart Week Ending 24th Feb 2012.JPG
    157.6 KB · Views: 4
  • USDJPY 4 Hour Forex Chart Week Ending 24th Feb 2012.JPG
    USDJPY 4 Hour Forex Chart Week Ending 24th Feb 2012.JPG
    163 KB · Views: 1
Hi There,

Some longer time frame charts for your interest. As usual, Previous Weeks Levels are marked with gold coloured trend lines to show their continuation. Please visit the blog for more charts and info.

Cheers and Good Trading.

http://superbforexlevels.com/blog

RobT
 

Attachments

  • EURUSD Daily Forex Chart Feb 2012.JPG
    EURUSD Daily Forex Chart Feb 2012.JPG
    164.9 KB · Views: 1
  • GBPUSD 4 Hour Forex Chart Week Ending 2nd March 2012.JPG
    GBPUSD 4 Hour Forex Chart Week Ending 2nd March 2012.JPG
    161.4 KB · Views: 1
Hi There,

Exciting news with regard to the new PMP version which will be available in the next few weeks. There are many great new features incuding the ability to use the Indicator on Range bar and Renko Charts, and also Odd Time Frame Charts (2, 3, 7 Hour or Minute). You can read about it on the blog. I will post some charts illustrating whats new.

As usual Previous Day/Weeks Levels are marked with gold coloured trend lines to show their continuation and how they act as support and resistance (the new PMP version does this automatically with the Price printed as well if so desired).

http://superbforexlevels.com/blog

Cheers and Good Trading

RobT
 

Attachments

  • EURUSD 7 Pip Range Bar Forex Chart 9th March 2012.JPG
    EURUSD 7 Pip Range Bar Forex Chart 9th March 2012.JPG
    202.6 KB · Views: 2
  • EURJPY 30 Min Forex Chart 9th March 2012.JPG
    EURJPY 30 Min Forex Chart 9th March 2012.JPG
    180.4 KB · Views: 1
  • GBPUSD 4 Hour Forex Chart Week Ending 9th March 2012.JPG
    GBPUSD 4 Hour Forex Chart Week Ending 9th March 2012.JPG
    173 KB · Views: 3
Hi There,

Three charts from last week. One 4 Hour, one 1 hour and an 8 Pip Range Bar Chart. I am using the beta version of the next release of PMP and one of the exciting new features is being able to use the Indicator with Range Bar Charts and also Renko charts, if they are what you trade.

Many more screen shots on the blog.

http://superbforexlevels.com/blog

Cheers and Good Trading

RobT
 

Attachments

  • GBPUSD 4 Hour Forex Chart Week Ending 16th March 2012.JPG
    GBPUSD 4 Hour Forex Chart Week Ending 16th March 2012.JPG
    151.3 KB · Views: 1
  • USDCHF 1 Hour Forex Chart 16th March 2012.JPG
    USDCHF 1 Hour Forex Chart 16th March 2012.JPG
    120.7 KB · Views: 2
  • EURUSD 8 PIP Range Bar Forex Chart 16th March 2012.JPG
    EURUSD 8 PIP Range Bar Forex Chart 16th March 2012.JPG
    179.4 KB · Views: 3