
Signal Bands is a sensitive and convenient indicator, which performs deep statistical processing of information. It allows to see on one chart (1) the price trend, (2) the clear price channel and (3) latent signs of trend change. The indicator can be used on charts of any periods, but it is especially useful for scalping due to its high sensitivity to the current market state.
The functions of the indicator:
Indicator Settings

Fig. 1. USDCHFDaily.
Points 1-4, where the signal line falls into the price range of the price - a strong signal. The sharp peak at the bottom, which unfolded the trend in the scale of Fig. 1, did not hit and is shown in Fig.2.

Fig. 2. USDCHFDaily large scale.

Fig. 3. EURUSDM15.

Fig. 4. AUDUSDDaily.
Download or buy the indicator you can by reference Signal Bands.
The functions of the indicator:
- First, the Signal Bands indicator draws channels into which all price fluctuations exactly fit, so with default parameters, the price will never exceed the limits of this channel (except for the occurrence of very high peaks of signal information, when the peak from the opposite side of the signal line directly enters the channel. See Fig. 1 points 1-4).
- Sharp movements on channel lines (sharp peaks) indicate a change in price direction. Signals provided by such sharp peaks are often leading, i.e. they occur about 1-2 bars before the beginning of price reversal. A sharp downward peak at the bottom line of the channel down is the criterion for the reversal of the price upwards. Conversely, the sharp upward peak of the upper channel line precedes the downward price reversal.
Indicator Settings
- Price type. Values: Close price (default), Open price, High price, Low price, Median price ((high + low)/2), Typical price ((high + low + close)/3), Weighted price ((high + low + 2*close)/4).
- The averaging method. Values: Simple (default), Exponential, Smoothed, Linear weighted.
- The averaging period - averaging period.
- Channel width factor - channel width factor.

Fig. 1. USDCHFDaily.
Points 1-4, where the signal line falls into the price range of the price - a strong signal. The sharp peak at the bottom, which unfolded the trend in the scale of Fig. 1, did not hit and is shown in Fig.2.
Fig. 2. USDCHFDaily large scale.
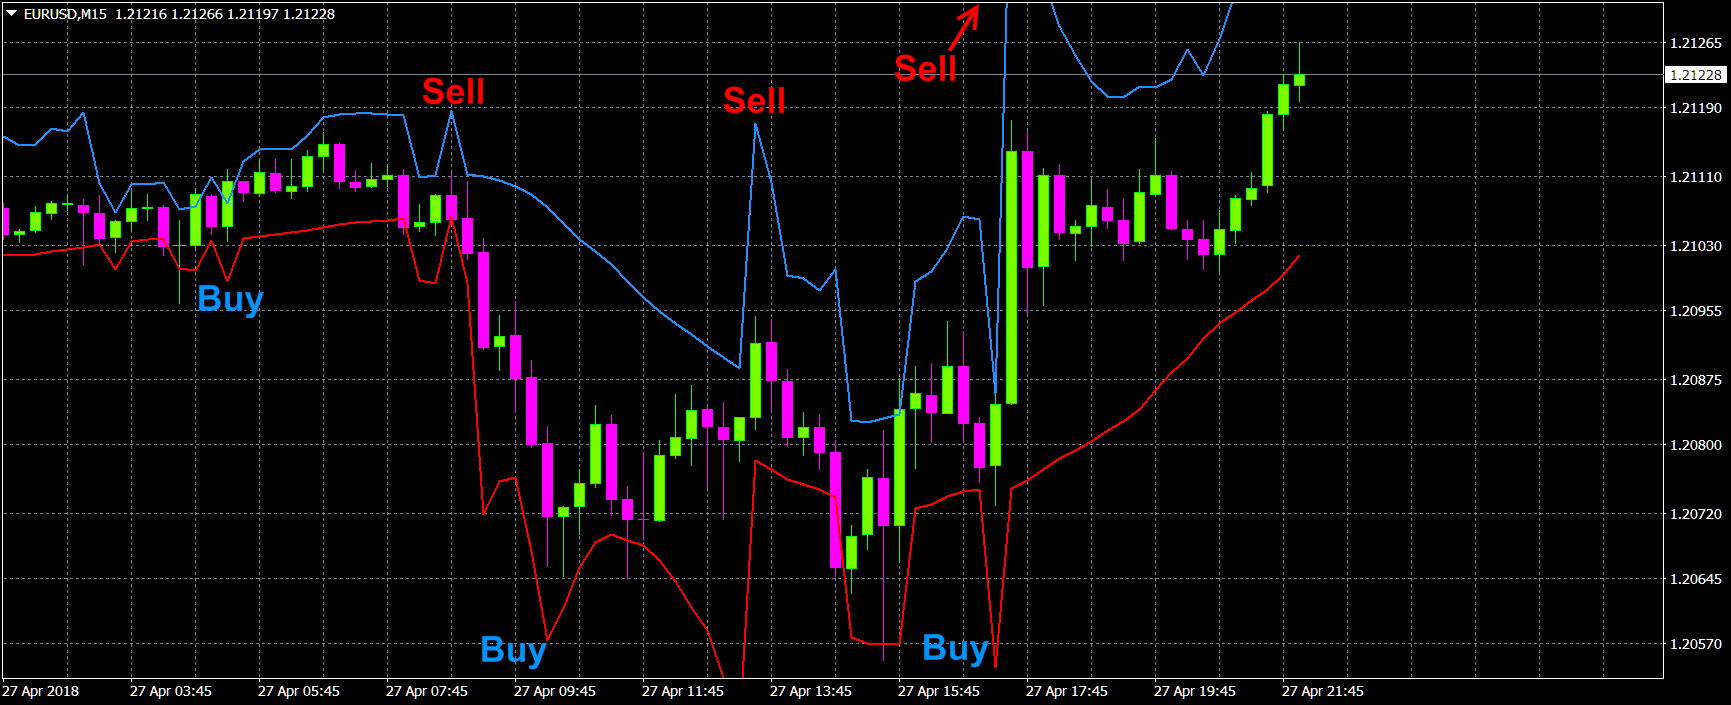
Fig. 3. EURUSDM15.
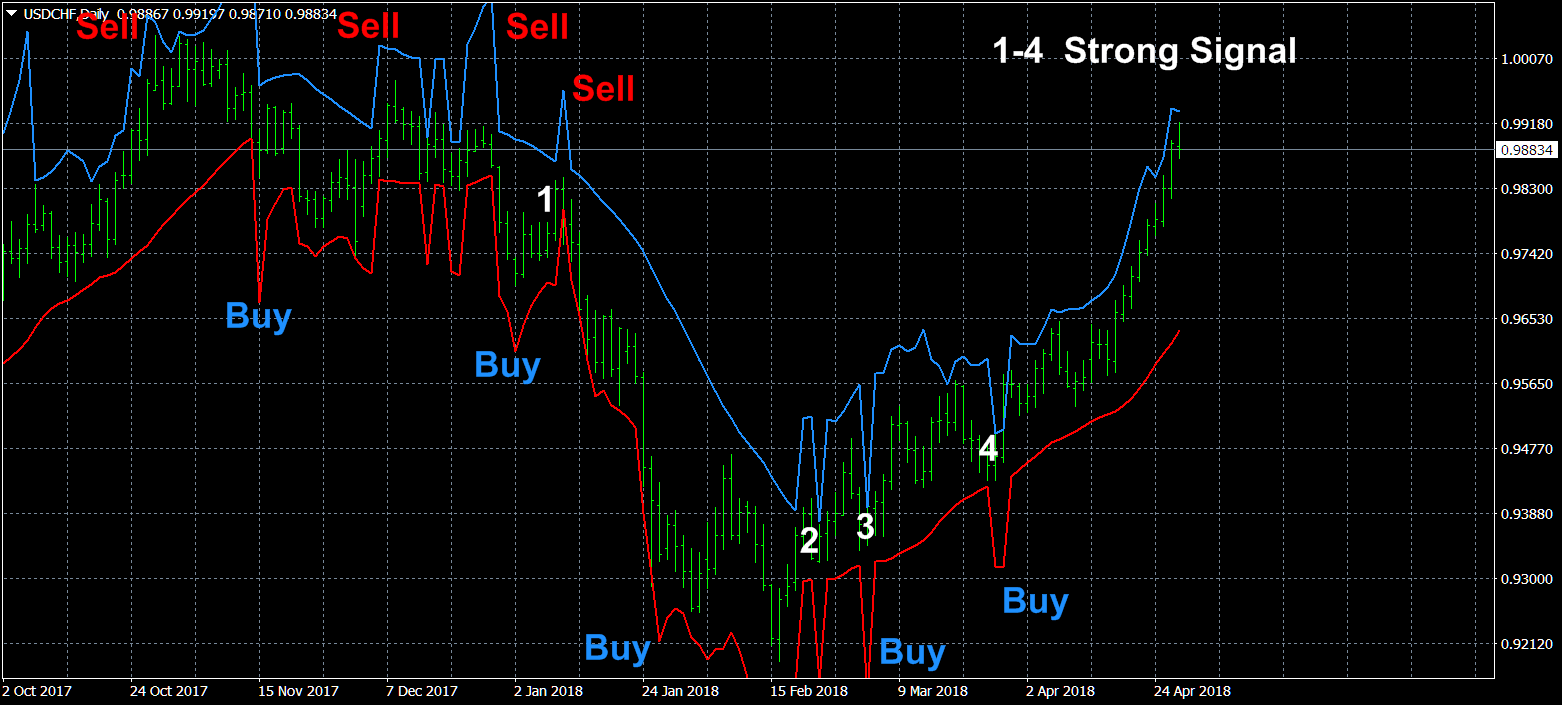
Fig. 4. AUDUSDDaily.
Download or buy the indicator you can by reference Signal Bands.
