The RSI Multi Length Indicator in MT4 enhances the traditional Relative Strength Index by calculating RSI values across several periods at once. This approach adapts to changing market conditions and provides traders with sharper and more reliable signals.
The indicator also plots two dynamic horizontal levels—one red and one green. These serve as overbought and oversold thresholds, helping traders quickly spot potential reversal zones when the RSI crosses them.
Specifications
Category: Oscillators, Signal & Forecast Indicators
️ Platform: MetaTrader 4
Skill Level: Intermediate
Type: Overbought/Oversold & Reversal Indicator
⏳ Timeframe: Multi-Timeframe
⚡ Trading Styles: Day Trading, Scalping, Swing Trading
Markets: Forex, Crypto, Stocks
Download: https://cdn.tradingfinder.com/file/480244/rsi-multi-length-indicator-mt4-by-tflab.zip

How It Generates Signals
For example, on the EUR/USD 1-hour chart, a breach of the green level highlights oversold conditions suitable for long entries. On the Solana 30-minute chart, the indicator marks red dots when the market enters overbought territory, indicating possible short setups.
Adjustable Settings
Conclusion
The RSI Multi Length Indicator combines the strength of multiple RSI calculations with visual signals, making it easier to detect momentum shifts. By clearly marking overbought and oversold areas, it helps traders refine entries and exits while reducing noise from a single-period RSI.


The indicator also plots two dynamic horizontal levels—one red and one green. These serve as overbought and oversold thresholds, helping traders quickly spot potential reversal zones when the RSI crosses them.
Specifications
Category: Oscillators, Signal & Forecast Indicators
️ Platform: MetaTrader 4
Skill Level: Intermediate
Type: Overbought/Oversold & Reversal Indicator
⏳ Timeframe: Multi-Timeframe
⚡ Trading Styles: Day Trading, Scalping, Swing Trading
Markets: Forex, Crypto, Stocks
Download: https://cdn.tradingfinder.com/file/480244/rsi-multi-length-indicator-mt4-by-tflab.zip

How It Generates Signals
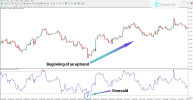
- When the RSI line falls below the green boundary, the indicator marks the chart with green dots, showing an oversold zone that could lead to upward reversals or buying opportunities.
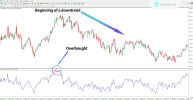
- When the RSI rises above the red boundary, red dots appear, signaling overbought conditions that often precede downward corrections or selling opportunities.
For example, on the EUR/USD 1-hour chart, a breach of the green level highlights oversold conditions suitable for long entries. On the Solana 30-minute chart, the indicator marks red dots when the market enters overbought territory, indicating possible short setups.
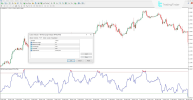
Adjustable Settings
- Maximum Length: Longer RSI calculation period for slower, smoother signals
- Minimum Length: Shorter RSI period for faster, more sensitive signals
- Overbought/Oversold Levels: Custom thresholds for signal zones
- Applied Price: Choice of price type for RSI calculation
Conclusion
The RSI Multi Length Indicator combines the strength of multiple RSI calculations with visual signals, making it easier to detect momentum shifts. By clearly marking overbought and oversold areas, it helps traders refine entries and exits while reducing noise from a single-period RSI.


