The Bollinger Bands & RSI Indicator MT4 combines two powerful tools—Bollinger Bands and the Relative Strength Index (RSI)—into a single oscillator for MetaTrader 4 (MT4).
By analyzing both price volatility and market momentum at the same time, it helps traders forecast reversals, making it easier to optimize entry and exit points with greater accuracy.

This combination ensures traders don’t just rely on momentum but also consider volatility, giving more reliable reversal signals.
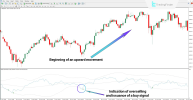
On the BNB/USDT 30-minute chart, when the RSI line touched the lower Bollinger Band, it indicated an oversold condition. The indicator confirmed a trend reversal and generated a buy signal with a green arrow.
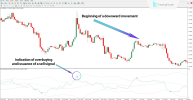
On the USD/CAD 1-hour chart, the RSI line touched the upper Bollinger Band, signaling overbought conditions. The indicator marked this level with a sell signal, helping traders anticipate a potential reversal.
The Bollinger Bands & RSI Indicator offers multiple adjustable parameters:
The Bollinger Bands & RSI Indicator is a dual-function MT4 oscillator that highlights overbought and oversold zones with precise signals. By combining volatility (Bollinger Bands) and momentum (RSI), it becomes a versatile tool suitable for Forex, crypto, stocks, and commodities.
For traders seeking clear entry and exit points, this indicator provides a simple yet effective edge in the market.


By analyzing both price volatility and market momentum at the same time, it helps traders forecast reversals, making it easier to optimize entry and exit points with greater accuracy.
Specifications
- Categories: Oscillators | Bands & Channels MT4 Indicators
- Platform: MetaTrader 4
- Skill Level: Beginner-friendly
- Type: Reversal Indicator ⚡
- Timeframes: Multi-timeframe ⏱️
- Styles: Day Trading | Scalping ⚡ | Swing Trading
- Markets: Forex | Crypto ₿ | Stocks | Commodities ️
- Download: https://cdn.tradingfinder.com/file/514751/bollinger-bands-rsi-mt4-by-tflab.zip

How It Works
- ✅ RSI touches the lower band → Market is oversold, a buy signal (green arrow) appears.
- ❌ RSI touches the upper band → Market is overbought, a sell signal (red arrow) is issued.
This combination ensures traders don’t just rely on momentum but also consider volatility, giving more reliable reversal signals.
Buy Signal Example
On the BNB/USDT 30-minute chart, when the RSI line touched the lower Bollinger Band, it indicated an oversold condition. The indicator confirmed a trend reversal and generated a buy signal with a green arrow.
Sell Signal Example
On the USD/CAD 1-hour chart, the RSI line touched the upper Bollinger Band, signaling overbought conditions. The indicator marked this level with a sell signal, helping traders anticipate a potential reversal.
⚙️ Settings
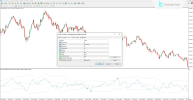
The Bollinger Bands & RSI Indicator offers multiple adjustable parameters:
- RSI Period → RSI calculation length
- RSI Price → Price type used for RSI (close, open, etc.)
- BB Periods → Number of candles for Bollinger Bands
- BB Deviation → Standard deviation for bands
- BB Shift → Offset of Bollinger Bands on chart
- Alerts & Notifications → Enable alerts, email, push notifications, and customize alert messages
✅ Conclusion
The Bollinger Bands & RSI Indicator is a dual-function MT4 oscillator that highlights overbought and oversold zones with precise signals. By combining volatility (Bollinger Bands) and momentum (RSI), it becomes a versatile tool suitable for Forex, crypto, stocks, and commodities.
For traders seeking clear entry and exit points, this indicator provides a simple yet effective edge in the market.


