The Bollinger Bands RSI Indicator in MT5 combines the analytical power of Bollinger Bands and the Relative Strength Index (RSI) to deliver a dynamic oscillator capable of identifying market reversals with precision. By analyzing both price volatility and trend momentum, it helps traders pinpoint accurate entry and exit points, reducing false signals and enhancing timing efficiency.
Specification Table – Bollinger Bands RSI Oscillator
You can download it from this link: https://cdn.tradingfinder.com/file/514796/bollinger-bands-rsi-mt5-by-tflab.zip

✨ How the Bollinger Bands RSI Works
When the RSI line touches the lower Bollinger Band, the indicator identifies oversold conditions and displays a green arrow, signaling a potential buy opportunity.
Conversely, when the RSI line hits the upper band, it reflects overbought conditions, prompting a red arrow to indicate a sell signal. ❤️
Example – Buy Signal (GBP/USD 1H):
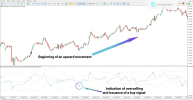
In the GBP/USD chart on the 1-hour timeframe, when the RSI line reaches the lower band, the indicator detects an oversold zone and issues a buy alert marked by a green arrow — signaling a probable upward reversal.
Example – Sell Signal (USD/JPY 30M):
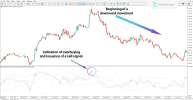
On the USD/JPY 30-minute chart, the RSI line touches the upper band, signaling overbought conditions. The indicator responds with a red arrow, marking an ideal point to sell before a potential downtrend.
⚙️ Settings & Customization
✅ Conclusion
The Bollinger Bands RSI Oscillator smartly merges volatility analysis with momentum measurement to deliver a clear picture of market strength.
It’s a powerful tool for Forex, crypto, and stock traders seeking reliable reversal detection and precise timing.
By visually marking overbought and oversold zones, it simplifies complex analysis — making trading decisions more confident and strategic.


Specification Table – Bollinger Bands RSI Oscillator
- Indicator Categories:
Oscillators MT5 Indicators
Bands & Channels MT5 Indicators
- Platforms:
MetaTrader 5 Indicators
- Trading Skills:
Elementary
- Indicator Types:
Reversal MT5 Indicators
- Timeframe:
Multi-Timeframe MT5 Indicators
- Trading Style:
Swing Trading MT5 Indicators
Scalper MT5 Indicators
Day Trading MT5 Indicators
- Trading Instruments:
Forex MT5 Indicators
Crypto MT5 Indicators
Stock MT5 Indicators
You can download it from this link: https://cdn.tradingfinder.com/file/514796/bollinger-bands-rsi-mt5-by-tflab.zip

✨ How the Bollinger Bands RSI Works
When the RSI line touches the lower Bollinger Band, the indicator identifies oversold conditions and displays a green arrow, signaling a potential buy opportunity.
Conversely, when the RSI line hits the upper band, it reflects overbought conditions, prompting a red arrow to indicate a sell signal. ❤️
Example – Buy Signal (GBP/USD 1H):
In the GBP/USD chart on the 1-hour timeframe, when the RSI line reaches the lower band, the indicator detects an oversold zone and issues a buy alert marked by a green arrow — signaling a probable upward reversal.
Example – Sell Signal (USD/JPY 30M):
On the USD/JPY 30-minute chart, the RSI line touches the upper band, signaling overbought conditions. The indicator responds with a red arrow, marking an ideal point to sell before a potential downtrend.
⚙️ Settings & Customization
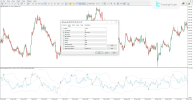
- RSI Period: Sets the calculation period for RSI
- RSI Price: Determines which price (Close, Open, etc.) is used
- BB Periods: Defines the number of bars for Bollinger Bands calculation
- BB Deviation: Adjusts the standard deviation for band width
- BB Shift: Shifts bands relative to the chart
- ALERT: Enables in-platform alerts
- EMAIL: Sends signal alerts via email
- NOTIFICATION: Push notifications on signal trigger
- MESSAGE_TIMEOUT: Duration of on-screen alerts
- MESSAGE_SUBJECT: Custom title for alert notifications
✅ Conclusion
The Bollinger Bands RSI Oscillator smartly merges volatility analysis with momentum measurement to deliver a clear picture of market strength.
It’s a powerful tool for Forex, crypto, and stock traders seeking reliable reversal detection and precise timing.
By visually marking overbought and oversold zones, it simplifies complex analysis — making trading decisions more confident and strategic.


