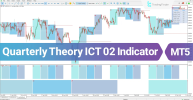
The Quarterly Theory ICT 02 Indicator in MT5 is a specialized analytical tool built on ICT trading concepts and fractal time structure. By dividing market activity into structured cycles, it identifies recurring phases of price behavior and highlights the underlying rhythm of the market.
Each cycle is segmented into four stages (Q1, Q2, Q3, Q4), and traders can display these phases across multiple timeframes — from micro and intraday cycles to daily, weekly, and yearly structures. This systematic segmentation helps traders track whether the market is in accumulation, expansion, distribution, or continuation phases.

At the heart of this tool lies the concept of the True Open — the genuine starting price of a new cycle, which appears at the beginning of Q2.
This level serves as a reference point for market orientation:
The indicator automatically plots this level on the chart as a horizontal line, ensuring traders can clearly identify directional bias at any moment.
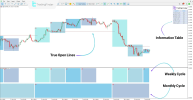
On the USD/JPY chart, price stabilizing above the True Open within Q2 and Q3 confirms buyer control. As long as price holds above this benchmark, bullish continuation remains the dominant expectation.
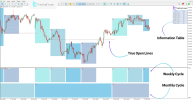
In the EUR/USD H1 chart, price closing and holding below the True Open reflects distribution and strong selling momentum. Until price reclaims this level, bearish sentiment is likely to prevail.
The Quarterly Theory ICT 02 Indicator provides flexible customization to adapt to different trading approaches:
True Open Display
Quarter Cycle Options
The Quarterly Theory ICT 02 Indicator is more than a timing tool — it introduces structured cycle analysis into trading decisions. By pinpointing the True Open, it provides traders with a reliable benchmark for confirming bias and anticipating market direction.
Whether applied to scalping, day trading, or swing setups, this tool equips traders with a disciplined ICT-based method for understanding where the market is within its cycle and how to position accordingly.


Each cycle is segmented into four stages (Q1, Q2, Q3, Q4), and traders can display these phases across multiple timeframes — from micro and intraday cycles to daily, weekly, and yearly structures. This systematic segmentation helps traders track whether the market is in accumulation, expansion, distribution, or continuation phases.
Specifications – Quarterly Theory ICT 02 True Open Indicator
- Indicator Categories: Smart Money MT5 Indicators, ICT MT5 Indicators, Trading Assist MT5 Indicators
- Platforms: MetaTrader 5
- Skill Level: Advanced
- Indicator Type: Reversal / Market Cycle Indicator
- Timeframes: Multi-Timeframe (Micro to Yearly)
- Trading Styles: Scalping, Day Trading, Swing Trading
- Markets: Forex, Crypto, Stocks
- Download: https://cdn.tradingfinder.com/file/493105/quarterly-theory-ict-02-true-open-mt5-by-tflab.zip

Key Feature: The "True Open"
At the heart of this tool lies the concept of the True Open — the genuine starting price of a new cycle, which appears at the beginning of Q2.
This level serves as a reference point for market orientation:
- Above True Open → signals bullish bias, confirming buyers’ dominance.
- Below True Open → signals bearish bias, reflecting stronger selling pressure.
The indicator automatically plots this level on the chart as a horizontal line, ensuring traders can clearly identify directional bias at any moment.
Trading Applications
Bullish Conditions
On the USD/JPY chart, price stabilizing above the True Open within Q2 and Q3 confirms buyer control. As long as price holds above this benchmark, bullish continuation remains the dominant expectation.
Bearish Conditions
In the EUR/USD H1 chart, price closing and holding below the True Open reflects distribution and strong selling momentum. Until price reclaims this level, bearish sentiment is likely to prevail.
Indicator Settings
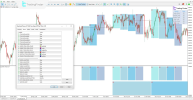
The Quarterly Theory ICT 02 Indicator provides flexible customization to adapt to different trading approaches:
True Open Display
- TRUE_OPEN_MICRO → Micro cycles
- TRUE_OPEN_MIN90 → 90-minute cycles
- TRUE_OPEN_DAILY → Daily cycles
- TRUE_OPEN_WEEKLY → Weekly cycles
- TRUE_OPEN_MONTHLY → Monthly cycles
- TRUE_OPEN_YEARLY → Yearly cycles
- Custom color options for each cycle
Quarter Cycle Options
- MICRO_QUARTERS → Q1–Q4 for micro cycles
- MIN_90_QUARTERS → Q1–Q4 for 90-min cycles
- DAILY / WEEKLY / MONTHLY / YEARLY_QUARTERS → Full segmentation across all higher cycles
- DISPLAY_LABELS → Shows Q1–Q4 labels directly on the chart
- DISPLAY_TABLE → Summarizes cycle status in a visual table
- SUBPANEL_QUARTER_TOP / SUBPANEL_QUARTER_BOTTOM → Define cycle display priority
- UTC_TIME_OFFSET_HOURS → Aligns indicator cycles with broker/market time
- HISTORY_LIMIT → Sets number of historical candles for display
Conclusion
The Quarterly Theory ICT 02 Indicator is more than a timing tool — it introduces structured cycle analysis into trading decisions. By pinpointing the True Open, it provides traders with a reliable benchmark for confirming bias and anticipating market direction.
Whether applied to scalping, day trading, or swing setups, this tool equips traders with a disciplined ICT-based method for understanding where the market is within its cycle and how to position accordingly.


