The Quarterly Theory ICT 03 Indicator MT5 is crafted based on the ICT trading methodology and delivers trading signals using the Precision Swing Points pattern.
This indicator analyzes the candle closings of two or three correlated instruments, identifying directional discrepancies between them. It highlights the strengths or weaknesses of the current market trend by detecting divergence or convergence.
A real-time table is also included, which displays the divergence status between the selected symbols for easy monitoring.
Specifications of Quarterly Theory ICT 03 Indicator

Overview of the Indicator
The Precision Swing Point pattern consists of three consecutive candles, focusing primarily on the middle candle.
Buy Signal Example
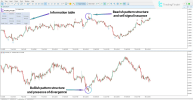
In the example chart, GBP/USD is the main symbol, and USD/JPY is the correlated symbol.
GBP/USD forms a bullish pattern, whereas USD/JPY shows a bearish one. This mismatch indicates a positive divergence, prompting a buy signal on GBP/USD.
Sell Signal Example
Using USD/CAD as the main symbol and AUD/USD as the correlated symbol:
A bearish pattern appears on USD/CAD, while AUD/USD shows a bullish pattern. This contradiction signals a negative divergence and a weakening bullish trend, resulting in a sell signal.
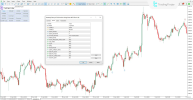
Indicator Settings
Key customizable options include:
Conclusion
The Quarterly Theory ICT 03 Indicator is an advanced tool designed to identify market turning points by detecting divergences among two or three correlated symbols using the three-candle Precision Swing Points pattern.
It generates buy or sell signals after the third candle closes and offers a real-time visual table to monitor divergence and candlestick statuses on the chart, enhancing traders’ decision-making processes.


This indicator analyzes the candle closings of two or three correlated instruments, identifying directional discrepancies between them. It highlights the strengths or weaknesses of the current market trend by detecting divergence or convergence.
A real-time table is also included, which displays the divergence status between the selected symbols for easy monitoring.
- Categories:
- Pivot Points & Fractals
- Signal & Forecast
- ICT Trading Style
- Platform: MetaTrader 5
- Skill Level: Advanced traders
- Indicator Type: Reversal signals
- Timeframe: Multi-timeframe
- Trading Style: Swing trading, scalping, day trading
- Instruments: Forex, cryptocurrencies, stocks
- Download Link: https://cdn.tradingfinder.com/file/...y-ict-03-precision-swing-points-mt5-tflab.zip

The Precision Swing Point pattern consists of three consecutive candles, focusing primarily on the middle candle.
- When the middle candle of the main symbol closes bearish, but the corresponding candle in the correlated symbol closes bullish, this indicates a positive divergence, triggering a buy signal.
- Conversely, if the middle candle in the main symbol is bullish while the correlated symbol's candle is bearish, this represents a negative divergence, resulting in a sell signal.
In the example chart, GBP/USD is the main symbol, and USD/JPY is the correlated symbol.
GBP/USD forms a bullish pattern, whereas USD/JPY shows a bearish one. This mismatch indicates a positive divergence, prompting a buy signal on GBP/USD.
Using USD/CAD as the main symbol and AUD/USD as the correlated symbol:
A bearish pattern appears on USD/CAD, while AUD/USD shows a bullish pattern. This contradiction signals a negative divergence and a weakening bullish trend, resulting in a sell signal.
Key customizable options include:
- MODE: Choose whether to compare two or three symbols
- SYMBOL2 / SYMBOL3: Select correlated symbols
- ZIGZAG_PERIOD & ZIGZAG_BACKSTEP: Parameters for ZigZag line calculation
- PATTERN_METHOD: Defines candlestick pattern recognition type
- PINBAR_RATIO: Threshold for valid pin bar detection
- FILTER_PRECISION_SWING_POINT: Filter to show only precise patterns
- USE_TREND: Show signals aligned with the main trend direction
- ALERT / EMAIL / NOTIFICATION: Enable alerts and notifications
- SIGNAL_TIMEOUT_BARS: Duration signals stay visible
- DISPLAY_ZIGZAG / DISPLAY_TABLE / DISPLAY_CORRELATION: Toggle visualization of ZigZag lines, divergence tables, and correlation info
- HISTORY_LIMIT: Number of past candles analyzed
The Quarterly Theory ICT 03 Indicator is an advanced tool designed to identify market turning points by detecting divergences among two or three correlated symbols using the three-candle Precision Swing Points pattern.
It generates buy or sell signals after the third candle closes and offers a real-time visual table to monitor divergence and candlestick statuses on the chart, enhancing traders’ decision-making processes.


