M
mjackson
Guest
For those who want to find correlation between markets this indicator might help...
Attached File(s)
-
OverLayChart.mq4 8.7 KB · Views: 124

Yeah, it can be done. But it first needs to be converted to MT5 to change the plot type to bars. Unfortunately, I will not have time for that until the end of the month.
Feel free to try it.
By the way, how do you use it? Seems rather pointless.
Why not just switch between two charts? The overlay is quite misguiding as it scales the added chart to be visible instead of to be comparable with the main chart.
I don't think it is possible to make bar chart indicator in MT4. Bar chart plot were introduced in MT5.
What do you mean by "more bars"?
Everyone is not the same ...For me is much easier to see correlation of markets on this way with Overlay chart instead to imagine in different time frames. Bars are matching in each time frame and have each scale...I do not see any misguiding. Indicator serve for what is intended...Knowing correlation trader cane time trading...
More bars means to add more bars on overlay chart to the left...to have 500 at least or to be customisable...
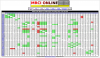
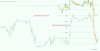
As you can see on pictures on M version there is scale for Overlayed chart ( in this case EURUSD) on MT5 version there is no any scale. Can you put scale on overlayed and main charts please?
Are you going to add option to have candles or bars for Overlayed chart, because in that case initial version stay intact?
Yes, each chart has its own scale, but placing them on the same screen makes them appear comparable when in fact they are not.
No bars beyond the visible screen for this indicator. It would be a hell to code the scaling algorithm for that.
Done.
Done.
0 errors 19 warnings ? possible lost of data...implicit conversion from number to string...
Something like "look back" then add number of bars...? No? OK. Scale? Well how was done in MT4? It is very short program. More important was number of bars but ....OK.
Don't mind those warnings.
The OverLayChart.mq4 that you've attached does not show bars beyond the first screen. Do you have the one that does? If so, I could have a look at it and perhaps convert that feature.
Well, look the picture there is scale!!! Question is how to change color of it? It is not related to color of grids, I tried that ...In MT4 there is option to change color of that scale but it is related to color of Grid...In Mt45 that is not the case....So you will figure it out , Right?
And one more important thing to add: SubSymbol to have pull down menu like you did it for "DrawType" ...it will be all symbols from "Market Watch " list...It is easier to pick symbol from list then to type it....
...No idea how to do that.
I tried to use the OverlayChary indicator in an expert advisor, and got an error "zero divide".
How to mod the code to make it not have any zero divide?
Thank you!
I tried to use the OverlayChary indicator in an expert advisor, and got an error "zero divide".
How to mod the code to make it not have any zero divide?
Thank you!
Is there anyway to make it run a lot more faster with strategy tester?
i.e. I only need the value of OverlayChart[0].
It was presently 4 hours for 1 month of tick data.
Unrelated question, how do I make use of Core 1 and Core 2 at the same time?
Do you need any drawing at all? If not, then why not just use the price of the asset you try overlay directly without this indicator?
We use essential cookies to make this site work, and optional cookies to enhance your experience.