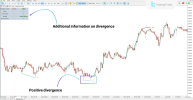
The OBV Divergence Indicator for the MetaTrader 5 platform is a volume-based analysis tool designed. It detects inconsistencies between price movement and trading volume, providing early warnings of potential market reversals. Using the On-Balance Volume (OBV) method, it marks bullish divergences with green lines and bearish divergences with red lines directly on the chart.
Specifications
Category: Volume, Signal & Forecast, Trading Assist
️ Platform: MetaTrader 5
Skill Level: Intermediate
Type: Reversal Indicator
⏳ Timeframe: Multi-Timeframe
⚡ Trading Styles: Swing Trading, Scalping, Day Trading
Markets: Forex, Crypto, Stocks, Commodities, Indices
Download: https://cdn.tradingfinder.com/file/477376/obv-divergence-mt5-by-tflab.zip

Core Functions
Beyond plotting divergence lines, this indicator also features an on-chart data table that provides valuable trade insights:
Trading Applications
A bullish divergence often signals growing upward momentum, while a bearish divergence can warn of price corrections or downtrends. For example, on a 30-minute EUR/GBP chart, a green divergence line may precede a sustained bullish move, while on a 5-minute EUR/JPY chart, a red divergence line could mark the start of a downward trend.
Customizable Parameters
Why Traders Use It
This indicator blends visual cues with analytical depth, making it an effective tool for identifying reversal areas and improving trade timing. Its combination of chart signals and supportive data helps traders make more informed decisions while managing risk effectively.


Specifications
Category: Volume, Signal & Forecast, Trading Assist
️ Platform: MetaTrader 5
Skill Level: Intermediate
Type: Reversal Indicator
⏳ Timeframe: Multi-Timeframe
⚡ Trading Styles: Swing Trading, Scalping, Day Trading
Markets: Forex, Crypto, Stocks, Commodities, Indices
Download: https://cdn.tradingfinder.com/file/477376/obv-divergence-mt5-by-tflab.zip

Core Functions
Beyond plotting divergence lines, this indicator also features an on-chart data table that provides valuable trade insights:
- Divergence Type: Bullish or bearish signal
- Existence: Confirms if divergence is present
- Consecutive: Number of repeated divergences
- Quality: Strength and reliability of the signal
- Trend Phase Change: Identifies possible trend shifts
Trading Applications
A bullish divergence often signals growing upward momentum, while a bearish divergence can warn of price corrections or downtrends. For example, on a 30-minute EUR/GBP chart, a green divergence line may precede a sustained bullish move, while on a 5-minute EUR/JPY chart, a red divergence line could mark the start of a downward trend.
Customizable Parameters
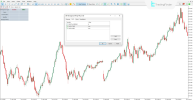
- FRACTAL_PERIODS: Sets the number of candles for detecting swing highs and lows
- SHOW_TABLE: Enables or disables the information table
- SHOW_LABEL: Displays or hides divergence labels on the chart
Why Traders Use It
This indicator blends visual cues with analytical depth, making it an effective tool for identifying reversal areas and improving trade timing. Its combination of chart signals and supportive data helps traders make more informed decisions while managing risk effectively.


