All times are in GMT All events listed are HIGH IMPACT for markets
Week Overview
This week was driven by a broad mix of inflation data, employment figures, and global growth indicators, with strong participation from the U.S., China, and Australia.
Markets focused on:
Inflation pressure signals (U.S. PPI, Japan CPI)
Labour market strength (Australia jobs)
Global growth momentum (China GDP & trade data)
Volatility was spread across Asia → Europe → U.S. sessions, offering multi-session trading opportunities.
️ Monday, 13 April 2026
Time
Country
Event
Forecast
Previous
Impact
12:30
Canada
Building Permits MoM (Feb)
1.5%
4.8%
High
14:00
United States
Existing Home Sales (Mar)
4.01M
4.09M
High
14:00
United States
Existing Home Sales MoM (Mar)
-2.0%
1.7%
High
️ Tuesday, 14 April 2026
Time
Country
Event
Forecast
Previous
Impact
00:30
Australia
Westpac Consumer Confidence (Apr)
-1.8%
1.2%
High
01:30
Australia
NAB Business Confidence (Mar)
-6
-1
High
03:00
China
Exports YoY (Mar)
—
21.8%
High
03:00
China
Imports YoY (Mar)
—
19.8%
High
03:00
China
Balance of Trade (Mar)
$105B
$213.6B
High
12:30
United States
PPI MoM (Mar)
1.3%
0.7%
High
12:30
United States
PPI YoY (Mar)
4.1%
3.4%
High
23:50
Japan
Machinery Orders YoY
15%
13.7%
High
23:50
Japan
Machinery Orders MoM
7%
-5.5%
High
️ Wednesday, 15 April 2026
Time
Country
Event
Forecast
Previous
Impact
09:00
Euro Area
Industrial Production MoM (Feb)
0.8%
-1.5%
High
12:30
United States
NY Empire State Index (Apr)
-3.1
-0.2
High
️ Thursday, 16 April 2026
Time
Country
Event
Forecast
Previous
Impact
01:30
Australia
Employment Change (Mar)
34.2K
48.9K
High
01:30
Australia
Full-Time Employment Change (Mar)
20K
-30.5K
High
01:30
Australia
Unemployment Rate (Mar)
4.2%
4.3%
High
02:00
China
GDP Growth Rate QoQ (Q1)
1.6%
1.2%
High
02:00
China
GDP Growth Rate YoY (Q1)
5.2%
4.5%
High
02:00
China
Industrial Production YoY (Mar)
5.4%
6.3%
High
02:00
China
Unemployment Rate (Mar)
5.2%
5.3%
High
06:00
United Kingdom
Industrial Production MoM (Feb)
0.2%
-0.1%
High
06:00
United Kingdom
GDP MoM (Feb)
0.1%
0.0%
High
06:00
United Kingdom
Balance of Trade (Feb)
-£3.6B
£3.922B
High
12:30
United States
Philadelphia Fed Index (Apr)
17
18.1
High
12:30
United States
Initial Jobless Claims
216K
219K
High
13:15
United States
Industrial Production MoM (Mar)
0.5%
0.2%
High
️ Friday, 17 April 2026
Time
Country
Event
Forecast
Previous
Impact
09:00
Euro Area
Balance of Trade (Feb)
€9.8B
-€1.9B
High
Weekly Conclusion
This week is expected to be driven by a combination of inflation data, labour market releases, and global growth indicators, with key focus on the U.S., China, and Australia.
Early in the week, China’s trade data and GDP figures are likely to set the tone for global risk sentiment, particularly influencing commodities and Asia-session flows. Mid-week, attention will shift to the U.S. PPI data, which will provide important signals on inflation pressures and could shape expectations around monetary policy.
Later in the week, Australia’s employment data and U.S. manufacturing indicators are expected to add further volatility, while Japan’s inflation readings may drive positioning adjustments into the weekly close.
Overall, markets are likely to experience rotating volatility across Asia, Europe, and U.S. sessions, offering multiple trading opportunities throughout the week.
Below is an overview of the PPI and Federal Reserve interest rate decision releases, along with a chart illustrating their impact on the XAU/USD pair. The price action reflects the market reaction on 18 March 2026, based on a 5-minute candlestick timeframe.
U.S. wholesale inflation surged in February, with headline PPI rising 0.7% month-on-month and 3.4% annually—well above expectations—while core PPI increased 0.5% MoM and 3.9% YoY, reinforcing broad-based price pressures across both services and goods. The stronger-than-expected data reduced expectations for near-term rate cuts, strengthening the view that the Federal Reserve may keep interest rates higher for longer, particularly as geopolitical tensions continue to push up energy costs and disrupt supply chains. At the same time, the Fed held rates steady at 3.5%–3.75%, maintaining a cautious stance while still projecting gradual rate cuts in 2026 and 2027 as it balances inflation risks against a softening labor market and slowing demand. Although policymakers see current inflation pressures as potentially temporary, elevated uncertainty—especially around geopolitics and energy—has left markets increasingly driven by external factors rather than clear monetary policy direction.
Potential Profit Study:
An entry on XAU/USD at 4901.61 with 1 standard lot would require approximately $980.32 in margin at 1:500 leverage, while at 1:2000 leverage, the margin requirement would decrease to around $245.08.
The move from 4901.61 to the daily low of 4804.65 totaled 96.96 points, translating to a potential profit of approximately $9,696 on a standard lot position.
This week delivered a dense lineup of high-impact economic releases across major economies, with key focus on inflation data, PMI surveys, labor market indicators, and trade balances. These announcements drove expectations around central bank policy paths and provided fresh insight into global economic momentum.
Times in GMT
All events are HIGH IMPACT for traders
Sunday, 19 Apr 2026
Time
Country
Event
Forecast
Previous
Impact
22:45
NZ
Balance of Trade (MAR)
NZ$270M
NZ$257M
High
Monday, 20 Apr 2026
Time
Country
Event
Forecast
Previous
Impact
06:00
DE
PPI YoY (MAR)
-1.8%
-3.3%
High
06:00
DE
PPI MoM (MAR)
0.8%
-0.5%
High
12:30
CA
Inflation Rate YoY (MAR)
2.5%
1.8%
High
12:30
CA
Core Inflation Rate YoY (MAR)
2.4%
2.3%
High
12:30
CA
Core Inflation Rate MoM (MAR)
0.3%
0.4%
High
22:45
NZ
Inflation Rate YoY (Q1)
2.8%
3.1%
High
23:50
JP
Balance of Trade (MAR)
¥470B
¥57.3B
High
23:50
JP
Imports YoY (MAR)
—
10.2%
High
23:50
JP
Exports YoY (MAR)
—
4.2%
High
Tuesday, 21 Apr 2026
Time
Country
Event
Forecast
Previous
Impact
06:00
GB
Unemployment Rate (FEB)
5.3%
5.2%
High
06:00
GB
Employment Change (FEB)
-35K
84K
High
06:00
CH
Balance of Trade (MAR)
CHF4.5B
CHF4.4B
High
09:00
DE
ZEW Economic Sentiment Index (APR)
-10
-0.5
High
12:30
US
Retail Sales MoM (MAR)
0.4%
0.6%
High
Wednesday, 22 Apr 2026
Time
Country
Event
Forecast
Previous
Impact
06:00
GB
Core Inflation Rate YoY (MAR)
2.8%
3.2%
High
06:00
GB
Core Inflation Rate MoM (MAR)
0.2%
0.6%
High
06:00
GB
Inflation Rate YoY (MAR)
3.4%
3.0%
High
23:00
AU
S&P Global Services PMI Flash (APR)
46.0
46.3
High
23:00
AU
S&P Global Composite PMI Flash (APR)
46.3
46.6
High
23:00
AU
S&P Global Manufacturing PMI Flash (APR)
49.0
49.8
High
Thursday, 23 Apr 2026
Time
Country
Event
Forecast
Previous
Impact
00:30
JP
Manufacturing PMI Flash (APR)
50.1
51.6
High
00:30
JP
Composite PMI Flash (APR)
51.4
53.0
High
00:30
JP
Services PMI Flash (APR)
52.0
53.4
High
07:15
FR
Composite PMI Flash (APR)
48.2
48.8
High
07:15
FR
Services PMI Flash (APR)
48.0
48.8
High
07:15
FR
Manufacturing PMI Flash (APR)
50.5
50.0
High
07:30
DE
Composite PMI Flash (APR)
51.4
51.9
High
07:30
DE
Services PMI Flash (APR)
50.5
50.9
High
07:30
DE
Manufacturing PMI Flash (APR)
52.5
52.2
High
08:00
EA
Composite PMI Flash (APR)
50.2
50.7
High
08:00
EA
Services PMI Flash (APR)
49.7
50.2
High
08:00
EA
Manufacturing PMI Flash (APR)
52.0
51.6
High
08:30
GB
Services PMI Flash (APR)
51.4
50.5
High
08:30
GB
Manufacturing PMI Flash (APR)
51.0
51.0
High
08:30
GB
Composite PMI Flash (APR)
51.6
50.3
High
12:30
US
Initial Jobless Claims
218K
207K
High
12:30
CA
PPI MoM (MAR)
1.3%
0.4%
High
12:30
CA
PPI YoY (MAR)
6.5%
5.4%
High
13:45
US
Composite PMI Flash (APR)
49.9
50.3
High
13:45
US
Manufacturing PMI Flash (APR)
52.0
52.3
High
13:45
US
Services PMI Flash (APR)
49.6
49.8
High
23:30
JP
Inflation Rate YoY (MAR)
1.5%
1.3%
High
23:30
JP
Core Inflation Rate YoY (MAR)
2.0%
1.6%
High
Friday, 24 Apr 2026
Time
Country
Event
Forecast
Previous
Impact
06:00
GB
Retail Sales MoM (MAR)
0.2%
-0.4%
High
08:00
DE
Ifo Business Climate (APR)
85.4
86.4
High
12:30
CA
Retail Sales MoM (Prel, MAR)
0.2%
0.9%
High
Week Summary
High-impact economic releases were closely monitored throughout the week as they played a key role in shaping market sentiment and short-term price action. With major updates on inflation, growth, and business activity, markets reacted quickly to any deviations from expectations.
Periods of heightened volatility were most evident around clustered releases—particularly PMI data and inflation figures—where traders adjusted positions rapidly as new information was priced in across currencies, commodities, and indices.
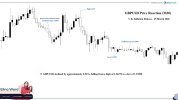
Below is an overview of the U.K. inflation release, along with a chart showing its impact on GBP/USD, with price action reflecting market reaction on 25 March 2026 using a 30-minute candlestick timeframe.
U.K. Inflation Release - 25 March 2026
The Bank of England is expected to hold interest rates steady through 2026 despite inflation remaining around 3%, as current energy prices are unlikely to push inflation high enough to justify further tightening. While markets are pricing in multiple rate hikes, this is seen as overstated due to liquidity distortions, with policymakers requiring a more significant surge—such as oil sustaining around $120 per barrel or gas above €70/MWh—to consider hikes. Inflation is projected to peak between 3.5% and 4% in autumn before easing, with near-term declines expected due to base effects and delayed energy price adjustments. Given a fragile labor market and evidence that firms are absorbing higher costs through job cuts rather than price increases, the central bank’s base case remains a prolonged pause, with potential rate cuts resuming in early 2027.
Potential Profit Study:
An entry on GBP/USD at 1.34272 with 1 standard lot required approximately $268.54 in margin at 1:500 leverage, while at 1:2000 leverage, the margin requirement decreased to around $67.14.
The move from 1.34272 to the session low of 1.33580 totaled 69.2 pips, resulting in a potential profit of approximately $692 on a standard lot position.
High-Impact Economic Calendar – 27 April – 1 May 2026
Week Overview
This week will be driven by a combination of central bank decisions, inflation data, and key U.S. macroeconomic releases, creating a high-volatility environment across global markets. Traders will focus on interest rate guidance, growth indicators, and price stability metrics, which will play a major role in shaping short-term market direction."
Times in GMT
All events are HIGH IMPACT for traders
️ Monday, 27 Apr 2026
Time
Country
Event
Forecast
Previous
Impact
06:00
DE
GfK Consumer Confidence (MAY)
-30
-28
High
14:30
US
Dallas Fed Manufacturing Index (APR)
-0.8
-0.2
High
23:30
JP
Unemployment Rate (MAR)
2.7%
2.6%
High
️ Tuesday, 28 Apr 2026
Time
Country
Event
Forecast
Previous
Impact
03:00
JP
BoJ Interest Rate Decision
0.75%
0.75%
High
14:00
US
CB Consumer Confidence (APR)
91.0
91.8
High
14:00
US
Richmond Fed Manufacturing Index (APR)
6
0
High
️ Wednesday, 29 Apr 2026
Time
Country
Event
Forecast
Previous
Impact
01:30
AU
Inflation Rate YoY (MAR)
4.8%
3.7%
High
12:00
DE
Inflation Rate MoM Prel (APR)
1.0%
1.1%
High
12:00
DE
Inflation Rate YoY Prel (APR)
3.3%
2.7%
High
12:30
US
Housing Starts MoM (Feb)
-5.2%
7.2%
High
12:30
US
Housing Starts MoM (Mar)
-0.7%
N/A
High
12:30
US
Building Permits MoM (Mar)
-0.7%
N/A
High
12:30
US
Building Permits MoM (Feb)
-1.9%
-4.7%
High
12:30
US
Durable Goods Orders MoM
1.3%
-1.4%
High
13:45
CA
BoC Monetary Policy Report
—
—
High
13:45
CA
BoC Interest Rate Decision
2.25%
2.25%
High
18:00
US
Fed Interest Rate Decision
3.75%
3.75%
High
18:30
US
Fed Press Conference
—
—
High
23:50
JP
Industrial Production MoM (MAR)
1.1%
-2.0%
High
23:50
JP
Retail Sales MoM (MAR)
0.8%
-2.0%
High
️ Thursday, 30 Apr 2026
Time
Country
Event
Forecast
Previous
Impact
01:30
CN
NBS Manufacturing PMI (APR)
50.6
50.4
High
01:45
CN
Caixin Manufacturing PMI (APR)
50.7
50.8
High
05:00
JP
Consumer Confidence (APR)
31.0
33.3
High
05:30
FR
GDP Growth Rate QoQ Prel (Q1)
0.0%
0.2%
High
05:30
FR
GDP Growth Rate YoY Prel (Q1)
1.0%
1.2%
High
06:00
DE
Retail Sales MoM (MAR)
0.5%
-0.6%
High
06:45
FR
PPI YoY (MAR)
-1.0%
-2.4%
High
06:45
FR
PPI MoM (MAR)
0.8%
-0.2%
High
06:45
FR
Inflation Rate YoY Prel (APR)
1.8%
1.7%
High
06:45
FR
Inflation Rate MoM Prel (APR)
0.7%
1.0%
High
07:55
DE
Unemployment Rate (APR)
6.3%
6.3%
High
08:00
DE
GDP Growth Rate QoQ Flash (Q1)
0.1%
0.3%
High
08:00
DE
GDP Growth Rate YoY Flash (Q1)
0.5%
0.4%
High
09:00
EA
Core Inflation Rate YoY Flash (APR)
2.4%
2.3%
High
09:00
EA
Inflation Rate YoY Flash (APR)
2.9%
2.6%
High
09:00
EA
Inflation Rate MoM Flash (APR)
1.0%
1.3%
High
09:00
EA
GDP Growth Rate QoQ Flash (Q1)
0.0%
0.2%
High
09:00
EA
GDP Growth Rate YoY Flash (Q1)
0.8%
1.2%
High
09:00
EA
Unemployment Rate
6.2%
6.2%
High
11:00
GB
BoE Interest Rate Decision
3.75%
3.75%
High
12:15
EA
Deposit Facility Rate
2.0%
2.0%
High
12:15
EA
ECB Interest Rate Decision
2.15%
2.15%
High
12:30
US
GDP Growth Rate QoQ (Adv Q1)
1.5%
0.5%
High
12:30
US
Core PCE Price Index YoY
3.1%
3.0%
High
12:30
US
PCE Price Index YoY
3.3%
2.8%
High
12:30
US
Core PCE Price Index MoM
0.3%
0.4%
High
12:30
US
Personal Income MoM
0.4%
-0.1%
High
12:30
US
Personal Spending MoM
0.4%
0.4%
High
12:30
US
Initial Jobless Claims
219K
214K
High
12:30
CA
GDP MoM (FEB)
0.2%
0.1%
High
12:45
EA
ECB Press Conference
—
—
High
13:45
US
Chicago PMI (APR)
51
52.8
High
22:45
NZ
Building Permits MoM (MAR)
-0.4%
2.7%
High
️ Friday, 1 May 2026
Time
Country
Event
Forecast
Previous
Impact
01:30
AU
PPI YoY (Q1)
4.1%
3.5%
High
06:30
CH
Retail Sales MoM (MAR)
0.3%
0.4%
High
14:00
US
ISM Manufacturing PMI (APR)
52.5
52.7
High
Week Summary
Week Overview This week is set to be driven by a powerhouse combination of central bank decisions, inflation data, and key U.S. macroeconomic releases. This setup creates a high-volatility environment across global markets. Traders will focus heavily on interest rate guidance, growth indicators, and price stability metrics, which will play a major role in shaping market direction through May.
Below is an overview of the U.S. Federal Funds Rate release on March 18, 2026, along with a chart showing its impact on GBP/USD, with price action reflecting market reaction using a 5-minute candlestick timeframe.
U.S. Feds Funds Rate - 18th March 2026
On March 18, 2026, the U.S. Federal Reserve held interest rates steady at 3.50%–3.75% while signaling higher inflation expectations and maintaining a cautious outlook amid heightened uncertainty driven by the U.S.–Israel war with Iran. Policymakers still projected one rate cut in 2026, but markets pushed expectations for easing further out to 2027 as rising oil prices added inflationary pressure. Fed Chair Jerome Powell emphasized the unpredictable economic impact of the conflict, noting that higher energy costs could lift inflation but with uncertain duration and scale. The situation escalated further with Iranian missile strikes damaging energy infrastructure in Qatar following attacks on Iran’s South Pars gas field, contributing to a surge in oil prices, which closed about 4% higher. Despite these pressures, the Fed maintained its broader outlook, expecting inflation to gradually decline toward target levels by 2027 while balancing risks between persistent inflation and potential labor market weakness.
Potential Profit Study:
An entry on GBP/USD at 1.1.33506 with 1 standard lot required approximately $267.01 in margin at 1:500 leverage, while at 1:2000 leverage, the margin requirement decreased to around $66.75.
The move from 1.33506 to the session low of 1.32516 totalled 99.0 pips, resulting in a potential profit of approximately $990 on a standard lot position.
This week centered on major labor market data, central bank policy, trade balances, and growth indicators, with particular attention on the RBA Interest Rate Decision, U.S. labor data, and Non-Farm Payrolls. Traders monitored these releases closely as they shaped expectations for monetary policy, economic momentum, and broader market sentiment.
Times in GMT
All events are HIGH IMPACT for traders
Monday, 4 May 2026
Time
Country
Event
Forecast
Previous
Impact
01:30
AU
Building Permits MoM Prel (MAR)
-6.0%
29.7%
High
14:00
US
Factory Orders MoM (MAR)
0.8%
0.0%
High
Tuesday, 5 May 2026
Time
Country
Event
Forecast
Previous
Impact
01:30
AU
Household Spending YoY (MAR)
5.1%
4.6%
High
04:30
AU
RBA Interest Rate Decision
4.35%
4.1%
High
06:30
CH
Inflation Rate YoY (APR)
0.8%
0.3%
High
12:30
US
Balance of Trade (MAR)
-$61.4B
-$57.3B
High
12:30
CA
Balance of Trade (MAR)
-C$3.4B
-C$5.74B
High
14:00
US
New Home Sales (MAR)
640K
—
High
14:00
US
New Home Sales MoM (FEB)
3.9%
-17.6%
High
14:00
US
JOLTS Job Openings (MAR)
7.0M
6.882M
High
14:00
US
New Home Sales MoM (MAR)
4.9%
—
High
14:00
US
New Home Sales (FEB)
610K
587K
High
14:00
US
ISM Services PMI (APR)
53.7
54.0
High
22:45
NZ
Unemployment Rate (Q1)
5.3%
5.4%
High
Wednesday, 6 May 2026
Time
Country
Event
Forecast
Previous
Impact
06:45
FR
Industrial Production MoM (MAR)
0.2%
-0.7%
High
09:00
EA
PPI MoM (MAR)
2.0%
-0.7%
High
09:00
EA
PPI YoY (MAR)
0.6%
-3.0%
High
12:15
US
ADP Employment Change (APR)
70K
62K
High
14:00
CA
Ivey PMI s.a (APR)
47.0
49.7
High
Thursday, 7 May 2026
Time
Country
Event
Forecast
Previous
Impact
01:30
AU
Balance of Trade (MAR)
A$4B
A$5.686B
High
06:00
DE
Factory Orders MoM (MAR)
1.1%
0.9%
High
06:45
FR
Balance of Trade (MAR)
-€5.7B
-€5.8B
High
07:00
CH
Unemployment Rate (APR)
3.1%
3.1%
High
09:00
EA
Retail Sales MoM (MAR)
0.4%
-0.2%
High
12:30
US
Initial Jobless Claims (May/02)
215K
189K
High
Friday, 8 May 2026
Time
Country
Event
Forecast
Previous
Impact
06:00
DE
Industrial Production MoM (MAR)
-0.7%
-0.3%
High
06:00
DE
Balance of Trade (MAR)
€14B
€19.8B
High
12:30
US
Unemployment Rate (APR)
4.3%
4.3%
High
12:30
US
Non-Farm Payrolls (APR)
95K
178K
High
12:30
CA
Full-Time Employment Change (APR)
18K
-1.1K
High
12:30
CA
Unemployment Rate (APR)
6.7%
6.7%
High
12:30
CA
Employment Change (APR)
20K
14.1K
High
14:00
US
Michigan Consumer Sentiment Prel (MAY)
50.0
49.8
High
Planning ahead for high-impact economic releases can help prepare for potential volatility before it reaches the market. By tracking the week’s key announcements in advance, it becomes easier to anticipate major market-moving moments, refine strategy, manage risk more effectively, and stay ready for shifts across currencies, commodities, stocks, and indices before the week unfolds.
Below is an overview of the April 3, 2026 Nonfarm Payrolls release, accompanied by a GBP/USD chart illustrating the market’s reaction through 5-minute candlestick price action.
Non-Farm Payrolls Release - 3 April 2026
U.S. nonfarm payrolls rose by 178,000 in March, significantly beating expectations of 59,000 and rebounding sharply from February’s revised 133,000 decline, signaling that the labor market remains resilient despite broader signs of slowing growth. The unemployment rate edged down to 4.3%, though the decline was largely driven by a sharp drop in labor force participation rather than stronger employment conditions. Wage growth came in softer than expected, with average hourly earnings rising just 0.2% monthly and 3.5% annually—the slowest yearly pace since May 2021—suggesting easing wage inflation pressures. Job gains were led primarily by health care, construction, and transportation, while federal government and financial sectors posted losses. Overall, the report reinforced expectations that the Federal Reserve is likely to remain on hold, as stronger-than-expected hiring offsets labor market weakness concerns, while softer wages and elevated inflation continue to complicate the policy outlook.
Potential Profit Study:
An entry on GBP/USD at 1.1.32255 with 1 standard lot required approximately $264.51 in margin at 1:500 leverage, while at 1:2000 leverage, the margin requirement decreased to around $66.13.
The move from 1.32255 to the session low of 1.31782 totalled 47.3 pips, resulting in a potential profit of approximately $473 on a standard lot position.