


New Murrey Math Levels Indicator for MetaTrader 4
The New Murrey Math Levels Indicator for MT4 applies structured mathematical principles to define price equilibrium zones on the MetaTrader 4 (MT4) platform. It plots a series of predefined horizontal levels that represent critical market boundaries where price reactions frequently occur.
These levels range from +2/8 to -2/8, with each zone serving a specific function—such as dynamic support and resistance, trend continuation checkpoints, or overbought and oversold conditions. By using these levels, traders can more effectively identify high-probability areas for trade entries, exits, and reversals.
Indicator Classification Overview
How the New Murrey Math Levels Indicator Works
The Murrey Math methodology organizes price action into a 13-level framework, allowing traders to evaluate market structure with clarity and consistency. Each level has a distinct role depending on trend direction and momentum.
Key Murrey Math Levels Explained
Indicator Behavior in an Uptrend
In a bullish market structure, when price holds above the 4/8 level, it signals buyer control and positive market equilibrium.
Once price stabilizes above this midpoint:
Indicator Behavior in a Downtrend
In a bearish environment, a break and sustained hold below the 3/8 level confirms seller dominance.
In such conditions:
New Murrey Math Levels Indicator Settings
The indicator includes a simple yet flexible configuration panel:
Final Thoughts
The New Murrey Math Levels Indicator delivers a systematic and disciplined method for identifying support, resistance, and reversal zones using fixed mathematical price levels.
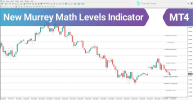


The New Murrey Math Levels Indicator for MT4 applies structured mathematical principles to define price equilibrium zones on the MetaTrader 4 (MT4) platform. It plots a series of predefined horizontal levels that represent critical market boundaries where price reactions frequently occur.
These levels range from +2/8 to -2/8, with each zone serving a specific function—such as dynamic support and resistance, trend continuation checkpoints, or overbought and oversold conditions. By using these levels, traders can more effectively identify high-probability areas for trade entries, exits, and reversals.
Indicator Classification Overview
Feature | Description |
Indicator Categories | Support & Resistance Indicators; Trading Assistance Indicators; Price Levels Indicators |
Platform | MetaTrader 4 |
Skill Level | Intermediate |
Indicator Type | Breakout Indicators; Reversal Indicators |
Timeframes | Multi-Timeframe |
Trading Style | Intraday Trading |
Markets Supported | Forex; Cryptocurrencies; Stocks & Shares; Indices; Commodities |
Down Link |
How the New Murrey Math Levels Indicator Works
The Murrey Math methodology organizes price action into a 13-level framework, allowing traders to evaluate market structure with clarity and consistency. Each level has a distinct role depending on trend direction and momentum.
Key Murrey Math Levels Explained
- 4/8 Level – Market Balance Zone
This is the central equilibrium level where price frequently consolidates or shifts direction. It often acts as a pivot for trend decisions. - 8/8 and 0/8 Levels – Extreme Boundaries
These represent overbought (8/8) and oversold (0/8) market conditions. Price reactions at these levels commonly signal potential reversals. - +2/8 and -2/8 Levels – Extended Range Zones
These levels sit beyond the normal trading range. A sustained move beyond them typically requires strong momentum, confirmation, and volume.
Indicator Behavior in an Uptrend
In a bullish market structure, when price holds above the 4/8 level, it signals buyer control and positive market equilibrium.
Once price stabilizes above this midpoint:
- The next upside objectives typically become 6/8, followed by 8/8
- Pullbacks toward key levels often present potential long entry opportunities
- The overall structure favors trend continuation rather than reversal
Indicator Behavior in a Downtrend
In a bearish environment, a break and sustained hold below the 3/8 level confirms seller dominance.
In such conditions:
- Price frequently targets 2/8, then potentially 0/8
- The 2/8 level acts as a critical decision zone, determining whether selling pressure continues or stalls
- Failed attempts to reclaim higher levels often provide short-selling opportunities
New Murrey Math Levels Indicator Settings
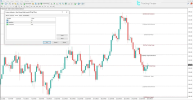
The indicator includes a simple yet flexible configuration panel:
- P – Core calculation parameter used in level generation
- StepBack – Number of historical bars used for level calculation
- Comments – Enables or disables informational messages displayed on the chart
Final Thoughts
The New Murrey Math Levels Indicator delivers a systematic and disciplined method for identifying support, resistance, and reversal zones using fixed mathematical price levels.
- The 4/8 level reflects market equilibrium and directional bias
- The 0/8 and 8/8 levels highlight high-probability reversal zones
- Price interaction with these levels, when combined with trend strength and momentum, offers reliable trade entry and exit opportunities
Attached File(s)
-
 new-murrey-math-levels-mt4-by-tflab.zip 22.2 KB · Views: 0