Need help finding a particular Line Chart that uses Ticks in MT5

I am Groot

Newbie
Feb 19, 2024
3
0
1
66
  • This chart is just a straight forward line chart with no EAs, indicators and no BID/ASK prices.
  • It operates like the basic 1M line chart except it displays, and moves on the Tick.

Several years ago (shortly after MT5 hit the scene) as a newbie I used this chart and had a moderate success with it but stopped trading due to other commitments. Now I would like to start trading again using the chart with the manual strategy I used, with the intention of trying to develop the strategy into an EA.

I would be much appreciative if someone could point me in the direction of this chart, or something very close to it.
 
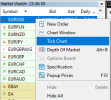
What you describe is just a plain Tick chart with the Ask line turned off. Right-click the trading symbol you are interested in in the Market Watch, choose Tick Chart:

tick-chart.png

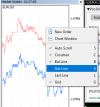
Then right-click on that chart and unselect the Ask Line:
tick-chart-ask-line.png

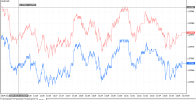
That's it:
large-tick-chart.png
 
Thanks for reply Enivid,
No I don't believe it was just the plain tick chart, one of the reasons for this is I was able to zoom right into the chart to see the ticks as they appeared. The plain tick chart doesn't allow me to zoom in or out.

The chart I'm looking for was a tick chart (but not the built in one), I dont remember if it was a candle chart originally and I changed to Line chart?

Note: it was not an offline chart, it was the main chart.

I don't know if this makes things any clearer.
 
I know it was a few years ago and my memory is terrible, so you could be right about cTrader, I think I did look at it in the past, but can't get it out of my head that it was MT4. All I can think of, is I must have found something that has now been removed for whatever reason?

Anyway thanks for your time, I'm going to revisit cTrader and see if I can recreate the chart