Elliott Wave Analysis by EWF

IIFL Finance (NSE: IIFL) shows a corrective Elliott Wave pattern (2) with key support at ₹370.10. A potential bullish wave (3) rally may follow soon.​

IIFL Finance Ltd (NSE: IIFL) continues to follow a well-defined Elliott Wave structure, suggesting the stock is undergoing a corrective phase before resuming its larger bullish trend. After completing wave (1) at the recent high, the stock is currently in wave (2), which is unfolding as a double three corrective pattern (W)-(X)-(Y).

The initial leg lower, wave W, has already completed, followed by a smaller recovery in wave X. The ongoing decline appears to be part of wave Y, which could ideally extend toward the 1.0 Fibonacci extension level around ₹370.10, marking equal legs before a potential reversal.


Despite this correction, the bigger picture stays bullish. The right-side tag shows a higher probability for upward movement. We do not recommend selling during this pullback. Instead, traders should wait for wave (2) to complete and prepare for a potential wave (3) rally. This next bullish wave can lead to new highs if the structure holds.

The invalidation level for this outlook is ₹279.35. If the price stays above this point, the current decline remains corrective. Pullbacks can then create buying opportunities once signs of a reversal appear.

Summary:​

In summary, IIFL Finance is likely in the final stages of its wave (2) correction within a broader bullish cycle. Traders and investors should stay patient, avoid shorting, and prepare for a possible continuation higher once the corrective structure completes.

Source: https://elliottwave-forecast.com/st...rection-nears-completion-bullish-rally-ahead/
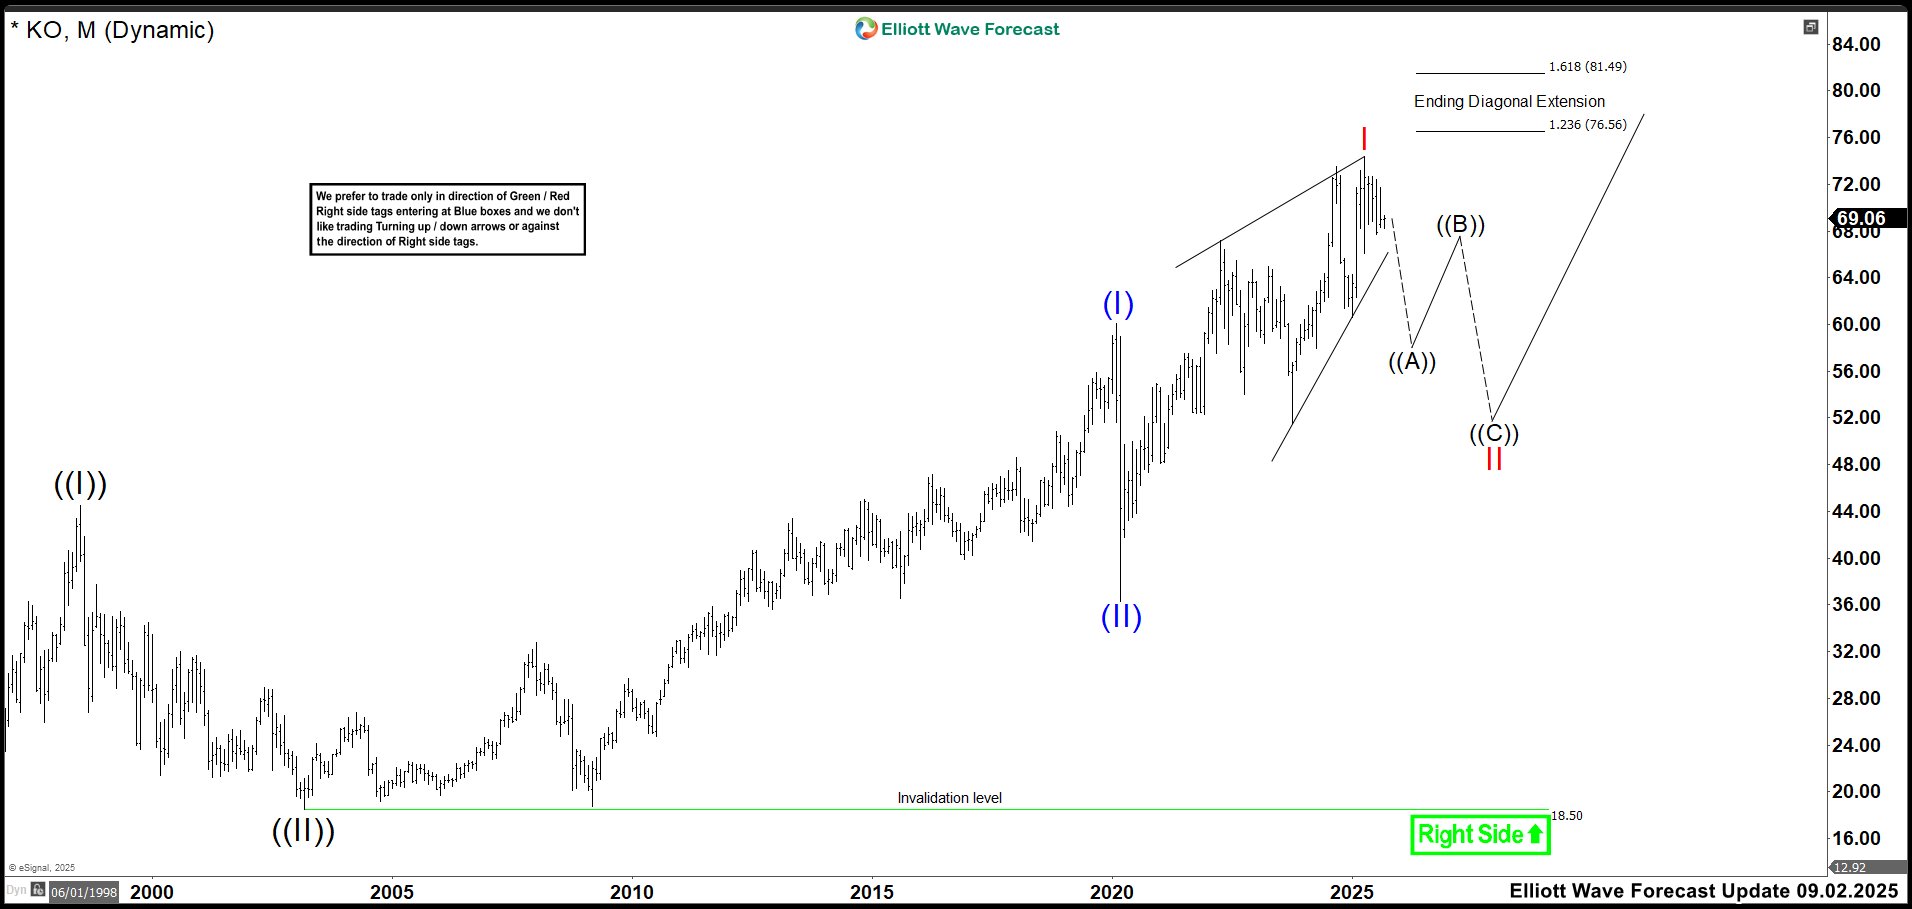
 
In this technical blog, we will look at the past performance of the 1-hour Elliott Wave Charts of Ethereum ticker symbol: ETHUSD. We presented to members at the elliottwave-forecast. In which, the rally from the 09 April 2025 low unfolded as an impulse structure. Showing a higher high sequence favored more upside extension to take place. Therefore, we advised members not to sell the crypto & buy the dips in 3, 7, or 11 swings at the blue box areas. We will explain the structure & forecast below:

Ethereum 1-Hour Elliott Wave Chart From 8.19.2025​

Ethereum Bounces: ETHUSD Reacts Strongly from Key Support Zone

Here’s the 1-hour Elliott wave chart from the 8.19.2025 Asia update. In which, the cycle from the 8.03.2025 low ended in wave 1 at $4788.7 high. Down from there, the ETHUSD made a pullback in wave 2 to correct that cycle. The internals of that pullback unfolded as Elliott wave double three structure where wave ((w)) ended at $4370.9 low. Wave ((x)) bounce ended at $4578.1 high and wave ((y)) managed to reach the blue box area at $4156.2- $3895.3. From there, buyers were expected to appear looking for the next leg higher or for a 3 wave bounce minimum.

Ethereum Latest 1-Hour Elliott Wave Chart From 8.25.2025​

Ethereum Bounces: ETHUSD Reacts Strongly from Key Support Zone

This is the latest 1-hour Elliott wave Chart from the 8.25.2025 London update. In which the ETHUSD is showing a reaction higher taking place, right after ending the double correction within the blue box area. Allowed members to create a risk-free position shortly after taking the long position at the blue box area. Since then the pair has already made a new high above previous wave 1 confirming the next extension higher targeting $5501.5- $5840.7 area higher.

Source: https://elliottwave-forecast.com/bl...nces-ethusd-reacts-strongly-key-support-zone/
 

Raydium (RAYUSD) Elliott Wave analysis indicates Wave II correction is in progress, with a potential bullish Wave III rally expected after reaching the blue box support zone.​

Raydium (RAYUSD) completed a clean five-wave impulse from the January 2023 low, reaching $8.6642. According to Elliott Wave analysis, this move marked the end of Wave I. Since then, the price has turned lower to correct the cycle within Wave II.

The correction is unfolding as a 3, 7, or 11-swing structure. So far, we have already seen five waves down in ((A)). After this drop, Raydium is pulling back in ((B)), where we expect Wave (Y) to complete inside the parallel channel. The channel is drawn from ((A)) to (X) and runs parallel to (W), acting as a guide for the short-term path.

Once Wave (Y) ends, we anticipate another five-wave decline to the blue box area. This zone, based on Fibonacci levels, sits between the 0.5 and 0.618 retracement levels. Buyers are expected to step in here, making this area critical for the next potential rally. From this blue box, a larger bullish Wave III is likely to start. Historically, Wave III tends to be the strongest and fastest wave, often delivering significant upside. As long as Raydium stays above the January 2023 low, the broader bullish view remains valid.

For now, traders should avoid chasing the short-term pullbacks and wait for price action near the blue box support. Once the setup confirms, the Elliott Wave count suggests a strong bullish opportunity ahead.

Source: https://elliottwave-forecast.com/cr...is-wave-ii-correction-approaching-completion/
 
Liquidia Corporation, (LQDA) is a biopharmaceutical company. It develops, manufactures & commercializes various products for unmet patient needs in the United States. It comes under Healthcare sector in Biotechnology Industry & trades as “LQDA” ticker at Nasdaq.

LQDA is showing higher high since August-2021 low & expect short term upside to extend the sequence started from 7.01.2025 low. It favors rally to extend into $28.98 – $39.60 area as 3 swings bounce from August-2021 low before correcting next.

Since inception in weekly, it made all-time high of $38.46 of October-2018 & all-time low of $2.25 low of August-2021. It needs to break out above $38.46 high to confirm the bullish sequence. From 2021 low, it placed (I) impulse at $19.41 high of May-2025 & (II) at $11.85 low of June-2025. Within (I), it placed I at $7.78 high, II as flat at $4.06 low, III at $16.99 high, IV at $8.26 low & V at $19.41 high. While (II) was 3 swing pullbacks that ended in extreme area. It ended a of (II) at $13.94 low, b at $18.60 high & c at $11.85 low as slightly lower below 0.382 Fibonacci retracement of (I). Above $11.85 low, it favors rally in I of (III) approaching towards $28.98 as minimum extension.

LQDA - Elliott Wave Latest Weekly View:​

It placed ((1)) of I at $20.33 high, ((2)) at $16.82 low, ((3)) at $28.00 high & favors pullback in ((4)) correction. It expects ((4)) to end into $25.36 - $23.74 area before final push in ((5)) to finish I. Short term, it expects ((5)) to come with momentum divergence to finish I. But if it managed to erase that, then it can see more upside as the part of ((3)). Since August-2021 low, it shows 3 swings bounce, which either can be impulse or zigzag correction before turn bearish against ATH. So, as long as it holds above 6.30.2025 low, it remains bullish & need to confirm the impulse sequence for further upside. We like to buy the next pullback of II in 3, 7 or 11 swings against 6.30.2025 low.

Source: https://elliottwave-forecast.com/st...da-bullish-sequence-eyes-28-98-next-pullback/
 
Hello everyone! In today’s article, we’ll examine the recent performance of Apple Inc. ($AAPL) through the lens of Elliott Wave Theory. We’ll review how the rally from the August 01, 2025 low unfolded as a 5-wave impulse followed by a 3-swing correction (ABC) and discuss our forecast for the next move. Let’s dive into the structure and expectations for this stock.

5 Wave Impulse Structure + ABC correction​

$GOOGL

$AAPL 1H Elliott Wave Chart 8.21.2025:​

$AAPL

In the 1-hour Elliott Wave count from August 21, 2025, we saw that $AAPL completed a 5-wave impulsive cycle at red 3. As expected, this initial wave prompted a pullback. We anticipated this pullback to unfold in 3 swings and find buyers in the equal legs area between $227.23 and $223.59

This setup aligns with a typical Elliott Wave correction pattern (ABC), in which the market pauses briefly before resuming its primary trend.

$AAPL 1H Elliott Wave Chart 8.25.2025:​

$AAPL
The next update, shows the stock is finding support from the equal legs area as predicted allowing traders to get risk free. Currently, it is looking for an impulsive rally towards 238 – 242 before another pullback takes place.

Conclusion

In conclusion, our Elliott Wave analysis of Apple Inc. ($AAPL) suggested that it remains supported against August 01, 2025 lows. Traders can apply Elliott Wave Theory to better anticipate the structure of upcoming moves. They can also enhance risk management in volatile markets.

Source: https://elliottwave-forecast.com/st...aapl-blue-box-area-offers-buying-opportunity/
 
Hello traders. In this technical article we’re going to look at the Elliott Wave charts of Oil commodity (CL_F) published in members area of the website. OIL has recently given us a 3 waves recovery that found sellers precisely at the equal legs area as we expected. In this discussion, we’ll break down the Elliott Wave pattern and forecast.

OIL Elliott Wave 1 Hour Chart 08.25.2025​

OIL is giving us correction against the 70.58 peak. We expect to see another leg up toward 64.68-66.01 area to complete a 3 waves (a)(b)(c) pattern. Our members know that we identify potential reversal zones using the Equal Legs technique. As long as the price stays within this region, we expect sellers to take control and push it down toward new lows. We recommended that members avoid buying the OIL at this stage, while favoring the short side.

You can learn more about Elliott Wave Patterns at our​

90% of traders fail because they don’t understand market patterns. Are you in the top 10%? Test yourself with this advanced Elliott Wave Test

OIL

OIL Elliott Wave 1 Hour Chart 08.27.2025​

A 2 days later, we can see the result. OIL reached the proposed equal legs area and found sellers, as expected. We got a decent reaction from the sellers’ zone. The recovery peaked at 65.1. As long as it remains below that high, the next leg down may be in progress

Remember, the market is dynamic, and the presented view may have changed in the meantime. For the most recent charts and target levels, please refer to the membership area of the site. The best instruments to trade are those with incomplete bullish or bearish swing sequences. We put them in Sequence Report and best among them are presented in the Live Trading Room

Reminder for members: Our chat rooms in the membership area are available 24 hours a day, providing expert insights on market trends and Elliott Wave analysis. Don’t hesitate to reach out with any questions about the market, Elliott Wave patterns, or technical analysis. We’re here to help.


Source: https://elliottwave-forecast.com/commodities/oil-cl_f-elliott-wave-equal-legs-area/
 
The short-term Elliott Wave outlook from the August 1, 2025 low projects an ongoing five-wave impulse structure. From that low, wave 1 peaked at 1.173, followed by a wave 2 pullback that concluded at 1.157. The internal structure of wave 2 developed as an Expanded Flat Elliott Wave pattern. After wave 1, wave (w) dropped to 1.1628, and a subsequent wave (x) rally reached 1.1716. Wave (y) then declined to 1.1579, completing wave ((a)) in a higher degree.

The rally in wave ((b)) topped at 1.174 before the pair turned downward in wave ((c)), unfolding as a five-wave impulse. From wave ((b)), wave (i) fell to 1.1682, and wave (ii) rose to 1.1709. Wave (iii) declined to 1.16, followed by a wave (iv) rally to 1.1665. Wave (v) then completed at 1.157, finalizing wave ((c)) of wave 2. The pair has now turned upward in wave 3 but requires a break above wave 1 at 1.173 to eliminate the possibility of a double correction. From wave 2, wave ((i)) reached 1.1697. A wave ((ii)) pullback should find support in a 3, 7, or 11 swing, supporting further upside as long as the pivot at 1.157 holds. This analysis suggests cautious optimism for continued upward momentum.

EURUSD - 60 Minute Elliott Wave Technical Chart:

EURUSD Elliott Wave Chart width=

Source: https://elliottwave-forecast.com/ne...d-awaits-decisive-move-confirm-bullish-trend/
 
Hello traders. Welcome to a new blog post where we discuss how the Elliott wave theory helps traders to identify perfect turning point in the markets. In this one, the spotlight will be on the USDSEK Forex pair.

The USDSEK is one of the Forex pairs we analyze for Elliottwave-Forecast members in Group 2. It is considered an exotic pair that heavily relies on the U.S. Dollar’s path. In typical market conditions, we like to use the USDX as a guide for this pair.

Similar to the Dollar Index, USDSEK has been in a long-term bearish corrective path since September 2022. This pullback is meant to correct the preceding 5-wave impulsive cycle from January 2021 at minimum. This reflects a core principle of Elliott Wave Theory: a 3-wave correction follows a 5-wave trend.

Despite USDSEK reaching the extreme level of the September 2022 cycle, we continued to forecast lower prices. Why? Because the Dollar had not yet achieved the minimum target price to complete its cycle, and price action had not shown signs of a major recovery. As a result, we maintained a bullish bias on the Dollar across the board.

Accordingly, we looked for 3/7/11 swing bounces against the bearish sequence and sold from extremes. This has been our strategy for trading the Dollar since January 2025, when the third leg of the September 2022 cycle began. In June 2025, another corrective bounce started and lasted until August 1, 2025. We once again sold the Dollar from the extremes across markets.

From August 1, USDSEK completed a 5-wave decline on the shorter cycles. Then, beginning August 13, price started correcting that 5-wave decline, and we decided to take renewed interest in the pair.

USDSEK, H1 Asia Update - 8/20/2025

usdsek

We shared the chart above with members on 20th August 2025 highlighting the short-term path. We expected the corrective bounce - wave 2 to finish soon. Afterwards, the pair should resume the year-long bearish path. We expect at least two more swings higher before the corrective bounce is complete.

USDSEK, H1 Asia Update - 8/22/2025

usdsek

We shared the chart above on 22nd August, 2025 when the corrective bounce was way more advanced. One more leg higher and then a likely sell-off would most follow, to finish wave 2 and begin wave 3 lower. In addition, we advised members to not enter long trades. Only look for shorts.

USDSEK, H1 Asia Update - 8/26/2025

usdsek

On the 26th August, we shared the chart above with members showing how price had reacted just as expected. Wave 2 finished with a diagonal wave (v) of ((c)) of 2 and sold off sharply. Despite the wide sell-off, the pair corrected higher. However, this follow-up update anticipated wave 3 to extend lower as wave 2 had already completed.

USDSEK, H1 Asia Update - 8/29/2025

usdsek

Price began wave ((iii)) of 3 as we had anticipated. We shared the chart above to members on 29th August, 2025 showing the sub-waves of wave ((iii)) as it develops. With these regular H1 updates ( four times daily), we ensure members are not lost in the market phobia and noises. Stay the course and reap the rewards.

Source: https://elliottwave-forecast.com/forex/usdsek-analysis-perfect-turning-point/
 
Pan American Silver Corp. (PAAS) is a leading precious metals mining company headquartered in Vancouver, Canada. The compnay specializes in the exploration, development, and production of silver and gold. Operating primarily in the Americas, the company owns and manages a portfolio of high-quality mines in countries such as Mexico, Peru, Bolivia, and Argentina. Below we will look at the Elliott Wave technical outlook for the company:

PAAS Monthly Elliott Wave Chart​


The monthly Elliott Wave analysis for Pan American Silver (PAAS) indicates that the stock completed wave ((II)) of the grand super cycle degree at $5.89. It has since begun rallying in wave ((III)), which is unfolding as an impulse. From the wave ((II)) low, wave (I) peaked at $40.11, followed by a corrective wave (II) that bottomed at $12.16. The stock has resumed its upward trajectory in wave (III). Within this wave, wave I reached $28.60, with a subsequent wave II pullback concluding at $20.55. As long as the $5.89 pivot low remains intact, expect pullbacks to attract buyers in a 3, 7, or 11-swing structure, supporting further upside potential.

PAAS Daily Elliott Wave Chart​


The daily Elliott Wave analysis for Pan American Silver (PAAS) indicates that the rally from the February 13, 2024, low completed wave I at $27.47. It was then followed by a wave II pullback that ended at $20.55. The stock has since resumed its upward trend in wave III, unfolding as an impulse. From the wave II low, wave ((1)) peaked at $28.60, with a corrective wave ((2)) concluding at $22.08. The stock then continued higher, with wave (1) reaching $31.03 and a wave (2) pullback ending at $26.77. In the near term, as long as the $20.55 low holds, expect pullbacks to find support in a 3, 7, or 11-swing structure, favoring further upside.

Source: https://elliottwave-forecast.com/video-blog/paas-elliott-wave-forecast-riding-higher-wave-iii/
 
JPMorgan Chase (JPM) trades at $301.42, testing a breakout zone near its 52-week high. This level signals strong bullish momentum. The stock remains above its 50-day and 200-day moving averages by 3.39% and 15.00%, respectively. Investors continue to show confidence in JPM’s earnings and strategic direction. Despite macro uncertainty and policy shifts, the bank maintains upward strength.

Analysts remain bullish. The average price target sits at $302.93, suggesting limited upside. BofA Securities and Wells Fargo offer aggressive targets of $340 and $325. They cite JPM’s leadership in digital finance and AI integration. JPM also adapts well to regulatory changes. Although EPS dipped from $19.75 to $18.60, forecasts show a rebound to $19.82 next year.

JPMorgan Research expects strong U.S. growth and dollar resilience. These trends support financials like JPM. The firm’s broad exposure consumer banking, investment services, and fintech—offers strategic advantages. The Chase is well-positioned to benefit from AI adoption and global trade shifts.

Elliott Wave Outlook: JPM Weekly Charts September 2024

Elliott Wave Outlook: JPM Weekly Charts September 2024


In 2024, we viewed the weekly Elliott Wave structure as a clear impulsive sequence from the March 2020 low. Wave ((1)) peaked at 172.28, then wave ((2)) corrected to 101.28. From there, price began wave ((3)), which remained incomplete. We projected wave ((3)) to end between 234 and 241. If no further extension developed, we expected sellers to emerge in that zone. This would likely trigger wave ((4))—a corrective phase before the next bullish leg. This is the last article: JPMorgan (JPM) Is Not Showing Weakness Near Term

If you're eager to dive deeper into Elliott Wave Theory and learn how its principles apply to market forecasting, you might find these resources helpful: Elliott Wave Education and Elliott Wave Theory.

Elliott Wave Outlook: JPM Weekly Charts August 2025


In this latest update, we observe that wave (5) of ((3)) extended to 280.25 high, completing wave ((3)). This was followed by a zigzag correction as wave ((4)), which found its bottom in April. From here, we see two possible scenarios: First, JPM could build a full impulsive structure to complete wave ((5)), finalizing the entire cycle as wave I. This would imply a deeper correction toward the 160–200 zone as wave II before resuming the bullish trend. The second scenario, which we are currently favoring, suggests the market is forming an extended wave ((5)). In this case, the rally from April would mark wave (1) of ((5)), and once the impulse ends, a corrective wave (2) could bring prices down to the 260–240 area before continuing higher.

At the moment, the impulse from the April low appears to be nearing its final phase, specifically wave 5 of (1). Unless further bullish extensions emerge, this move should be close to completion. Therefore, we expect continued upside until the impulse is fully formed. A sharp bearish reaction would signal the beginning of the corrective wave (2). We expect the current impulse could terminate within the 299.43–329.66 range, so traders holding long positions should closely monitor price action as we approach this zone.

Source: https://elliottwave-forecast.com/stock-market/jpm-bulls-fatigued-bears-warming/
 

JP Morgan Chase (JPM) Elliott Wave Analysis: Bullish Structure Remains Intact with Key Support at $215 and Upside Targets Toward $350–$395 into 2025​

JP Morgan Chase & Co. (NYSE: JPM) continues to show a strong bullish structure, as reflected in the latest Elliott Wave analysis. The monthly chart indicates that JPM is trending higher within a larger impulsive sequence, with the right side firmly pointing up, suggesting further upside potential in the coming years.

Elliott Wave Structure and Current Position:​

JP Morgan Chase & Co. (NYSE: JPM) maintains a strong bullish structure based on Elliott Wave analysis. The monthly chart shows that the 2009 low near $14.90 completed wave (II) at the blue degree. This marked the end of a major correction and started a long-term impulsive cycle at the larger red degree. Since then, the stock has progressed through red waves I, II, and III, with the peak of red III aligning with the completion of a five-wave rally at the double-parentheses degree ((1)) to ((5)), supported by an internal blue (5).

After completing red III, JPM entered a corrective phase. The decline unfolded into ((A)), ((B)), and ((C)) at the double-parentheses degree, forming red wave IV. This correction ended in 2022, setting the stage for a fresh bullish cycle. Since then, the stock has advanced strongly, unfolding at the double-parentheses degree through ((1)) and ((2)). Currently, JPM trades within ((3)), where blue-degree waves (1), (2), (3), and (4) are complete, while blue (5) pushes prices higher.


Once blue (5) and double-parentheses ((3)) finish, the market may pull back in ((4)) before beginning the final rally in ((5)). That last advance should complete the overall impulsive sequence within the larger red uptrend.

Trading Strategy and Right Side:

The right-side tag remains bullish, so traders should align with the upward trend. Pullbacks into blue box areas present buying opportunities, while counter-trend selling is not advised. As long as the price stays above the $215 support zone, the dominant bullish structure remains valid. The upside targets stand between $350 and $395 in the coming years. With a clear Elliott Wave roadmap and strong momentum, JPM continues to offer long-term growth potential.

Source: https://elliottwave-forecast.com/st...ott-wave-analysis-bullish-trend-set-continue/
 
After it completed a 5-wave resurgence from the April 2025 blue box, TXN is about to correct this bullish cycle to a zone where it could attract fresh bids it would need to launch a new bullish cycle.

Texas Instruments (TXN) is a global semiconductor company known for designing and manufacturing analog and embedded processing chips. With products used in everything from industrial equipment to personal electronics, TXN plays a critical role in powering modern technology. Its consistent innovation and strong market presence make it a closely watched stock in the tech sector.

TXN completed its long-term grand supercycle degree wave ((II)) in October 2002, bottoming near $13. From that point, the stock began an extraordinary two-decade rally as grand supercycle degree wave ((III)) unfolded. Wave (I) of ((III)) ended in August 2007 at $39.6, followed by a sharp correction in wave (II), which took prices back down to about $13.4 in December 2008. Wave (III) then started in December 2008, and the stock turned strongly bullish after surpassing its prior all-time high of $99.8 from March 2000. It went on to reach a new peak of $202.2 in October 2021. That high marked the completion of wave III of (III) of ((III)). Afterward, TXN entered a corrective wave IV that extended until October 2023. From there, it resumed its advance and went on to register a fresh high of $220.38 in November 2024.

From the peak of November 2024 the stock fell to complete a 7-swing pullback for wave ((2)). The wave ((2)) pullback ended in the blue box where buyers were waiting to buy the stock again. Thus, from the blue box, it rallied sharply in a clear 5-wave structure to complete wave (1) of ((3)) in 7/11/2025 as we mentioned in the 7/21/2025 update. In that update, we mentioned the 5-wave recovery was close to completion and traders/investors should expect a deep pullback. It happened as expected. Wace A of (2) pullback ended with a 5-wave impulse on 8/01/2025 and then followed by a 3-wave correction for wave B. The chart below shows the recent forecast and what should expected for this stock.

TXN Elliott Wave Analysis - 9/01/2025

TXN

As the chart above shows, another 5-wave down could follow soon. Unless the top of wave (1) is breached, this is very likely. Thus, buyers should be waiting at the extreme of wave (2) for new entries. However, if the top of wave (1) is breached with the rally from 8/01/2025, then we can call wave (2) completed and anticipate wave (3) toward $310. Why looking forward to that target, traders can continue to buy at the extreme of 3/7/11 swing pullbacks in the shorter cycles.

Source: https://elliottwave-forecast.com/stock-market/txn-elliott-wave-analysis-update/
 
Vistra Corp., (VST) operates as an integrated retail electricity & power generation company in the United States. It operates through five segments like Retail, Texas, East, West & Asset Closure. It comes under Utilities sector & trades as “VST” ticker at NYSE.

As discussed in the previous article, VST favored rally in impulse ((1)) from April-2025 low. It ended ((1)) at $216.85 high above January-2025 high, confirmed bullish bias. Now, it is correcting in 3, 7 or 11 swings that offer buying set ups at extreme area.

VST - Elliott Wave Latest Daily View:​

In Weekly, it made all time low of $11.30 in March-2020. Above that it ended impulse sequence of (I) at $199.84 high in January-2025. Within (I), it placed I at $107.24 high in May-2024 & II at $66.50 low as 0.382 Fibonacci retracement in August-2024. It ended III at $168.67 high in November-2024 in clear 5 swings & IV at $131.64 low in December-2024. Within III, it placed ((1)) at $87.89 high, ((2)) at $72.90 low, ((3)) at $143.87 high, ((4)) at $111.50 low & ((5)) at 168.67 high. Above IV low, it placed V at $199.84 high as (I) impulse. Below $199.84 high, it corrected lower in (II), which ended in daily blue box area at $90.51 low.

VST - Elliott Wave View From 6.16.2025:​

Above $90.51 low, buyers got profitable ride in ((1)), which ended at $216.85 high as last update. Within ((1)), it placed (1) at $120.96, (2) at 103.34, (3) at $198.20, (4) as flat at $180.25 & (5) at $216.85 in diagonal. It broke above (I) high, confirmed bullish bias as the part of (III), which can extend in to $279.20 - $395.81. Below 8.05.2025 high of ((1)), it favors downside in (A) of ((2)) & expect one more push lower below $201.38 high. Later, it expects bounce in (B) in 3 or 7 swings against 8.05.2025 high followed by (C) down. We like to buy the pullback in extreme area of (C) against 4.07.2025 for next leg higher. If it failed to make a new low below 8.20.2025, then the bounce can be (X), while placed (W) at $183.85 low. In that case, we like to buy (Y) in extreme area in ((2)).

Source: https://elliottwave-forecast.com/stock-market/vst-corrects-wave-2-potential-surge/
 
Coca-Cola (KO) shows resilience in a shifting market. In Q2 2025, it posted 5% organic revenue growth and 58% EPS jump. Despite currency headwinds, KO improved operating margin to 34.1%, driven by pricing power, cost control, and strategic campaigns like “Share a Coke.”

Although unit case volume dipped slightly due to weather and consumer pressure, Coca-Cola Zero Sugar and core brands gained momentum. Analysts remain optimistic, highlighting KO’s brand loyalty, strong dividend, and flexible pricing as key strengths in uncertain conditions.

Looking ahead, Coca-Cola plans to launch a cane sugar-based product in the U.S. this fall. At the same time, it reevaluates Costa Coffee’s future after underwhelming performance since 2018. Financially, KO holds solid fundamentals with a P/E ratio of 24.46 and a $297B market cap.

Despite a temporary dip in free cash flow from a $6.1B Fairlife payment, KO maintains strong long-term guidance. It projects 8% EPS growth for the year. Banks and analysts share a bullish outlook. MarketBeat reports a consensus “Buy” rating and a $77.21 price target—an 11.89% upside.

Technical analysts highlight a breakout zone between $67.74 and $69.14. They cite KO’s pricing power and dividend yield as key entry signals. As September brings volatility, KO’s defensive profile and global brand appeal attract institutional investors seeking stability.

Elliott Wave Outlook Ending Diagonal: KO Montly Chart September 2025

Elliott Wave Outlook Ending Diagonal: KO Montly Chart September 2025

On KO’s monthly chart, we’ve identified a leading diagonal from the all-time low to April 2025 high as wave ((I)). Wave (V) of ((I)) appears to form an ending diagonal, confirmed through technical analysis. This Elliott Wave pattern often signals exhaustion, suggesting the market may be losing bullish momentum. If the structure proves correct, long-term investors should prepare for a possible correction. In the worst-case scenario, price could drop toward the $40.00 zone. This setup deserves close attention, especially as structural patterns often precede major shifts.

Elliott Wave Outlook Nest: KO Montly Chart September 2025


Another way to view the chart is as a nest, multiple 1-2 waves forming over time. Currently, we may be in wave I-II. Unlike the first scenario, this one implies a shallower correction. Therefore, wave II could drop only to the 60–50 zone before the rally resumes. If the ending diagonal holds, this setup is ideal. KO has shown strong bullish behavior with minor pullbacks, unless disrupted by major events like a recession or the 2020 pandemic. Additionally, we must consider a possible extension in the ending diagonal. This lies between 76.56 - 81.49 area. If KO reaches this zone without correcting and maintains the diagonal structure, the pullback may occur there. However, if price breaks above 81.49, the diagonal will fail, and KO would continue higher.

Elliott Wave Outlook Impulse: KO Montly Chart September 2025

Elliott Wave Outlook (V) Impulse: KO Montly Chart September 2025

To conclude, this is the core idea that supports KO’s bullish outlook assuming no major correction unfolds. The goal is to generate new highs and controlled pullbacks, gradually building a long-term impulse that completes Coca-Cola’s cycle from its inception.

Source: https://elliottwave-forecast.com/stock-market/ko-alert-ending-diagonal-disrupt-rally/
 
As our members know we have had many profitable trading setups recently. In this technical article, we are going to talk about another Elliott Wave trading setup we got in iShares Russell 2000 ETF -IWM . The ETF has completed its correction exactly at the Equal Legs zone, also known as the Blue Box Area. In this article, we’ll break down the Elliott Wave forecast, explain the trading setup in detail, and provide the upside target.

IWM Elliott Wave 1 Hour Chart 8.20.2025​

IWM is forming a three-wave pullback against the 212.33 low. The price has already reached the Blue Box (buying zone). We have entered long trades at the equal legs level of 224.52. We expect at least a three-wave bounce from the Blue Box area. Once the price reaches the 50% Fibonacci retracement of the red B connector, we will make the position risk-free by moving the stop loss to breakeven and booking partial profits.

Did you know ? 90% of traders fail because they don’t understand market patterns. Are you in the top 10%? Test yourself with this advanced Elliott Wave Test

Official trading strategy on How to trade 3, 7, or 11 swing and equal leg is explained in details in Educational Video, available for members viewing inside the membership area.

IWM

IWM Elliott Wave 1 Hour Chart 8.20.2025​

The ETF found buyers as expected, rallying toward new highs. Consequently, any long positions from the Blue Box should now be risk-free. We’ve set our stop loss at breakeven and have already secured partial profits. As long as the price holds the pivot at the 223.64 low, we can expect at least another leg up as indicated on the chart.

Short term: While above the 230.84 low (wave 4 red), IWM is ideally targeting the 239.41–242.03 area next.

Reminder for members: Our chat rooms in the membership area are available 24 hours a day, providing expert insights on market trends and Elliott Wave analysis. Don’t hesitate to reach out with any questions about the market, Elliott Wave patterns, or technical analysis. We’re here to help.


Source: https://elliottwave-forecast.com/stock-market/ishares-russell-2000-etf-iwm-elliott-wave/
 

Indian Railway Finance Corporation Ltd. (IRFC) is correcting within a double three Elliott Wave pattern in wave II after completing a strong five-wave rally in wave I.​

Indian Railway Finance Corporation Ltd. (IRFC) has maintained a strong bullish trend over the past months. After forming a significant low, the stock started a powerful rally, completing a clear five-wave advance in wave I. This upward move confirmed the larger bullish cycle and showed strong investor confidence.

Currently, IRFC is in a corrective phase within wave II. This pullback aims to retrace part of the prior wave I advance. The correction is forming a double three pattern (W)-(X)-(Y), a common Elliott Wave structure in complex corrections. The first leg, wave ((W)), has already completed. After that, the price bounced in wave ((X)). Now, price action suggests that wave ((Y)) is likely to unfold soon before wave II reaches its base.


The broader bullish view stays valid as long as the price remains above the key invalidation level at ₹19.30. We do not recommend selling at current levels. Instead, traders should prepare for potential buying opportunities once the wave II correction ends.

Once the correction finishes, a strong wave III rally is expected to start. This next bullish leg is likely to take prices to new highs, continuing the long-term uptrend. Investors and traders should watch the upcoming support zones closely, as they may offer attractive low-risk entry points in line with the right-side bullish view.

Source: https://elliottwave-forecast.com/st...ction-nearing-completion-major-bullish-rally/
 

LII stock enters a wave IV corrective phase, offering potential buying opportunities before a strong bullish wave V rally resumes.​

Lennox International (LII) has been in a strong uptrend for many years, following a clear Elliott Wave impulsive structure. The stock recently completed wave III on the monthly chart and is now entering a corrective phase marked as wave IV. This pullback is a healthy part of the overall bullish cycle and offers opportunities for long-term investors.

Expected Elliott Wave Structure:​

The ongoing correction is likely to unfold as a three-wave structure, which is highly probable due to the principle of alternation, given that Wave II was a flat correction.. The first leg, wave ((A)), is expected to drive prices lower in the short term. After that, a wave ((B)) recovery may follow before wave ((C)) completes the correction. Once wave IV ends, wave V is expected to begin, likely pushing prices to new highs. This upcoming rally could offer strong potential for long-term investors.


At present, LII is trading near $578 and showing early signs of weakness as the correction begins. However, the broader uptrend remains intact as long as prices stay above the invalidation level at $19.72. Traders should avoid aggressive selling during this phase and instead prepare to enter when wave IV nears completion. Watching Fibonacci retracement zones and blue box buying areas can help identify possible reversal levels.

Final Outlook:​

LII remains in a larger bullish cycle despite the ongoing corrective phase. Patience will be key, as a deeper pullback in wave IV can create attractive entry setups before the next rally in wave V begins.

Source: https://elliottwave-forecast.com/st...tt-wave-analysis-correction-ahead-next-rally/
 
The Magnificent Seven ETF (MAGS) is an exchange-traded fund that tracks the performance of seven leading U.S. technology companies. These companies are often referred to as the "Magnificent Seven." These include major players like Apple, Microsoft, Amazon, Alphabet, Meta, Tesla, and NVIDIA. The ETF provides investors with diversified way to invest in the innovation and market dominance of these industry leaders. In this article, we will explore the long term Elliott Wave path of this ETF.

MAGS Weekly Elliott Wave Chart​


The weekly Elliott Wave chart for the Magnificent Seven ETF (MAGS) indicates a completed five-wave impulsive rally, peaking at $58.69 in wave (I). The subsequent correction in wave (II) appears to have concluded at $39. MAGS has since turned upward, initiating wave (III). The rally from the wave (II) low in April 2025 is mature, suggesting wave I is nearing completion. A corrective pullback in wave II is expected soon, followed by a resumption of the upward trend.

MAGS Daily Elliott Wave Chart​


The daily Elliott Wave chart for the Magnificent Seven ETF (MAGS) reveals that wave (II) unfolded as a double-three corrective structure following the wave (I) all-time high at $58.69. Wave w declined to $45.67, wave x rebounded to $49.46, and wave y concluded at $38.98, completing wave (II). Since then, MAGS has initiated an impulsive rally, marking the start of wave (III).

From the wave (II) low, wave ((1)) peaked at $46.67, followed by a wave ((2)) pullback to $40.58. The ETF then advanced in wave ((3)) to $60.96, with a wave ((4)) dip concluding at $57.83. MAGS should extend slightly higher to complete wave ((5)), which should also finalize wave I of a higher degree. Subsequently, expect a corrective wave II pullback against the cycle from the April 2025 low before the uptrend resumes. As long as the $38.98 pivot low remains intact, any pullback should find support in a 3, 7, or 11 swing, setting the stage for further upside.

Source: https://elliottwave-forecast.com/st...-seven-etf-mags-set-end-cycle-april-2025-low/
 
Hello everyone! In today’s article, we’ll examine the recent performance of NVIDIA Corp. ($NVDA) through the lens of Elliott Wave Theory. We’ll review how the rally from the April 2025 low unfolded as a 5-wave impulse followed by a 7-swing correction (WXY) and discuss our forecast for the next move. Let’s dive into the structure and expectations for this stock.

5 Wave Impulse + 7 Swing WXY correction​

$NVDA 4H Elliott Wave Chart 8.31.2025:​

$NVDAIn the 4-hour Elliott Wave count from August 31, 2025, we saw that $NVDA completed a 5-wave impulsive cycle at (5) of ((3)). As expected, this initial wave prompted a pullback. We anticipated this pullback to unfold in 7 swings, likely finding buyers in the equal legs area between $167.02 and $156.24.

This setup aligns with a typical Elliott Wave correction pattern (WXY), in which the market pauses briefly before resuming its primary trend.

Conclusion

In conclusion, our Elliott Wave analysis of NVIDIA Corp. ($NVDA) suggests that it remains supported against September 2025 lows. As a result, traders should buy the dips and monitor the $190 - 197 zone as the next potential target. In the meantime, keep an eye out for any corrective pullbacks that may offer entry opportunities. By applying Elliott Wave Theory, traders can better anticipate the structure of upcoming moves and enhance risk management in volatile markets.

Source: https://elliottwave-forecast.com/st...da-blue-box-area-offers-buying-opportunity-2/
 
Alnylam Pharmaceuticals Inc., (ALNY) discovers, develops & commercializes therapeutics based on ribonucleic acid interference. It comes under Healthcare – Biotech sector & trades as “ALNY” ticker at Nasdaq.

ALNY is showing strong rally from April-2025 low in previous article & expect further rally once (4) pullback ends. It rallied more than 40% since last update in (3) of ((3)). It expects one more push higher to finish April-2025 cycle in ((3)) before correcting next. We like to buy the pullback in ((4)) in 3, 7 or 11 swings at extreme area.

ALNY - Elliott Wave Latest Weekly View:​

It ended ((I)) at $140 high since inception in June-2025 & ((II)) pullback at $31.38 low in October-2016. Above there, it is showing nest as the part of (III) of ((III)). It placed (I) of ((III)) at $153.99 high in March-2018 & (II) at $60.27 low in December-2018. Within (III), it placed I at $242.97 high in December-2022 as diagonal & II at $141.97 low in April-2024. It placed ((1)) at $212 high, ((2)) at $117.58 low, ((3)) at $236.80 high, ((4)) at $181.65 low & ((5)) at $242.97 high. It corrected II in zigzag correction ended at 0.50 Fibonacci retracement of I.

ALNY - Elliott Wave View From 7.14.2025:​

Above April-2024 low of II, it placed ((1)) of III at $304.39 high & ((2)) at $205.87 low on 4.07.2025 low. Currently, it favors rally in ((3)) of III & already reached the 1.618 Fibonacci extension of ((1)), but still can extend more. Within ((3)), it placed (1) at $333.70 high, (2) at $309.57 low, (3) at $469.81 high & favors pullback in (4). It expects (4) pullback to find support between $431.85 – $408.34 before rally in (5) to finish ((3)) impulse sequence. Wave ((3)) expect to end with one more push higher towards $479 – $494 area later before correcting in ((4)). We like to buy the next big pullback in ((4)) in 3, 7 or 11 swings against 4.07.2025 low.

Source: https://elliottwave-forecast.com/stock-market/alnylam-alny-rally-479-494-correction-start/