Elliott Wave Analysis by EWF

USDCHF is selling from the blue box following a familiar market structure. Sellers at Elliottwave-forecast sold from the blue box and secured some profits already while looking out for more. This blog post looks at the structure that informed our decision to go short.

Since January 2025, the USDCHF forex pair, like the U.S. dollar in general, has been in a bearish sequence. This bearish run continued the September/October 2022 bearish cycle after a five-month recovery between September 2024 and January 2025. In a bearish sequence, we prefer selling bounces in 3, 7, or 11 swings if the larger bearish cycle has not yet finished. The broader USDX bearish cycle that began in September 2022 was still incomplete, with no signs of any meaningful recovery.

Since January, all bounces have been corrective. Therefore, we have remained sellers of the dollar against major currencies such as the EUR, GBP, JPY, AUD, and NZD in Group 1. In Group 2, we have been selling against majors like the CHF and some exotics such as SEK, NOK, and SGD. This post focuses on the USDCHF currency pair, which we cover in Group 2.

USDCHF Bearish Setup 7.29.2025


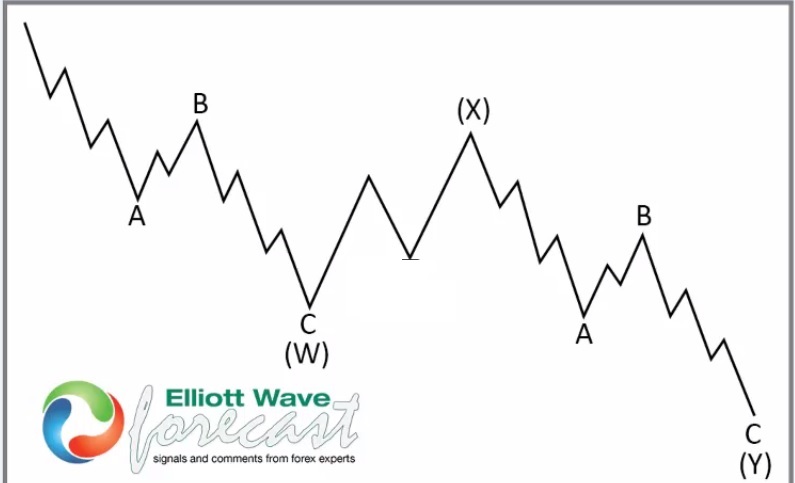
The January 2025 cycle hit a low on 07.01.2025 and then began a corrective bounce against the prevailing trend. This corrective bounce developed as a double three structure, and we preferred selling the pair at the extreme of this bounce.

On 07.29.2025, we shared the H4 chart above with ElliottWave-Forecast members, highlighting a sell setup from the blue box. We use the blue box to mark the extreme zone of bounces in a bearish sequence and pullbacks in a bullish sequence. At the blue box range of 0.8100–0.8220, we expected members to go short and take partial profits at 50% of wave (c) of ((y)).

USDCHF H4 8.07.2025

usdchf

As expected, the pair reached the blue box and sold off sharply. On 08.07.2025, we shared the H4 chart above with members. They hit the first target, booked profits on half the position, and adjusted the stop on the remainder to the top of wave ((c)).

Next week, we expect the pair to complete at least a 3-swing move lower toward 0.7970. The primary outlook, however, is for the pair to push much lower and attempt to break the 07.01.2025 low. Whether this happens in the coming week or the one after remains to be seen.

Source: https://elliottwave-forecast.com/forex/usdchf-july-rally-stalls-bluebox/
 
In this technical blog, we will look at the past performance of the 4-hour Elliott Wave Charts of EURUSD. In which, the rally from Sep 2022 low is unfolding as impulse sequence & showed a higher high sequence therefore, called for an extension higher to take place. We knew that the structure in EURUSD should remain supported & extend higher. So, we advised members not to sell the pair & buy the dips in 3, 7, or 11 swings at the blue box areas. We will explain the structure & forecast below:

EURUSD 4-Hour Elliott Wave Chart From 7.30.2025​

EURUSD Bullish Turn: Analyzing the Blue Box Area Reaction

Here’s the 4-hour Elliott wave Chart from the 7.30.2025 update. In which, the rally to $1.1830 high completed wave ((3)) & made a pullback in wave ((4)). The internals of that pullback unfolded as Elliott wave zigzag correction where wave (A) ended at $1.1554 low. Then a rally to $1.1788 high-ended wave (B) bounce. Then started the next leg lower in wave (C) towards $1.1512- $1.1340 blue box area. From there, buyers were expected to appear looking for new highs ideally or for a 3-wave bounce minimum.

EURUSD Latest 4-Hour Elliott Wave Chart From 8.09.2025​

EURUSD Bullish Turn: Analyzing the Blue Box Area Reaction

This is the latest 4-hour Elliott wave Chart from the 8.09.2025 Weekend update. In which the pair is showing a strong reaction higher taking place, right after ending the correction within the blue box area. Allowed members to create a risk-free position shortly after taking the long position at the blue box area. However, a break above $1.1830 high is needed to confirm the next extension higher & avoid double correction lower.

Source: https://elliottwave-forecast.com/forex/eurusd-bullish-turn-analyzing-reaction/
 

Life Insurance Corporation of India (LIC) advances in line with a bullish Elliott Wave sequence, supported by strong buying momentum.​

After completing a prolonged correction, Life Insurance Corporation of India (BSE: LICI) has resumed its bullish trend. The stock recently completed wave (4) near the 860 INR area, aligning with the blue box buying zone. From this level, buyers stepped in, rejecting further downside and confirming the continuation of the larger impulsive structure.

The Elliott Wave count shows that LICI is progressing in a five-wave sequence from the March low. Waves (1), (2), and (3) are already in place, with wave (4) finishing as a double three corrective pattern labeled W-X-Y. This consolidation respected prior support levels and stayed above the key invalidation zone at 716.05 INR. Holding above this level keeps the bullish bias intact.


The recent rally marks the start of wave (5) within wave ((1)), signalling renewed momentum. The near-term structure suggests more upside potential before a corrective phase begins in wave ((2)). Traders are advised to maintain a bullish stance, avoiding short positions while the price remains aligned with the green Right Side tag.

Conclusion:​

The broader cycle that began from the March low remains in play. With wave (5) underway, LICI could aim for new highs before encountering wave ((1)) consolidation. As long as price action respects the invalidation level, the upside remains the dominant scenario. This presents a favorable risk-reward environment for traders following the Elliott Wave framework.

Source: https://elliottwave-forecast.com/st...aligning-with-elliott-wave-bullish-structure/
 
Shopify Inc. (SHOP) continues to lead the e-commerce sector, with analysts maintaining a broadly optimistic outlook for 2025. The Ottawa-based company posted impressive financials, including a 31% year-over-year revenue increase and sustained double-digit free cash flow margins. After exiting the logistics business, Shopify refocused on its core software offerings—streamlining operations and boosting profitability. As a result, millions of merchants now rely on its platform for online sales, payments, marketing, and point-of-sale tools.

Shopify posted impressive results for the second quarter of 2025. To start, revenue rose 31% year-over-year, reaching $2.68 billion and beating forecasts by over $130 million. Next, net income jumped to $906 million, while earnings per share hit $0.35—well above expectations. In addition, gross merchandise volume climbed 29%, totaling $87.8 billion. As a result, free cash flow grew to $422 million, supported by a solid 16% margin. Thanks to strong demand for AI-powered tools and global merchant expansion, Shopify raised its Q3 outlook. Looking ahead, the company expects revenue growth in the mid-to-high twenties and continued margin strength. In turn, the stock surged more than 20%, showing strong investor confidence and confirming Shopify’s leadership in e-commerce

Meanwhile, analysts express cautious confidence. According to MarketBeat, 43 Wall Street analysts rate SHOP a “Moderate Buy,” with 24 buy ratings, 18 hold, and only 1 sell. The average price target stands at $148.51, reflecting Shopify’s consistent growth and expanding global merchant base. Although some warn of rising competition and macroeconomic uncertainty, most agree that Shopify’s innovation and operational discipline support long-term success.

Elliott Wave Outlook: SHOP Daily Chart April 2025

SHOP Daily Chart April 2025

In April, we marked wave III’s completion at 129.38, followed by wave IV bottoming at 69.84. From this inflection point, our forecast anticipated a bullish continuation toward the 143.49–154.61 zone. This target aimed to complete wave V of (I), signaling potential resistance. However, price action broke through, challenging the assumption of wave (II) and confirming bullish control.

If you're eager to dive deeper into Elliott Wave Theory and learn how its principles apply to market forecasting, you might find these resources helpful: Elliott Wave Education and Elliott Wave Theory.

Elliott Wave Outlook: SHOP Daily Chart August 2025


In this Elliott Wave update, Shopify continues its rally, forming a clear impulsive structure. The earnings gap met resistance near 154.61, which we’ve labeled wave 3 of ((3)). Therefore, we expect further upside through waves 4s and 5s, until complete wave ((5)) of V. This move would finalize wave V of (I), setting the stage for a new correction. Ideally, wave V of (I) should end above 166.30. We do not like selling, just look for buying opportunities.

Source: https://elliottwave-forecast.com/stock-market/shopify-shop-hits-target-profit-bulls-control/
 
Vertiv Holdings Co., (VRT) is provider of critical infrastructure & services for data centers, communication networks & commercial & industrial environments. It comes under Industrials sector & trades as “VRT” ticket for NYSE.

VRT favors impulse sequence in ((1)) of I of (III) after (II) pullback ended at $53.60 low in April-2025. It favors upside in (5) of ((1)) & soon pullback in ((2)), which provides buying opportunity later.

VRT - Elliott Wave Latest Daily View:​

In weekly since March-2020 low, it ended (I) at $155.84 high in January-2025 & (II) at $53.60 low in April-2025. Within (I), it ended I at $28.80 high, II at $7.76 low, III at $109.27 high, IV at $62.40 low & V at $155.84 high. In III, it placed ((1)) at $17.88 high, ((2)) at $11.95 low, ((3)) at $88.69 high, ((4)) at $72.58 low & ((5)) at $109.27 high. It ended ((A)) of IV at $85.14 low, ((B)) as flat at $95.48 high & ((C)) at $62.40 low in daily blue box area. Above there, it ended ((1)) at $83.75 high, ((2)) at $71.12 low, ((3)) at $145.67 high, ((4)) at $112.23 low & ((5)) at $155.84 high as V of (I).

VRT - Elliott Wave Latest Weekly View:​

Below (I), it ended a of (II) at $76.10 low, b at $94.20 high & c at $53.60 low in 3 zigzag correction in 4.07.2025. Within a red, it ended ((1)) at $97.50 low, ((2)) at $126.53 high, ((3)) at $84.59 low, ((4)) at $104.21 high & ((5)) at $76.10 low in diagonal structure. Above there, it ended (1) of ((1)) at $70.35 high, (2) at $60.67 low, (3) at $131.38 high, (4) at $110.06 low & favors upside in (5). Within (3), it ended 1 at $76.49 high, 2 at $65.68 low, 3 at $116.62 high, 4 at $107.38 low & 5 at $131.38 high.

VRT - Elliott Wave View From 4.21.2025:​

Within (5), it ended 1 at $133.52 high, 2 at $119.10 low, 3 at $153.50 high, 4 proposed ended at $135.35 low & favors upside in 5 of (5). It expects one more push higher above $153.50 to finish ((1)) soon before correcting in ((2)). We like to buy the pullback in ((2)) in 3, 7 or 11 swings against April-2025 low later. Alternative view is that it ended ((1)) at last peak, while ended (4) in flat correction at $119.10 low. In that case, the current bounce should fail below 7.30.2025 high to extend lower in (A) of ((2)). Therefore, chasing the last leg can be risky. The ((2)) ideally corrects between 0.382 - 0.618 Fibonacci retracement of ((1)).

Source: https://elliottwave-forecast.com/stock-market/vertiv-vrt-provide-swing-opportunity/
 
MicroStrategy (NASDAQ: MSTR) remains Bitcoin's largest corporate holder, driving its stellar performance. Yet while BTC tests all-time highs, MSTR trails 20% below its peak - creating a compelling divergence.. In today’s article, we explore MSTR’s Elliott Wave blueprint and outline the bullish paths that may unfold next.

The Correlation Divergence

MSTR typically outperforms Bitcoin's moves, offering traders leveraged BTC exposure. Yet recent months revealed troubling divergence. The chart below shows this decoupling clearly.

Two factors could explain the underperformance:

  1. Equity risk premium - Macro concerns weighed on stocks
  2. Liquidity shifts - Capital rotated to pure-play crypto ETFs
The key metric to watch: 30-day correlation coefficient (currently 0.82 vs. 0.93 historic average).

MicroStrategy MSTR Bitcoin BTC

Elliott Wave Structure

MSTR completed a zigzag correction from November 2024, hitting the $240-$192 Blue Box target. The subsequent 5-wave advance into July marked Wave ((1)), establishing $231.51 as critical support. Now, any 3/7/11-swing pullback should complete Wave ((2)) before the next surge.

Aggressive traders note August's dip may have already finished Wave ((2)). A break above July's $457 peak confirms Wave ((3)) toward $590-$644.

The key question: Will Wave ((3)) restore MSTR's leverage advantage?

MicroStrategy MSTR Daily Chart 8.12.2025

MicroStrategy MSTR Elliott Wave Daily Chart

Conclusion:​

MicroStrategy (MSTR) maintains its bullish Elliott Wave sequence, poised to close its performance gap with Bitcoin. The stock will build momentum through Wave ((3)), typically the strongest phase. Traders can leverage daily pullbacks using our Blue Box strategy

Source: https://elliottwave-forecast.com/stock-market/microstrategy-mstr-blueprint/
 
The Travelers Companies, Inc. (TRV) stands strong in the insurance sector. Analysts value its stable earnings, solid dividend, and consistent buybacks. Out of 17 expert ratings, 8 recommend buying, while 7 suggest holding. Only 2 advise selling. The average price target is $294.47, implying an 11% upside from the current $264.87. BMO and KBW raised their targets to $316, citing strong underwriting and pricing power.

However, not all experts agree. Morgan Stanley and Wells Fargo maintain hold ratings due to valuation concerns and catastrophe risks. Barclays recently downgraded TRV, reflecting caution amid market volatility. Despite mixed views, TRV remains a defensive favorite. Its resilience and shareholder-friendly strategy continue to attract long-term investors.

Elliott Wave Outlook: TRV Weekly Chart April 2025

Elliott Wave Outlook: TRV Weekly Chart April 2025

In the latest update, we clearly identified the structure of wave V. Wave ((1)) peaked at 266.74. Then, wave ((2)) corrected sharply to 230.43 but remained above wave IV. After that, TRV moved higher, targeting the 279.63–295.10 zone. This area marks the likely end of wave V of (I) and signals the possible start of wave (II).

However, if the market showed no strong pullback at those levels, wave V might have extended into wave ((3)). TRV would need to push above 300 to confirm a continuation of the bullish momentum.

Elliott Wave Outlook: TRV Weekly Chart August 2025

Elliott Wave Outlook: TRV Weekly Chart August 2025

The chart for TRV illustrates a mature Elliott Wave impulse structure on the weekly timeframe, suggesting that the stock may be nearing the end of a bullish cycle. The labeling shows a possible ending diagonal structure ((1)) through ((5)), followed by a potential corrective abc pattern. The projected resistance zone lies between 279.63 and 295.09, based on Fibonacci tool, if there are not more extension higher, we should see a strong reaction lower from this area. The annotation emphasizes trading only in the direction of the green/red “Right Side” tags, reinforcing a disciplined, trend following strategy. Overall, the chart signals caution: while upside targets remain viable, a corrective pullback (waves a, b, c) may soon unfold, offering potential re-entry opportunities for traders aligned with the broader wave structure.

Source: https://elliottwave-forecast.com/stock-market/elliott-wave-signals-caution-trv/
 
TMUS resumes the long term bullish sequence after finding the low for the March 2025 pullback in the blue box on 17th June 2025. The upside is now largely favored, going into the new trading week. What should traders expect next?

T-Mobile US (NASDAQ: TMUS) is a leading U.S. wireless carrier, known for its aggressive pricing and nationwide 5G network. Headquartered in Bellevue, Washington, it is majority-owned by Deutsche Telekom. Since merging with Sprint in 2020, T-Mobile has become the third-largest U.S. telecom provider. It is listed on the NASDAQ-100 and S&P 500 indices.

TMUS has been in a clear bullish sequence since 17th January 2022 when it finished wave IV of the cycle degree as we noted in the 24th May 2025 updates From the low of 17th January 2022, price rallied to complete wave ((1)) to ((4)) of V. Wave ((4)) corrective pullback ended on 1st June 2025. A strong impulse cycle followed and break above the wave ((3)) high to establish wave (1) of ((5)). Afterwards, the wave (2) of ((5)) followed from the 3rd of March 2025 where the stock price peaked. In a bullish sequence, we like to buy at the extreme of 3/7/11 swing pullback. Thus, we prepared for dip to end at the blue box of 7-swing pullback on the 24th May 2025 update. We shared the chart below.

TMUS Elliott Wave Analysis - 24th May 2025 update

On the 24th May 2025, we shared the chart below on the blog page of the site.

[caption id="attachment_961582" align="aligncenter" width="1024"]TMUS TMUS, Daily Chart[/caption]

TMUS Elliott Wave Analysis - 28th June update

On the 28th June, the stock reached the extreme area marked with the blue box. Thus, buyers entered into new trades to take advantage of an expected rally. The chart below shows what we used in the follow-up update on 28th June 2025.

[caption id="attachment_963527" align="aligncenter" width="1024"]TMUS TMUS Daily[/caption]

TMUS Elliott Wave Analysis - 17th August update

TMUS

The chart above shows the TMUS latest daily. The stock is currently pushing away from the blue box up to 35% already. Buyers should hold on to the Long up to $304 and even $331 in the medium term. This is a perfect blue box Elliottwave-Forecast setup that we like sharing with members on 78 instruments covering H1, H4, Daily and Weekly charts across ETFs, Stocks, Forex, Commodities, Indices and Cryptos.

Source: https://elliottwave-forecast.com/bluebox-wins/tmus-buyers-regains-control-off-bluebox/
 
In this technical blog, we will look at the past performance of the 1-hour Elliott Wave Charts of Apple ticker symbol: AAPL. We presented to members at the elliottwave-forecast. In which, the rally from 09 April 2025 low is unfolding as an impulse structure. Showing a higher high sequence favored more upside extension to take place. Therefore, we advised members not to sell the stock & buy the dips in 3, 7, or 11 swings at the blue box areas. We will explain the structure & forecast below:

Apple 1-Hour Elliott Wave Chart From 8.15.2025​

Apple's Reversal Play: AAPL Reacts Higher from Elliott Wave Blue Box

Here’s the 1-hour Elliott wave chart from the 8.15.2025 Midday update. In which, the cycle from the 01 August 2025 low ended in wave 3 at $235.12 high. Down from there, the stock made a pullback in wave 4 to correct that cycle. The internals of that pullback unfolded as Elliott wave zigzag structure where wave ((a)) ended at $230.85 low. Wave ((b)) bounce ended at $234.28 high & wave ((c)) was expected to reach the blue box area at $229.92- $227.24. From there, buyers were expected to appear looking for the next leg higher or for a 3 wave bounce minimum.

Apple Latest 1-Hour Elliott Wave Chart From 8.18.2025​

Apple's Reversal Play: AAPL Reacts Higher from Elliott Wave Blue Box

This is the latest 1-hour Elliott wave Chart from the 8.18.2025 Pre-Market update. In which the Apple is showing a reaction higher taking place, right after ending the zigzag correction within the blue box area. Allowed members to create a risk-free position shortly after taking the long position at the blue box area. However, a break above $235.12 high is still needed to confirm the next extension higher & avoid a double correction lower.

Source: https://elliottwave-forecast.com/bluebox-wins/apple-reversal-play-aapl-reacts-higher/
 
SoFi Technologies, Inc., (SOFI) provides various financial services in the US, Latin America, Canada & Hong Kong. It operates through three segments; Lending, Technology Platform & Financial services. It comes under Financial Services sector & trades as “SOFI” ticker at Nasdaq.

SOFI favors rally in 5 of (1) from April-2025 low as explained in previous article, which confirms above $25.11 high. It should rally targeting into $26.21 - $28.01 area against 7.30.2025 low before correcting next. We like to buy the next pullback in (2) in 3, 7 or 11 swings later against April low.

SOFI - Elliott Wave Latest Daily View:​

It made all time low of $4.24 in December-2022. Above there, it favors rally in (1) of ((3)) of III from 4.07.2025 low in proposed nesting. It placed I at $11.70 high in diagonal sequence in July-2023 & II as zigzag correction at $6.01 low in August-2024. It was corrected 0.764 in Fibonacci retracement in II before rally in ((1)) of III. It ended ((1)) at $18.42 high in January-2025 & ((2)) at $8.60 low in April-2025. Within ((1)), it placed (1) at $8.30 high, (2) at $6.75 low, (3) at $17.19 high as extended wave, (4) at $13.60 low & finally (5) at $18.42 high as ((1)). Wave ((2)) was corrected in 11 swings.

SOFI - Elliott Wave View From 7.21.2025:​

Above ((2)) low, it already confirmed higher high sequence indicates the bullish bias against April-2025 low. It favors rally in (1) of ((3)) & expect one push higher above 7.30.2025 low. Within (1), it placed 1 at $14.78 high, 2 at $12.74 low, 3 at $25.11 high, 4 at $20.43 low & favors rally in 5 of (1). Currently, it favors upside in ((i)) of 5 & expect a break above $24.50 high to finish it before correcting in ((ii)). As long as it holds above $20.43 low, it should rally into $26.21 - $28.01 area to finish (1) either as impulse or diagonal sequence. We like to buy the next pullback in 3, 7 or 11 swings in (2) against April-2025 low. If it breaks above $28.01 high & erase the momentum divergence, then it can see even more upside. So, we don’t recommend selling it in any pullback.

SOFI - Elliott Wave Latest Weekly View:​

Source: https://elliottwave-forecast.com/stock-market/sofi-favors-rally-extremes-pullback/
 
The Global X Uranium ETF ($URA) is an exchange-traded fund designed to provide investors with exposure to the uranium mining industry. It tracks the performance of the Solactive Global Uranium & Nuclear Components Total Return Index. This includes companies involved in uranium mining, exploration, and nuclear energy production. Launched in 2010, $URA offers a diversified way to invest in the growing demand for uranium, driven by the global push for clean energy and nuclear power.

URA Elliott Wave Chart Monthly Chart​


The monthly chart of the URA ETF indicates it bottomed out at 6.95. This marks the completion of a major corrective phase in the Grand Super Cycle wave ((II)). Since that low, the ETF has been advancing in a strong, impulsive pattern. Starting from the March 18, 2020 low, the initial upward move peaked at 31.60 in wave I. A corrective pullback wave II followed which ended at 17.65. The ETF then entered a robust wave III, which is developing in a five-wave structure of a smaller degree. From the prior low, the first sub-wave ((1)) hit 33.66, with the subsequent correction wave ((2)) finding a base at 19.50. As long as the 6.95 level remains intact, the URA ETF is poised to continue its upward trend.

URA Daily Elliott Wave Chart​


The daily chart of the $URA ETF indicates that a corrective wave ((2)) concluded at 19.5, tracing an expanded flat pattern. In this structure, the initial decline in wave (A) reached 22.79, followed by a rally in wave (B) to 33.99. The subsequent wave (C) dropped to 19.50, finalizing wave ((2)). Since that low, the ETF has progressed in a clear impulsive sequence.

From the wave ((2)) low, the first wave peaked at 23.31, with a corrective wave 2 finding support at 22.12. The third wave surged to 39.30, followed by a wave 4 pullback that bottomed at 36.20. The fifth wave culminated at 42.22, completing wave (1) of a higher degree. Currently, the ETF is undergoing a correction from the April 7, 2025 low in wave (2), with expectations of resuming its upward trend. As long as the 19.50 pivot holds, any pullback is likely to find support in a 3, 7, or 11-swing structure, setting the stage for further gains.

Source: https://elliottwave-forecast.com/stock-market/uranium-miners-etf-ura-remains-bullish-april-2025-low/
 
Visa (V) trades near its 52-week high of $375.51. Its market cap stands at $663.8 billion, reflecting strong investor confidence. With a P/E ratio of 33.63 and a modest 0.69% dividend yield, Visa remains a premium growth stock. The company’s global dominance and tech-driven strategy continue to attract long-term investors.

In Q3 2025, Visa posted $10.2 billion in revenue, up 14% year-over-year. EPS beat estimates at $2.98, marking four straight quarters of surprises. Analysts rate it a strong buy, with targets as high as $430. Visa’s investments in AI, cybersecurity, and blockchain reinforce its leadership. Despite regulatory risks, its forward P/E of 27.79 suggests room for upside.

Elliott Wave Outlook: VISA (V) Daily Chart December 2022​

VISA (V) Daily Chart From December 2022


Back in October 2022, Visa (V) hit the blue box at $174.60, completing wave ((Y)) of II and setting the stage for a bullish reversal. At the time, we anticipated a leading diagonal to unfold as wave ((1)), and the market delivered exactly that ending the structure at $220.04 high. We were expecting a pullback in 3 swings at least to end wave ((2)) before resuming the rally. This structure confirmed our forecast and reinforced the reliability of the blue box strategy. You can check the old article here: VISA (V) Completed A Double Correction And Rally

Elliott Wave Outlook: VISA (V) Weekly Chart August 2025​

In this update, we use the weekly chart of Visa (V) to show that Blue Boxes are not just marketing, they’re high-frequency zones where the market often reacts, and we aim to participate in those reactions. We can see the stock continued building an impulse structure from the blue box area. While alternate counts exist, we believe this one has the highest probability. As long as price stays above $328.70, we expect the rally to continue toward $386.57–$404.48, where wave ((5)) of III should complete. In that zone, we anticipate a bearish reaction that signals the start of wave IV, which should drop to $328.70 before wave V resumes higher. However, if price breaks below $328.70 soon, wave III is likely complete, and wave IV is already in progress. In that case, wave IV should fall to $298.75 before the next bullish leg in wave V.

Source: https://elliottwave-forecast.com/stock-market/visa-v-surges-blue-box-elliott-wave-success/
 
Hello Traders! Today, we will look at the Daily Elliott Wave structure of Bitfarms Ltd ($BITF) and explain why the stock is primed for more upside.

Bitfarms, a global and publicly traded Bitcoin mining company, develops, owns, and operates vertically integrated mining farms. Their operations, which have in-house management and company-owned electrical engineering and repair centers, use a proprietary data analytics system that delivers best-in-class performance and uptime. Currently, Bitfarms operates 10 farms in four countries: Canada, the United States, Paraguay, and Argentina.

We’ll review how the rally out of December 2022 low unfolded as a 5-wave impulse followed by a 3-swing correction (ABC) and discuss our forecast for the next move. Let’s dive into the structure and expectations for this stock.

5 Wave Impulse Structure + ABC correction​

$ADBE

$BITF Daily Elliott Wave Chart 8.19.2025:​

Breaking Down $BITF's Recent Price Action​

Based on a detailed Elliott Wave analysis, the Bitfarms Ltd. ($BITF) stock is in a strong bullish trend. The stock first completed an initial rally, following a classic 5-wave impulse pattern that began in December 2022. Next, a 3-swing correction (ABC) brought the price to a crucial support zone. This was the Blue Box extreme area, between $0.89 and $0.38. Therefore, this area represents a key turning point.
As a result, after wave (2) finished at the June 2025 low, the stock began the next major leg higher. This is wave (3). Furthermore, our proprietary RSI Pivot System has confirmed this move. The system provides a bullish signal for the start of this new rally. This next leg could potentially drive the price back toward its previous high near $4.20.

Conclusion​

For this bullish outlook to remain intact, the price must hold above the invalidation level of $0.38. A drop below this level would require a new analysis of the wave count. Consequently, traders should focus on buying opportunities and avoid short-selling. Pullbacks are likely to be temporary within this established bullish sequence. In conclusion, the path of least resistance for $BITF is to the upside, with significant potential for further gains.

Source: https://elliottwave-forecast.com/st...reach-4-20-elliott-wave-signals-bullish-move/
 
As our members know we have had many profitable trading setups recently. In this technical article, we are going to talk about another Elliott Wave trading setup we got in EURUSD. The pair has completed its correction exactly at the Equal Legs zone, also known as the Blue Box Area. In this article, we’ll break down the Elliott Wave forecast, explain the trading setup in detail, and provide the upside target.

EURUSD Elliott Wave 4 Hour Chart 07.28.2025​

EURUSD is forming a 3 waves pullback against the 1.10619 low. While price remains below the red ((x)) connector, we believe the correction is still in progress and expect another leg lower toward the 1.1512-1.1340 area , where we are looking to re-enter as buyers. We recommend that members avoid selling EURUSD. We expect at least a three-wave bounce from the Blue Box area.Once the price reaches the 50% Fibonacci retracement against the black ((x)) connector, we will make the position risk-free by moving the stop loss to breakeven and booking partial profits.

Did you know ? 90% of traders fail because they don’t understand market patterns. Are you in the top 10%? Test yourself with this advanced Elliott Wave Test

Official trading strategy on How to trade 3, 7, or 11 swing and equal leg is explained in details in Educational Video, available for members viewing inside the membership area.

EURUSD

EURUSD Elliott Wave 4 Hour Chart 08.19.2025​

The pair has made drop toward our buying zone- Blue Box area. EURUSD found buyers as expected, making decent reaction. The rally from from the buying zone has exceeded 50 fibs against the (B) blue connector. Consequently, any long positions from the Blue Box should now be risk-free. We’ve set our stop loss at breakeven and have already secured partial profits. While price holds above 1.1388, we consider the wave ((4)) correction complete and see potential for wave ((5)) to be in progress toward new highs.

Short term : rally from the 1.1388 low shows 5 waves structure. Currently the pair is doing a 3 waves pull back which can complete around 1.1620-1.1559 area.

Reminder for members: Our chat rooms in the membership area are available 24 hours a day, providing expert insights on market trends and Elliott Wave analysis. Don’t hesitate to reach out with any questions about the market, Elliott Wave patterns, or technical analysis. We’re here to help.


Source: https://elliottwave-forecast.com/forex/eurusd-trading-setup-buying-blue-box/
 
Roblox (NYSE: RBLX) soared 595% from its 2022 lows, firmly establishing itself as a top-performing stock. Previously, we identified a bullish nesting structure originating from the $21.65 low. Now, with RBLX breaking to fresh all-time highs, we examine the ongoing Elliott Wave pattern. Subsequently, this analysis outlines the expected next targets and key levels to watch.

Roblox Elliott Wave Analysis

RBLX's explosive rally since the 2022 low has decisively breached its 2021 peak of $141.60. Consequently, the stock has established a strong weekly bullish sequence. This pattern now targets the $163 - $196 equal legs area. Furthermore, the nesting structure from the lows propelled prices to new all-time highs within Wave (3). This phase is typically the strongest and most extended in Elliott Wave theory. As the chart below shows, the impulsive sequence remains active. Currently, Wave (4) is unfolding as a correction. Ultimately, this pullback should yield next rally in Wave (5). This will complete Wave ((3)) within the projected target zone. Following this rally, another pullback in wave ((4)) will occur. This creates a final buying opportunity before wave ((5)) of III begins.

Roblox RBLX Weekly Chart

Roblox RBLX Weekly

Conclusion​

RBLX's bullish sequence will support the stock through all upcoming pullbacks. Consequently, this creates strategic opportunities to enter during daily corrections. Traders should ideally position themselves after a 3, 7, or 11-swing corrective pattern completes. Then, anticipate extensions toward new highs. Moreover, our proprietary Blue Box system sharpens entry precision. Ultimately, this offers clarity and confidence for timing optimal trade setups.

Source: https://elliottwave-forecast.com/stock-market/roblox-rblx-bullish-surge/