Elliott Wave Analysis by EWF

Micron Technology (MU) leads the memory and storage industry with advanced DRAM, NAND, and emerging memory technologies. Founded in 1978, it quickly became essential to smartphones, AI, automotive systems, and data centers. Moreover, Micron focuses on performance, energy efficiency, and scalable innovation. As a result, it empowers faster, smarter, and more secure digital solutions worldwide. Ultimately, Micron continues to shape the future of intelligent computing across industries.

Micron posted a record $9.3B in Q3 FY2025 revenue, fueled by strong AI-driven demand for DRAM and HBM memory. Net income hit $2.18B with EPS of $1.91, beating expectations. For Q4, the company projects up to $11B in revenue and EPS as high as $2.65. Backed by $12B in liquidity and a $200B U.S. investment plan, Micron is solidifying its role as a leader in next-gen semiconductor innovation.

Technically, MU has been trading above key moving averages, supported by strong volume and bullish momentum. The stock recently broke out of consolidation, confirming institutional interest and trend strength. However, with the Relative Strength Index (RSI) nearing overbought territory and price action approaching key Fibonacci levels, it’s an ideal moment to apply Elliott Wave analysis. This method helps us identify the current wave structure, assess whether the rally is impulsive or corrective, and anticipate potential reversal zones or continuation targets. By mapping out the wave count, we aim to align with the dominant trend while managing risk with precision.

MU Weekly Chart March 2025

MU Weekly Chart March 2025


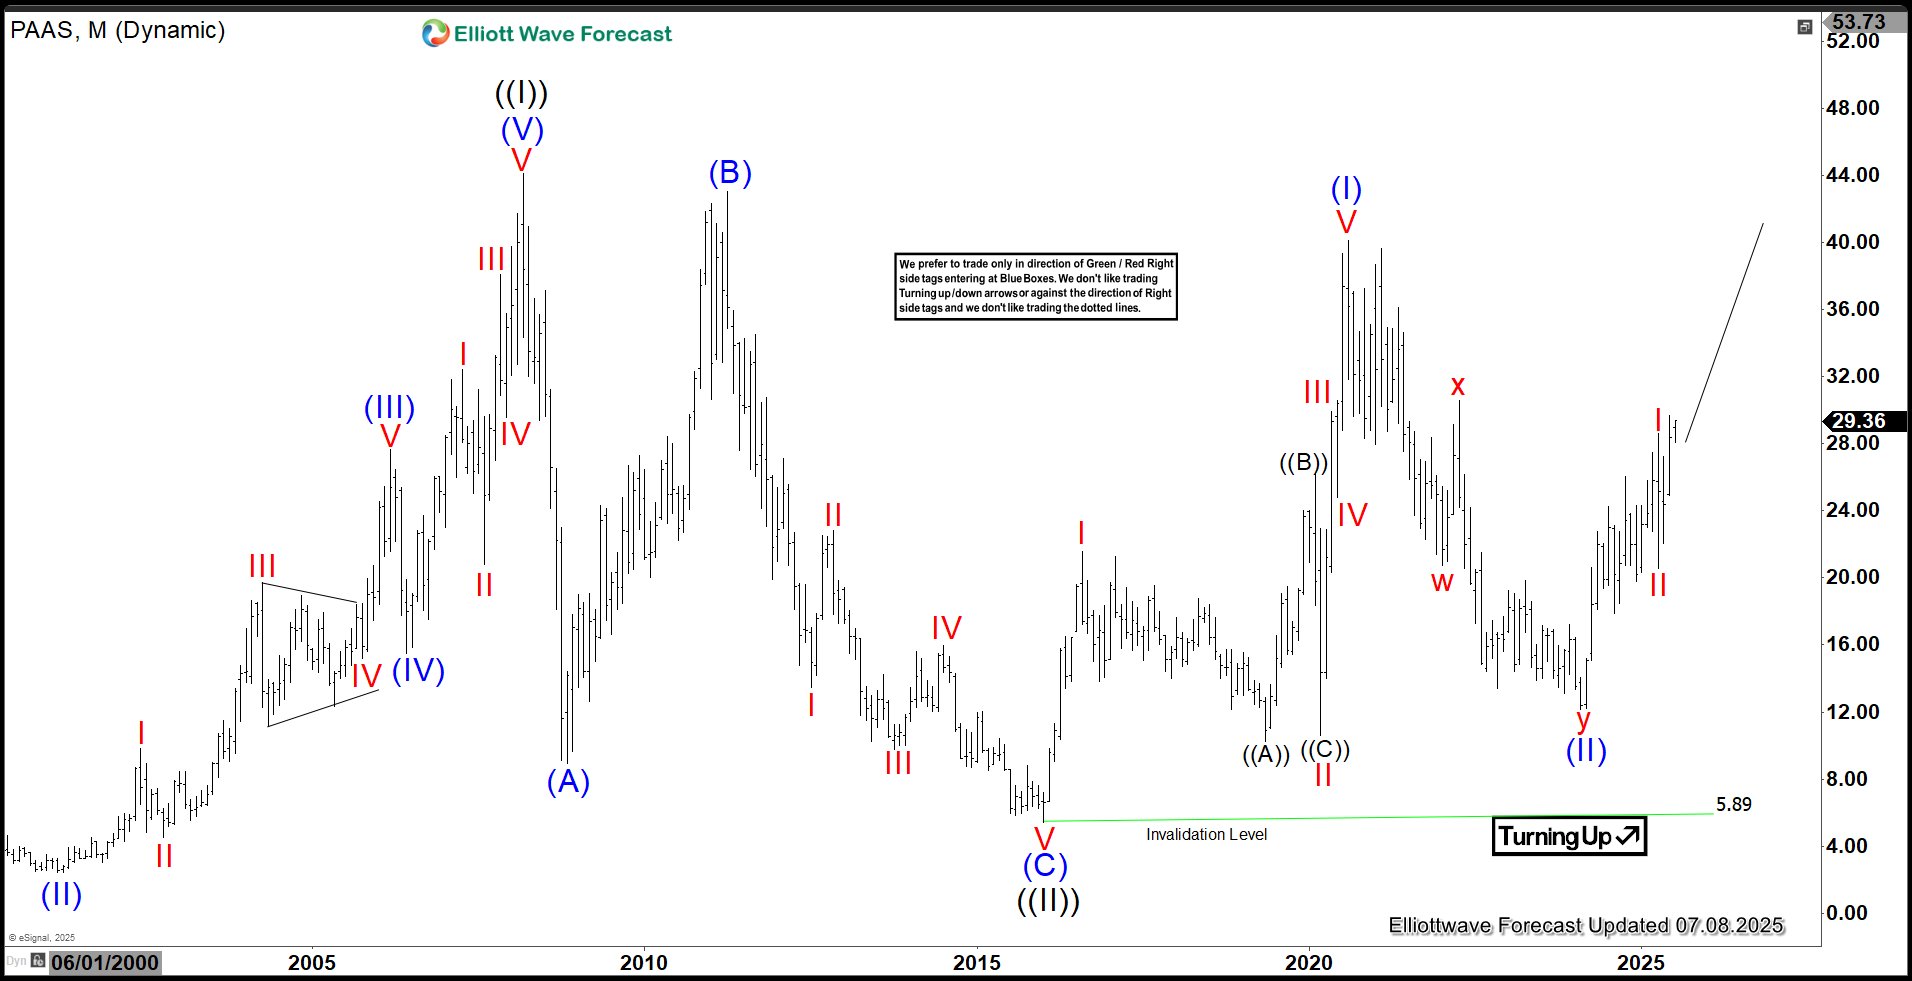
The price broke below wave ((A)) low, which suggested wave ((B)) may be completed instead of wave (A). However, the ranging movement more likely indicated wave ((B)) was forming an expanding flat correction. We labeled wave (B) at the 83.54 low, and wave (C) was progressing as an impulse or an ending diagonal structure. The chart illustrates an upward impulse, targeting the 113.95–132.90 area for wave (C) and ((B)). Afterward, the market will likely react lower to continue wave ((C)) of II. On the other hand, if the market would break below wave (B), it would confirm the completion of wave ((B)) and the beginning of a downward wave ((C)).

If you’d like to deepen your understanding of Elliott Wave Theory, explore these resources: Elliott Wave Education and Elliott Wave Theory

MU Weekly Chart July 2025

MU Weekly Chart July 2025

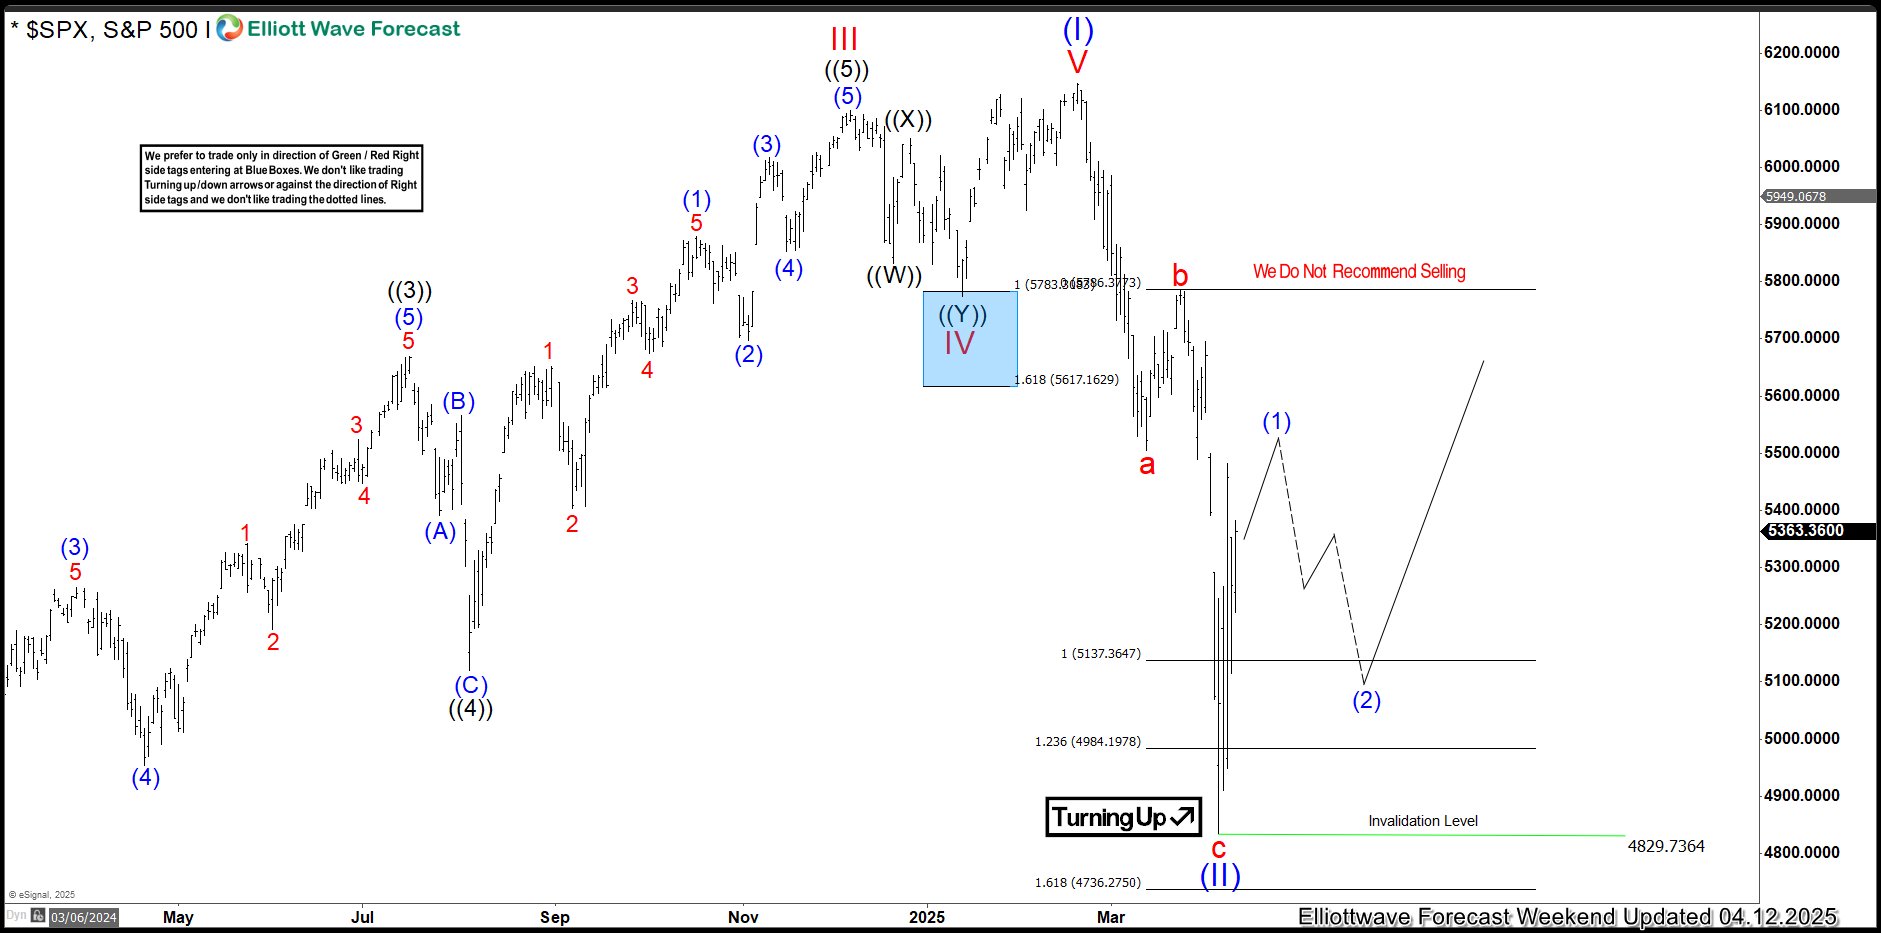
In this new weekly chart, we can see that the expected expanded flat did not materialize. Instead, the market broke below wave (B) at 83.54, confirming that wave ((B)) had already ended. This event coincided with the announcement of new international tariff changes by the United States. Wave ((B)) ended at 104.69, forming a triangular structure and initiating wave ((C)) of II. The market then experienced a sharp decline, reaching 61.54 and completing the correction on April 7. From that point forward, the price action turned decisively bullish, signaling the development of an impulsive advance.

Currently, we believe the stock is building wave (1), with price action entering wave 3 of (1). The structure suggests continued upward movement, although we expect some range-bound behavior as the market works toward completing the impulse. Ideally, wave 3 should reach the 132.82–137.41 zone, where we anticipate a potential bearish reaction that could mark the end of wave 3. Afterward, the market will likely remain in a consolidation phase before initiating a final rally to complete wave (1) and transition into a corrective phase.

Source: https://elliottwave-forecast.com/stock-market/micron-mu-surges-ai-wave-count-rally/
 
Nasdaq futures rallied strongly since April 7, 2025 low and made a new all time high. Today, we take a look at how our members knew where the rally was likely to end and where we could start a rally for new all time highs or produce 3 waves reaction higher at least.

NQ_F (Nasdaq Futures) Daily Chart April 6, 2025​

Nasdaq daily chart below shows Index futures ended cycle from October 2022 low back in December 2024. It was a tremendous rally which resulted in more than 100% gain. Pull back from December 2024 high is in 3 waves or 7 swings and should be ending between 17202 - 16417 area. As pull back holds above 14375 which is 161.8% fibonnacci extension of (( W )) related to (( X )), we expect Index futures to find buyers in 17202 - 16417 area and turn higher to resume the rally for a new all time high.

Nasdaq Futures Daily Chart April 6, 2025

NQ_F (Nasdaq Futures) Daily Chart April 6, 2025​

Nasdaq futures completed 7 swings in the defined area finding a low at 16467 and rallied strongly. Index made a new all time within a few months of hitting the buying area. It rallied from 16467 to 22998 gaining 6531 points which works out to be 39.66%. When market was in a sharp decline back in April 2025, our members knew exactly where to expect the pull back to end and to enter long positions. It has yielded a profit of 39.66% so far and rally is not over yet. Rally from April 2025 low can extend further before it comes to an end. Once the rally is over, we can expect a larger pull back in 3 or 7 swings to correct the cycle from April 2025 low before Index futures turn higher again.

Nasdaq Futures Daily Chart July 6, 2025

Source: https://elliottwave-forecast.com/trading/members-caught-latest-nasdaq-rally/
 
Hello everyone! In today’s article, we’ll examine the recent performance of SPDR Metals & Mining ETF ($XME) through the lens of Elliott Wave Theory. We’ll review how the reaction from the April 2025 blue box areas unfolded as an impulsive 5 waves and discuss what's next. Let’s dive into the structure and expectations for this ETF.

5 Wave Impulse Structure​

$XME

The April 2025 Setup​

$XME

The above chart illustrates our Elliott Wave forecast for $XME as of April 2025. At this point, $XME was depicted as completed a potential wave (II) correction, specifically reaching a blue box area between approximately $48.07 and $38.93. This blue box represented a high-probability reversal zone, calculated using Fibonacci extensions (1.236 and 1.618 respectively, of prior waves). The label "Turning Up" near the bottom of the blue box, along with an "Invalidation Level" at $38.93, signaled our expectation for a significant bounce.

The July 2025 Soar​

$XME

Fast forward to July 6, 2025, as seen above. This chart strikingly demonstrates the strong reaction from the April 2025 blue box area. From the low within the blue box, XME has indeed surged, exhibiting a clear five-wave impulsive structure. Comparing the two charts, the most significant extension higher is evident in the current price action. In the April chart, the market was still in the corrective phase, potentially forming the (II) wave within the blue box. The July chart shows that from that blue box low, XME has embarked on a powerful rally. The rally has unfolded with distinct sub-waves, particularly noticeable in the extension of wave (3), which then corrected in wave (4), and is currently extending higher in wave (5).

The 50% Rally and What's Next

From the approximate low of the blue box around $48, XME has climbed to current levels near $72. This represents an impressive gain of approximately 50%. This strong rally confirms the validity of the Elliott Wave count. It anticipated a bounce from this key support area.

The current chart shows XME in what appears to be the final leg of an impulsive move. It is specifically targeting the completion of wave (5). The target of $76 is still ahead. This suggests further upside potential to complete this current impulse.

Conclusion

The Elliott Wave analysis successfully identified a high-probability reversal zone in XME back in April 2025. This led to a remarkable 50% rally. The price action since then has unfolded precisely as an impulsive five-wave structure. This reinforces the bullish outlook. With the $76 target still on the horizon, XME continues to demonstrate strong momentum. Traders will be watching for the completion of this current impulse before anticipating any significant corrective moves.

Source: https://elliottwave-forecast.com/stock-market/metals-mining-etf-xme-soars-blue-box-area-76-target/
 
Gorilla Technology Group Inc., (GRRR) provides solutions in security, network, business intelligence & internet of Things technology in Taiwan & United Kingdom. It operates through three segments: Video IoT, Security Convergence & Other Segments. It comes under Technology sector & trades as “GRRR” ticker at Nasdaq.

GRRR favors upside against May-2025 low & current pullback should remain supported above $14.32 low extend higher. It confirms bullish sequence, once it breaks above $44.15 high.

It made all time low of $2.09 in August-2024 since inception after made all time high of $510. Since $2.09 low, it was showing impulse sequence higher in I, ended at $44.15 on 3.05.2025 in diagonal structure. Within I, it placed ((1)) at $34.41 high, ((2)) at $19.55 low, ((3)) at $38.88 high, ((4)) at $29.39 low & ((5)) at $44.15 high as I. ((1)) of I subdivided in 5 swings. Within ((1)), it placed (1) at $5.45 high, (2) at $3.71 low, (3) at $25.67 high, (4) at $10.85 low & (5) at $34.41 high. Below I high, it unfolded II in 3 swings pullback ended at $14.32 low in May-2025. Below I high, it placed ((A)) at $23.56 low, ((B)) at $34.12 high & ((C)) at $14.32 low as II. II correction was dip around 0.764 of I cycle.

GRRR - Elliott Wave Latest Daily View:​

Above II low, it is showing 5 swings higher (1), ended at $27.90 high in 6.20.2025. (1) was subdividing in to 1 at $18.83 high, 2 at $15.35, 3 at 23.43 high, 4 at $18.14 low & 5 at $27.90 high. Below there, it favors corrective pullback in (2) in 3 or 7 swings pullback, which should stay above II low to rally higher. It placed A of (2) at $19.54 low, B at $24.88 high & favors downside in C leg below that level. As long as the pullback stays above II low, it should extend higher in (3), which confirm above $27.90 high. Alternatively, if it breaks below $12.20 low, it may correct II in double three structure against August-2024 low.

Source: https://elliottwave-forecast.com/stock-market/gorilla-grrr-bulls-control-key-support/
 
Pan American Silver Corp. is one of the world’s leading precious metals mining companies, headquartered in Vancouver, Canada. With a diversified portfolio of silver and gold mines across Latin America and Canada—including key operations in Mexico, Peru, Bolivia, Argentina, and Chile—PAAS offers investors substantial exposure to silver through long-life reserves and expanding production.

PAAS Monthly Elliott Wave Chart​


The monthly Elliott Wave outlook for Pan American Silver (PAAS) reveals a sustained bullish progression. The bullish move began after the wave ((II)) correction concluded at $5.89 in January 2016. That low served as the springboard for the unfolding wave ((III)), signaling a major trend reversal. From that turning point, the initial rally in wave (I) drove prices to a high of $40.11. Then a deeper retracement in wave (II) followed which bottomed at $12.16. The advance has since resumed in wave (III), suggesting renewed momentum is building. Within this larger wave structure, wave I peaked at $27.47, followed by a wave II pullback that found support at $20.55. As long as PAAS holds above the $5.89 low, the broader bullish outlook remains intact, favoring continued upside as wave (III) further develops.

PAAS Daily Elliott Wave Chart​


Pan American Silver (PAAS) is tracing a clear Elliott Wave roadmap on the daily chart. This reflects a sustained bullish trajectory that originated from the $12.19 lo - a pivotal level marking the completion of wave (II). From there, the stock embarked on wave I, forming a leading diagonal structure. Wave ((1)) topped at $24.27, then softened to $17.86 in wave ((2)). The rally continued with wave ((3)) extending to $26.05. Wave ((4)) retraced to $19.80, and wave ((5)) finalized the diagonal at $27.47, thereby completing wave I.

Wave II followed with a measured pullback to $20.55. This sets the stage for the next phase higher—wave III, now unfolding as a classic impulsive pattern. Early signs are promising: wave ((1)) of III terminated at $28.60, and wave ((2)) concluded at $22.08. With the foundational low of $12.19 still intact, the broader bullish structure remains firmly supported. The structure favors further advances as wave III gains momentum.

Source: https://elliottwave-forecast.com/stock-market/pan-american-silver-paas-ready-push-higher/
 

The Power of 3-7-11 and the Grand Super Cycle: How We Saw the Bullish Turn in April 2025​

Back on April 9, 2025, while World Indices were dropping sharply and global sentiment had turned overwhelmingly bearish, we published an article that challenged the fear-driven narrative. We explained why selling was not the right approach and showed how our unique 3-7-11 wave structure continued to support a bullish outcome.

Revisit the article here:
Elliott Wave Explained: Why the Market’s Sharp Correction Isn’t the End of the Bull Run

At ElliottWave-Forecast.com, we've built a proprietary system that reflects true market nature and adapts to the high-frequency, algorithm-driven environment of 2025. Our approach acknowledges the role of machine-based trading. This allows our members to trade with the machines, not against them.

To dive deeper into how the Elliott Wave Theory has evolved in today’s world, read this follow-up:
2025 & The Elliott Wave Theory: Welcome to the Era of the Machines


$SPX and the High-Frequency Entry: The April 2025 Reaction​

Here is the Daily chart of $SPX from April 19, 2025, showing how the index reacted precisely to the High-Frequency (Blue Box) area. While we recognized the possibility of a deeper 7-swing correction, our analysis correctly called the low after just three waves — and the market has since traded to new all-time highs.


The Grand Super Cycle: Where Are We Now?​

As we look ahead, the market stands at a pivotal point. The next few months could define the Grand Super Cycle across global indices. Here’s what we see:

. Nine swings are already visible within the larger impulsive structure — sufficient for a completed impulse

. Our chart illustrates how the Grand Super Cycle is unfolding and why multi-market correlations and other tools are critical to determine what comes next.


The Three Scenarios Ahead​

  1. A Triple Nest
    • A very bullish outcome, implying an extended and powerful rally ahead.
  2. Wave (III) Ending (Double Nest)
    • Suggests we are completing wave (III) from 04.06.2020 low. A correction in wave (IV) followed by a final rally in wave (V) would follow.
  3. The Grand Super Cycle Is Ending.
    • This would lead to a major crash, potentially redefining the broader trend for years.
We always label the more aggressive scenario first, because our job is not to echo fear but to guide members toward the most likely path — aligned with the true nature of the market.
 
Hello fellow traders. In this article we’re going to take a quick look at the Elliott Wave charts of the S&P 500 E-Mini (ES_F Futures) , published in the members area of the website.

As our members know, $ES_F is showing impulsive bullish sequences in the cycle from the 5959.31 low. Recently it pulled back and found buyers at the equal legs area. Here’s our Elliott Wave Forecast and what to expect next.

ES_F Elliott Wave 1 Hour Chart 07.07.2025

$ES_F is showing 5 waves up in the cycle from the 5959.31 low. Current view suggests that the cycle could already be completed and now doing a pullback, wave ((iv)). As of now, we count 5 waves in the decline from the peak, suggesting we’ve seen only the first leg of the ((iv)) pullback, which is unfolding as an Elliott Wave zigzag pattern. As long as the price stays below the (b) peak, $ES_F is likely now in the final (c) leg of the correction. We expect the decline toward the 6255.57–6220.15 ( buyers area) to complete wave ((iv)) black before the bullish trend resumes.

Did you know? 90% of traders fail because they don’t understand market patterns. Are you in the top 10%? Test yourself with this advanced Elliott Wave Test

ES_F

ES_F Elliott Wave 1 Hour Chart 07.09.2025

ES_F made another leg down, following a 5-wave structure toward the extreme zone. It found buyers and turned higher as expected. Now, we’d like to see a break above the July 3rd peak, which will confirm further extension to the upside. The futures should ideally remain supported as long as the pivot at the 5959.4 low holds.

Reminder for members: Our chat rooms in the membership area are available 24 hours a day, providing expert insights on market trends and Elliott Wave analysis. Don’t hesitate to reach out with any questions about the market, Elliott Wave patterns, or technical analysis. We’re here to help.

ES_F

Source: https://elliottwave-forecast.com/stock-market/sp-500-e-mini-es_f-found-buyers/
 
Hello fellow traders. In this technical article we’re going to look at the Elliott Wave charts of NASDAQ (NQ_F) published in members area of the website. As our members know, $NQ_F is forming impulsive bullish sequences in the cycle from the 16441.7 low. Recently, we forecasted the end of the short-term pull back and called for a further rally. In the following text, we’ll explain the Elliott Wave analysis and present target areas.

NQ_F Elliott Wave 1 Hour Chart 07.07.2025​

NASDAQ is forming a three-wave pullback which still looks incomplete at the moment. Our members know that we can easily identify the reversal area by measuring the Equal Legs zone, (a) related (b), which comes in at the 22803.44-22664.02 area. We expect buyers to appear within the mentioned zone and to see a further rally in NASDAQ ($NQ_F) from there.

You can learn more about Elliott Wave Patterns at our​

90% of traders fail because they don’t understand market patterns. Are you in the top 10%? Test yourself with this advanced Elliott Wave Test

NQ_F

NQ_F Elliott Wave 1 Hour Chart 07.07.2025​

NASDAQ found buyers as expected at the Equal Legs area and has delivered a decent rally so far. The price broke toward new highs, confirming the next leg is already in progress.

Remember, the market is dynamic, and the presented view may have changed in the meantime. For the most recent charts and target levels, please refer to the membership area of the site. The best instruments to trade are those with incomplete bullish or bearish swing sequences. We put them in Sequence Report and best among them are presented in the Live Trading Room

Reminder for members: Our chat rooms in the membership area are available 24 hours a day, providing expert insights on market trends and Elliott Wave analysis. Don’t hesitate to reach out with any questions about the market, Elliott Wave patterns, or technical analysis. We’re here to help.

How well do you really know the stock market? Take this Stock Market Quiz and put your knowledge to the test!

NQ_F

Source: https://elliottwave-forecast.com/stock-market/nasdaq-nq_f-elliott-wave-2/
 

Wave (II) correction ends as NU begins a new impulsive cycle with strong upside potential supported by Elliott Wave analysis.​

Nu Holdings Ltd. (NYSE: NU) continues to gain bullish traction as the stock completes a significant corrective phase. The weekly Elliott Wave structure suggests that wave (II) has ended, and a new impulsive wave higher is underway. This wave structure reflects a broader trend reversal and presents a promising setup for long-term investors.

After an initial five-wave rally into wave (I), NU entered a deep and complex correction labeled as wave (II). The structure unfolded as a W-X-Y double zigzag, which is typical in second-wave pullbacks. Despite the consolidation, the correction held well above the long-term invalidation level at $3.27, preserving the bullish outlook.


Now, price action from the bottom indicates the beginning of a new bullish sequence. Subwaves ((1)) and ((2)) of the next impulse appear to have already formed. NU is likely moving higher in wave ((3)), which often brings strong momentum. Once wave ((3)) completes, a minor pullback in wave ((4)) may follow before price resumes higher in wave ((5)).

The chart also highlights a “Right Side” tag, confirming that the preferred direction is up. Traders are advised not to trade against the trend, as emphasised by the “We Do Not Recommend Selling” message on the chart.

Summary:​

In summary, NU looks to have completed its wave (II) correction and is advancing in a new bullish cycle. The broader Elliott Wave pattern supports higher targets in the coming months. Investors may consider looking for long opportunities on pullbacks, as long as the price stays above $3.27. The current setup offers a favorable risk-reward scenario aligned with the primary trend.

Source: https://elliottwave-forecast.com/st...nyse-nu-completes-elliott-wave-ii-correction/
 
The Global X Silver Miners ETF (SIL) is an exchange-traded fund designed to provide investors with exposure to the silver mining industry. Launched in April 2010, SIL seeks to track the performance of the Solactive Global Silver Miners Total Return Index. It includes a diversified portfolio of global companies primarily engaged in silver exploration, mining, and production. Below we will update the Elliott Wave Outlook for the ETF.

SIL (Silver Miners ETF) Monthly Elliott Wave Chart​

The monthly Elliott Wave chart for the Global X Silver Miners ETF (SIL) reveals a significant low of $14.94 in 2016. This marks the completion of a long-term cycle, labeled as wave ((II)) in the Grand Super Cycle. Since then, SIL has been advancing in a sustained uptrend, unfolding as a nested impulsive wave structure. From the 2016 low, wave I surged to $54.34, followed by a corrective wave II that retraced to $16. Subsequently, SIL resumed its ascent in wave ((1)), reaching $52.87. Afterwards, it pullback in wave ((2)) to $21.26. Currently, wave ((3)) is underway, progressing as an internal impulsive structure. As long as the pivotal low of $16 remains intact, the ETF is expected to continue its upward trajectory.

Silver Miners ETF Daily Elliott Wave Chart​


The daily chart for the Global X Silver Miners ETF (SIL) indicates that the rally from the September 26, 2022 low is unfolding as an impulsive wave structure. Wave (1) concluded at $42.29, followed by a corrective pullback in wave (2) that bottomed at $31.37. The internal structure of wave (2) formed a zigzag pattern: wave A declined to $34.48, wave B rallied to $40.06, and wave C completed the correction at $31.37, finalizing wave (2) on a higher degree. The ETF has since extended upward in wave (3). From the wave (2) low, wave 1 peaked at $38.34, with a subsequent pullback in wave 2 concluding at $33.11. As long as the pivotal low of $22.57 remains intact, the ETF is expected to continue its upward trajectory.

Source: https://elliottwave-forecast.com/stock-market/silver-miners-etf-sil-acceleration-phase-begun/
 
Hello fellow traders,

In this technical article, we are going to present Elliott Wave charts of GOLD (XAUUSD) . As our members know we are long in GOLD from previous equal legs area. As a result, members are now benefiting from profits in positions that remain risk-free. Recently, the commodity completed another intraday correction within the Equal Legs zone. In the following sections, we will outline the current Elliott Wave count.

GOLD 1 Hour Elliott Wave Analysis 07.11.2025

GOLD has completed a 5-wave structure from the 3246.33 low, labeled as wave ((i)) in black. It is currently correcting in wave ((ii)) black, which is unfolding as a Double Three pattern. The correction appears incomplete at this stage. We anticipate further short-term weakness toward the Equal Legs area at 3290.56–3256.9. In that zone, we expect buyers to emerge and initiate another rally toward new highs. Therefore, we recommend avoiding short positions within this area.

Nearly 90% of traders fail because they don’t understand how to read market patterns. Are you among the top 10% who do?

Challenge yourself with this advanced Elliott Wave Test and find out.

Official trading strategy on How to trade 3, 7, or 11 swing and equal leg is explained in details in Educational Video, available for members viewing inside the membership area.

GOLD

GOLD 1 Hour Elliott Wave Analysis 07.11.2025

A few days later, GOLD completed the pullback exactly at the previously mentioned zone. As expected, the commodity found buyers and produced a decent bounce. Wave ((ii)) ended at the 3283.39 low. The short-term cycle from the July 9th low now shows a sequence of higher highs, confirming the continuation of the rally. While price remains above the 3283.39 low, the next expected target area is 3403.85–3432.44.

Reminder for members: Our chat rooms in the membership area are available 24 hours a day, providing expert insights on market trends and Elliott Wave analysis. Don’t hesitate to reach out with any questions about the market, Elliott Wave patterns, or technical analysis. We’re here to help.

GOLD

Source: https://elliottwave-forecast.com/commodities/gold-xauusd-elliott-wave-equal-legs-2/
 
Hello everyone! In today’s article, we’ll examine the recent performance of Advanced Micro Devices ($AMD) through the lens of Elliott Wave Theory. We’ll review how the reaction from the April 2025 blue box areas unfolded as an impulsive 5 waves and discuss what’s next. Let’s dive into the structure and expectations for this stock.

ABC correction (Zig-Zag)​

$AAL

5 Wave Impulse Structure​

$XME

The April 2025 Setup​

$AMDThe above chart illustrates our Elliott Wave forecast for $AMD as of April 2025. At this point, $AMD was depicted as looking to complete a potential ABC zig-zag correction, specifically reaching a blue box area between approximately $101.11 and $47.64. This blue box represented a high-probability reversal zone, calculated using Fibonacci extensions (1 and 1.618 respectively, of prior waves).

The July 2025 Soar​

$AMDFast forward to July 13, 2025, as seen above. This chart strikingly demonstrates the strong reaction from the April 2025 blue box area. From the low within the blue box, $AMD has indeed surged, exhibiting a clear five-wave impulsive structure. Comparing the two charts, the most significant extension higher is evident in the current price action. In the April chart, the market was still in the corrective phase, potentially forming the (II) wave within the blue box. The July chart shows that from that blue box low, $AMD has embarked on a powerful rally. The rally has unfolded with distinct sub-waves, particularly noticeable in the extension of wave 3, which then corrected in wave 4, and is currently extending higher in wave (3).

The 90% Rally and What’s Next

From the approximate low of the blue box around $75, $AMD has climbed to current levels near $146. This represents an impressive gain of approximately 90%. This strong rally confirms the validity of the Elliott Wave count. It anticipated a bounce from this key support area.

The current chart shows $AMD looking for further extensions in wave (3) and (5). The target of $154 is still ahead. This suggests further upside potential to complete this current impulse.

Conclusion

The Elliott Wave analysis successfully identified a high-probability reversal zone in $AMD back in April 2025. This led to a remarkable 90% rally. The price action since then has unfolded precisely as an impulsive five-wave structure. This reinforces the bullish outlook. With the $154 target still on the horizon, $AMD continues to demonstrate strong momentum. Traders will be watching for the completion of this current impulse before anticipating any significant corrective moves.

Source: https://elliottwave-forecast.com/st...oars-92-blue-box-area-154-target-still-ahead/
 
Alnylam Pharmaceuticals Inc., (ALNY) discovers, develops & commercializes therapeutics based on ribonucleic acid interference. It comes under Healthcare – Biotech sector & trades as “ALNY” ticker at Nasdaq.

ALNY favors rally in bullish weekly sequence & expect continuation against April-2025 low. It favors rally in ((3)) of III against 4.07.2025 low & pullback in 3, 7 or 11 swings offers buying opportunity.

ALNY - Elliott Wave Latest Weekly View:​

It ended ((I)) at $140 high since inception in June-2025 & ((II)) pullback at $31.38 low in October-2016. Above there, it is showing nest as the part of (III) of ((III)). It placed (I) of ((III)) at $153.99 high in March-2018 & (II) at $60.27 low in December-2018. Within (III), it placed I at $242.97 high in December-2022 as diagonal & II at $141.97 low in April-2024. It placed ((1)) at $212 high, ((2)) at $117.58 low, ((3)) at $236.80 high, ((4)) at $181.65 low & ((5)) at $242.97 high. It corrected II in zigzag correction ended at 0.50 Fibonacci retracement of I.

Above April-2024 low, it gapped up with ((1)) of III that broke price channel with high momentum. It ended ((1)) of III at $304.39 high in October-2024. It ended ((2)) pullback at $205.87 low in 3 swings correction at $205.87 low on 4.07.2025. Within ((2)), it placed (A) at $229.85 low, (B) at $300.90 high & (C) at $205.87 low in blue box area. It already broke to new high in (1) & expect small upside before pullback in (2) of ((3)). We like to buy the pullback of (2) in 3, 7 or 11 swings at extreme area, when reach. Later, we expect (3) to extend higher & erase momentum divergence to confirm rally to be ((3)) towards $368.5 - $469.3 area. Alternatively, if new high comes with momentum divergence, then it can be diagonal of ((1)) in 5 swings, before correcting against April-2024 low.

Source: https://elliottwave-forecast.com/stock-market/alny-eyes-rally-toward-368-469-zone/
 
In this technical blog, we will look at the past performance of the 1-hour Elliott Wave Charts of EUROSTOXX (SX5E). We presented to members at the elliottwave-forecast. In which, the rally from 07 April 2025 unfolded as an impulse structure. And showed a higher high sequence favored more upside extension to take place. Therefore, we advised members not to sell the index & buy the pullback in 3, 7, or 11 swings. Based on Elliott wave hedging area looking to get 3 wave reaction higher at least. We will explain the structure & forecast below:

EUROSTOXX (SX5E) 1-Hour Elliott Wave Chart From 6.17.2025​

EUROSTOXX Index (SX5E): A Classic Reaction Higher from Equal Legs

Here’s the 1-hour Elliott wave chart from the 6.17.2025 Asia update. In which, the cycle from the 09 April low ended in wave 3 as an impulse structure at 5467.28 high. Down from there, the index made a pullback in wave 4 to correct that cycle. The internals of that pullback unfolded as Elliott wave flat structure where wave ((a)) ended at 5252.94 low. Then wave ((b)) bounce ended at 5435.42 high and wave ((c)) was expected to reach the Elliott wave hedging area at 5219.79- 5086.10 equal legs area. From there, buyers were expected to appear looking for next extension higher or do a 3 wave reaction higher at least.

EUROSTOXX (SX5E) Latest 1-Hour Elliott Wave Chart From 7.15.2025​

EUROSTOXX Index (SX5E): A Classic Reaction Higher from Equal Legs

This is the latest 1-hour Elliott wave Chart from 7.15.2025 London update. In which the EUROSTOXX (SX5E) is showing a strong reaction higher taking place, right after ending the flat correction within the equal legs area. Allowed members to create a risk-free position shortly after taking the long position. Since than index has already made a new high confirming the next extension higher.

Source: https://elliottwave-forecast.com/stock-market/eurostoxx-sx5e-classic-reaction-higher-equal-legs/