Elliott Wave Analysis by EWF

Hello fellow traders. In this technical blog we’re going to take a quick look at the Elliott Wave charts of AMD stock published in members area of the website. As our members know, AMD is showing an impulsive bullish sequence in the cycle from the 75.22 low. Recently, the stock has completed a 3-wave pullback against the 107.08 low. The pullback formed an Elliott Wave Zigzag pattern, after which we saw a further rally toward new highs. In the following text, we will explain the Elliott Wave pattern and present the target areas.

Before we take a look at the real market example, let’s explain Elliott Wave Zigzag pattern.

Elliott Wave Zigzag is the most popular corrective pattern in Elliott Wave theory . It’s made of 3 swings which have 5-3-5 inner structure. Inner swings are labeled as A,B,C where A =5 waves, B=3 waves and C=5 waves. That means A and C can be either impulsive waves or diagonals. (Leading Diagonal in case of wave A or Ending in case of wave C) . Waves A and C must meet all conditions of being 5 wave structure, such as: having RSI divergency between wave subdivisions, ideal Fibonacci extensions and ideal retracements.

AMD

AMD H1 Elliott Wave Pre-Market Analysis 06.13.2025​

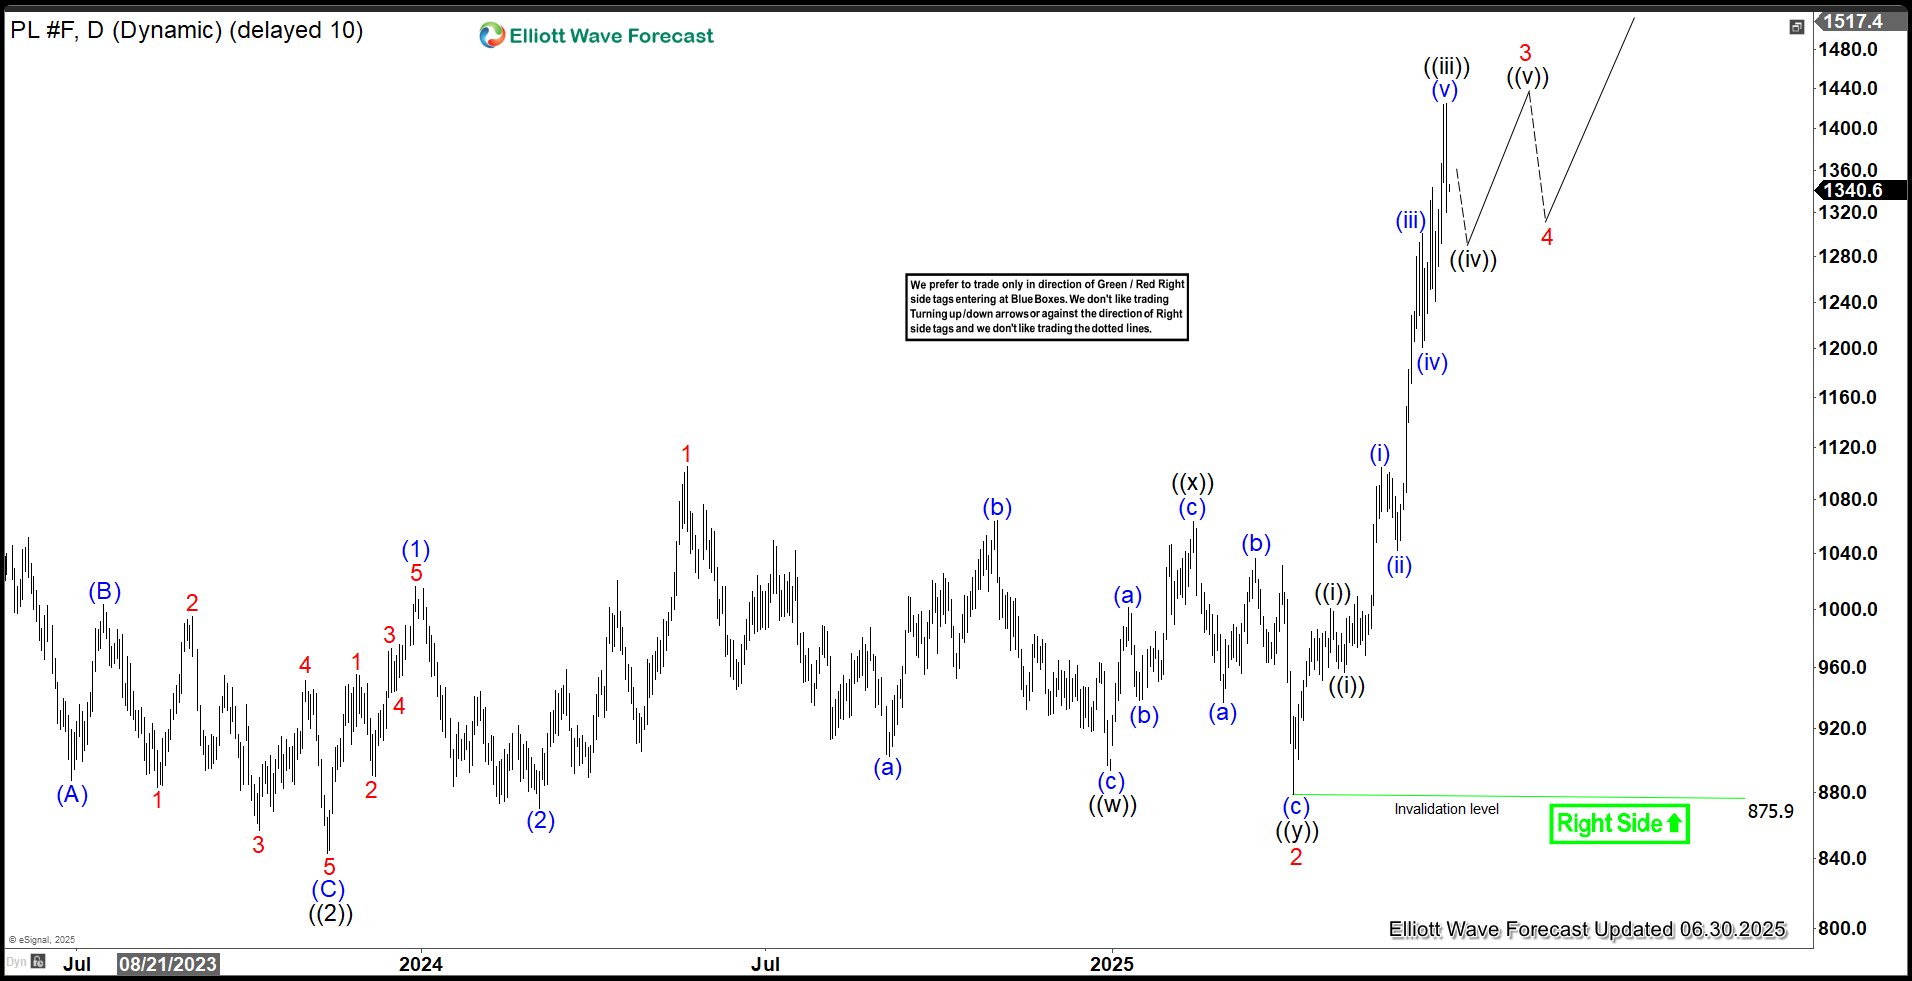
AMD ended the cycle from the 107.08 low as a 5-wave pattern labeled as wave 1 in red. Currently, it is undergoing a 3-wave pullback labeled as wave 2 in red, unfolding as an Elliott Wave Zigzag pattern. When we break down the structure, we can clearly count 5 waves in the first leg ((a)), followed by a 3-wave bounce in ((b)), and the stock is now trading within the ((c)) leg, which could still see a marginal new low to complete its own 5-wave structure. We do not recommend trading at this stage and continue to favor the long side in the stock.

How well do you really know the stock market?
Take our Stock Market Quiz and put your knowledge to the test!

Note: Keep in mind not every chart is trading recommendation. Official trading strategy on How to trade 3, 7, or 11 swing and equal leg is explained in details in Educational Video, available for members viewing inside the membership area.

AMD

AMD H1 Elliott Wave Pre-Market Analysis 06.13.2025​

The stock has completed the red wave 2 correction as an Elliott Wave Zigzag pattern, followed by a rally to new highs. It is now displaying a higher high sequence in the cycle from the 107.1 low, suggesting a potential for further upside. The next target area stands at 132.23–136.27.

Keep in mind that market is dynamic and presented view could have changed in the mean time. You can check most recent charts with target levels in the membership area of the site. Best instruments to trade are those having incomplete bullish or bearish swings sequences. We put them in Sequence Report and best among them are shown in the Live Trading Room.

New to Elliott Wave ? Check out our Free Elliott Wave Educational Web Page and download our Free Elliott Wave Book.

AMD

Source: https://elliottwave-forecast.com/stock-market/amd-elliott-wave-bullish-sequences/
 
AT&T Inc. (T) is an American multinational telecommunications holding company headquartered in Dallas, Texas. It is the world's largest telecommunications company by revenue and the third-largest provider of mobile telephone services in the U.S.

AT&T stock continues to gain traction as it approaches the $29.03 resistance zone. Investors are encouraged by its strong free cash flow, consistent dividend yield, and aggressive fiber network expansion. Recent earnings have met expectations, and analysts forecast modest revenue growth supported by wireless and broadband demand. Additionally, the company’s focus on debt reduction and operational efficiency adds to its appeal.

From a price action perspective, $T is developing an impulsive structure, suggesting further upside potential. The stock trades above key moving averages, and momentum indicator like RSI remain supportive. If it breaks above $29.03, a new bullish leg could unfold. Until then, traders may look for consolidation or a pullback as a buying opportunity.

AT&T (T) Monthly Chart September 2024

AT&T (T) Monthly Chart September 2024
In the last monthly chart in September 2024, we spotted a strong rally from the Blue Box area. That rally looked promising but did not confirm that wave ((II)) ended at $13.43. To validate the end of wave ((II)), the market needed to break above wave ((I))'s high. Until then, the stock had room to form lower structures. Despite that, T performed well and signaled a developing impulsive trend.

AT&T (T) Weekly Chart February 2025

Over the last 5 months, the stock formed a clear five-swing structure, favoring an impulsive outlook. Wave ((3)) ended at the $24.03 high. Then, the market corrected lower and completed wave ((4)) at the $21.38 low. After that, T pushed higher. Strong earnings—better than expected—sparked an aggressive rally. This confirmed continued strength. We tracked wave ((5)) in progress. Specifically, the market was advancing in wave (3) of ((5)).

AT&T (T) Weekly Chart June 2025


The stock price continues rising as expected, suggesting an extension in wave ((3)) as you can watch in the chart. Wave ((3)) likely ends at 29.03 high and wave ((4)) finds support at 25.10 low. Now, the market must break above 29.03 to drive wave ((5)) toward the 30.02–31.55 area. A bearish reaction in that zone confirms completion of impulse wave I. Still, upward extensions remain possible.

Alternatively, if the market fails to break 29.03, wave ((4)) may still be unfolding. In that case, T could drop toward 24.66–23.72 to finish wave ((4)). Then, the bullish move continues in wave ((5)). A clean break above 29.03 avoids this scenario.

We’ll keep tracking the structure—stay tuned as the market unfolds the next wave—trade smart!

Source: https://elliottwave-forecast.com/stock-market/t-final-wave-correction-opportunity/
 
After completing the bearish cycle from November 2024 at the extreme of a double three correction, TXN has surged by over 45% from the blue box. This rally is re-establishing the all-time bullish cycle and specifically the cycle from October 2002. Buyers are expected to buy the dip as the upside remains favored.

Texas Instruments (TXN) is a global semiconductor company known for designing and manufacturing analog and embedded processing chips. With products used in everything from industrial equipment to personal electronics, TXN plays a critical role in powering modern technology. Its consistent innovation and strong market presence make it a closely watched stock in the tech sector.

TXN completed a long-term grand supercycle degree wave ((II)) in October 2002. At that low, it barely traded for $13. Meanwhile, the next two decades saw an astronomical rise in the TXN stock prices as the grand supercycle degree wave ((III)) emerged. Wave (I) of ((III)) finished in August 2007 at $39.6. Thereafter, a pullback for wave (II) followed to barely $13.4 in December 2008. Wave (III) started in December 2008 and the stock established a bullish sequence after breaking it's previous record high $99.8 (March 2000 peak). The stock established new peak at $202.2 in October 2021. At the peak of October 2021, the stock established wave III of (III) of ((III)). Afterwards, it started a pullback for wave IV that lasted till October 2023. However, it would soon rally from that low and established a new high of $220.38 in November 2024.

TXN Elliott Wave Analysis - Daily Chart

TXN

The TXN daily chart above shows the record high of 8th November 2024 as the wave ((1)) of I. Afterwards, a pullback started and completed a 7-swing setup at the blue box. In a bullish sequence, buyers buy at the extreme of a 3/7/11 swing pullback. We identify the extreme with a blue box where we expect the next price pivot to be. The stock went deep into the blue box and then rallied to show completion for wave ((2)). In addition, the response rally from the 139.95 pivot shows an emerging impulse wave structure with an extended 3rd wave. It appears the most recent dip is wave 4 of (1) and may soon finish a double three structure on the shorter cycles before returning upside. With this clear sequence, we will like to remain buyers. The next opportunity for buyers will be at the extreme of wave (2). Eventually, wave ((1)) high will be breached to establish a new record high. Thereafter, buyers should continue to buy 3/7/11 swing pullbacks from the blue box.

Source: https://elliottwave-forecast.com/stock-market/txn-rallies-45-bluebox-bullish-sequence/
 
AUDCHF is on the verge of completing a multi-decade bearish cycle from April 1992. However, it appears sellers will continue to push in the shorter cycles. Thus, the pair should attract short-term sellers, while long-term sellers should watch out.

AUDCHF has been in a long-term bearish cycle from April 1992 in a somewhat corrective sequence. The structure appears to be a double zigzag — a 7-swing structure. Wave (W) of the supercycle degree ended in October 2008. Afterwards, the corresponding wave (X) bounce followed and ended in August 2012. Since August 2012, the pair has been in another bearish cycle for wave (Y). Meanwhile, wave (Y) has now reached the 100% extension of wave (W) from (X) — which could indicate completion. It's also notable that wave C of (Y) is completing an ending diagonal structure from September 2014. Overall, the entire cycle from April 1992 may very well end within the 0.5385–0.4213 extreme zone.

A closer look at the diagonal wave C shows its sub-waves — waves ((1)), ((2)), ((3)), and ((4)) — ended in January 2015, February 2017, March 2020, and February 2021 respectively. Thus, the last known bearish cycle within this long-term bearish market is wave ((5)) of C of (Y), which started in February 2021.

AUDCHF Weekly Chart Analysis

[caption id="attachment_963104" align="aligncenter" width="1024"]AUDCHF AUDCHF Weekly[/caption]
On the weekly chart above, the wave ((4)) cycle from February 2021 is evolving as a double zigzag structure. Wave (W) of ((5)) ended in August 2023. Afterwards, a corrective bounce for wave (X) followed to the high of May 2024 and then returned to the downside. The break of the wave (W) low opened fresh opportunities for sellers from the extremes of bounces.

The weekly chart shows the price still in wave A of (Y) of ((5)), likely to finish a diagonal structure. A closer look shows price has completed wave ((iv)) of A and is now in ((v)) of A. Thus, it supports selling bounces from the extremes of 3/7/11 swing structures on the shorter cycle, as the wave ((5)) cycle could extend to the 0.4435–0.4043 extreme — which is within the 0.5385–0.4213 extreme.

AUDCHF H4 Chart Analysis

[caption id="attachment_963105" align="aligncenter" width="1024"]AUDCHF AUDCHF, H4[/caption]
On the H4 chart above, the wave ((iv)) bounce found resistance at the extreme (blue box), and sellers sold. In the coming days, the pair is expected to reach at least 0.5178–0.5132, where sellers from the blue box could take some profit.

Going forward, sellers should either sell higher if ((iv)) makes a double correction higher, or wait for ((v)) to break below the ((iii)) low and then sell the next 3/7/11 swing bounce off the blue box. Ultimately, the next big opportunity will be to sell off the extreme of wave B, as the weekly chart shows.

Source: https://elliottwave-forecast.com/forex/audchf-extends-bearish-sequence-bluebox/
 
As our members know we have had many profitable trading setups recently. In this technical article, we are going to present another Elliott Wave trading setup we got in Gold Miners ETF GDX . The ETF completed its correction precisely at the Equal Legs zone, referred to as the Blue Box Area. In the following sections, we will delve into the specifics of the Elliott Wave pattern and explain trading setup.

GDX Elliott Wave 1 Hour Chart 06.09.2025​

GDX ended cycle from the 44.73 low as a 5 waves rally. Currently it's doing a correction that is having a form of Elliott Wave Zig Zag Pattern. The pull back has reached the extreme zone at 51.87-50.74 area( buying zone) . We recommend members to avoid selling GDX. As the main trend remains bullish, we anticipate at least a 3-wave bounce from this Blue Box area. Once the price touches the 50 fibs against the ((b)) black connector, we’ll make positions risk-free and set the stop loss at breakeven and book partial profits. On other hand, breaking below the 1.618 Fibonacci extension level at 50.74 would invalidate the trade.

90% of traders fail because they don’t understand market patterns. Are you in the top 10%? Test yourself with this advanced Elliott Wave Test

Official trading strategy on How to trade 3, 7, or 11 swing and equal leg is explained in details in Educational Video, available for members viewing inside the membership area.

Quick reminder on how to trade our charts :

Red bearish stamp+ blue box = Selling Setup
Green bullish stamp+ blue box = Buying Setup
Charts with Black stamps are not tradable.

GDX

GDX Elliott Wave 1 Hour Chart 06.12.2025​

The ETF found buyers, just as expected. GDX has made a solid rally from our Buying Zone. As a result, any long positions entered at the Blue Box are now risk-free. We’ve moved our stop loss to breakeven and already booked partial profits. We are looking for a break above 1 red peak ( June 5th).

Reminder for members: Our chat rooms in the membership area are available 24 hours a day, providing expert insights on market trends and Elliott Wave analysis. Don’t hesitate to reach out with any questions about the market, Elliott Wave patterns, or technical analysis. We’re here to help.

GDX

Source: https://elliottwave-forecast.com/stock-market/gold-miners-gdx-buying-blue-box/
 
Hello fellow traders. In this technical article, we are going to talk about another Elliott Wave trading setup we got in EURUSD . The pair has completed its correction exactly at the Equal Legs zone, also known as the Blue Box Area. In this article, we’ll break down the Elliott Wave Forecast and explain the logic behind the trading setup in detail.

EURUSD Elliott Wave 1 Hour Chart 06.18.2025​

The price is showing a lower-low sequence from the peak. As of now, correction looks incomplete. The price action suggests that EURUSD correction is still in progress, and we expect another leg down toward the 1.14683- 1.13774 area, where we are looking to re-enter as buyers.

We recommend members avoid selling EURUSD. As the main trend remains bullish, we anticipate at least a three-wave bounce from the Blue Box area.
Once the price reaches the 50% Fibonacci retracement against the red b connector, we’ll make the position risk-free by moving the stop loss to breakeven and booking partial profits.

Did you know ? 90% of traders fail because they don’t understand market patterns. Are you in the top 10%? Test yourself with this advanced Elliott Wave Test

Official trading strategy on How to trade 3, 7, or 11 swing and equal leg is explained in details in Educational Video, available for members viewing inside the membership area.

Quick reminder on how to trade our charts :

Red bearish stamp+ blue box = Selling Setup
Green bullish stamp+ blue box = Buying Setup
Charts with Black stamps are not tradable.

EURUSD

EURUSD Elliott Wave 1 Hour Chart 06.23.2025​

EURUSD has made another wave down and completed correction right at the Blue Box area at the 1.14425 low. The pair found buyers as expected, making decent reaction. The bounce reached 50 fibs against the b red connector. Consequently, any long positions from the Blue Box should now be risk-free. We’ve already secured partial profits. Key level comes at 1.14425 low. While above that level more upside should be ideally seen.


Source: https://elliottwave-forecast.com/forex/eurusd-trade-setup-buying-blue-box-2/
 
Welltower Inc., (WELL) is the residential wellness & healthcare infrastructure company. It engages in the seniors housing operators, post-acute providers & health systems to fund the real estate infrastructure. They operating in the business include Senior Housing Operating, Triple-Net & Outpatient medical in United States, Canada & UK. It comes under “Real Estate” sector & trades as “WELL” ticker at NYSE.

WELL favors impulse sequence from October-2022 low & expects targeting above $176 against April-2025 low. Buyers can look for opportunity in 3, 7 or 11 swings pullback in (2) at extremes against $130.29 low.

WELL - Elliott Wave Latest Weekly View:​

In weekly, it ended (I) at $99.43 high in April-2022 & (II) at $56.50 low October-2022 low. Above there, it favors rally in to I of (III) in bullish sequence. Within I sequence, it placed ((1)) at $78.54 high, ((2)) at $65.18 low, extended ((3)) at $158.55 high & ((4)) at $130.29 low. The ((2)) pullback was 0.618 Fibonacci retracement of ((1)), while ((4)) ended higher above 0.382 level. Within ((3)), it placed (1) at $94.63 high, (2) at $87.87 low, (3) at $140.19 high, (4) at $123.11 low as flat & finally (5) at $158.55 high.

It ended ((4)) in 3 swings pullback at $130.29 low on 4.09.2025 low. Above there, it favors rally in (1) of ((5)) & expects one more push higher to finish the diagonal sequence before (2) correction start. It placed 1 at $153.79 high, 2 at $142.65 low, 3 at $155.70 high, 4 at $148.60 low & favors final push towards $157.5 - $160.25 area to finish (1). We like to buy the next pullback in (2) in 3, 7 or 11 at extremes against 4.09.2025 low. Buyers can look for target in to $165.3 - $176.1 area at least in next leg.

Source: https://elliottwave-forecast.com/stock-market/welltower-well-bullish-outlook-targeting-176/
 
Hello fellow traders. In this technical article we’re going to take a quick look at the Elliott Wave charts of OIL , published in members area of the website. As our members are aware, OIL is now potentially forming irregular Flat pattern against the 55.25 low. Recently we saw a clear 3-wave pullback, followed by the expected rally and then sharp drop again. In this post, we will explain the Elliott Wave count in detail.

OIL 1-Hour Chart Analysis: 06.16.2025

The current view suggests that OIL is about to complete a 3-wave pullback from the peak, labeled as wave ((iv)) in black. The price has already reached the extreme zone at 70.68–66.50, from which we can expect at least one more push higher before another pullback.

We expect OIL to continue attracting intraday buyers in 3, 7, and 11 swings, as long as the price remains above the 66.50 level (1.618 Fibonacci extension).

Reminder : You can learn more about Elliott Wave Patterns at our Free Elliott Wave Educational Web Page.

OIL

OIL 1-Hour Chart Analysis: 06.18.2025

OIL found buyers as expected and turned higher from the marked equal legs area (buyers’ zone). Wave ((iv)) ended at the 67.92 low, and we are now looking for a break above the wave ((iii)) peak. As our members know, the first target for wave ((v)) typically comes at the inverse 1.236–1.618 Fibonacci extension, which in this case lies in the 78.08–81.23 region.
Although OIL has the potential for further bullish continuation, we should be mindful of this zone, as it represents a strong technical area from which a deeper pullback may occur.

90% of traders fail because they don’t understand market patterns. Are you in the top 10%? Test yourself with this advanced Elliott Wave Test


OIL 1-Hour Chart Analysis: 06.24.2025

OIL made a strong reaction from the inverse 1.236–1.618 Fibonacci extension zone. The decline appears to be unfolding as an impulsive 5-wave pattern, which is still in progress. The current view suggests that wave (4) in blue is taking the form of an Irregular Flat pattern. As it stands, we are still likely missing at least one more leg down to complete the 5-wave structure in the final leg of the proposed Flat. Once wave (4) completes, we expect to see a further rally in the commodity, ideally breaking above the 78.41 peak.

Reminder for members: Keep in mind that market is dynamic and presented view could have changed in the mean time. Our chat rooms in the membership area are available 24 hours a day, providing expert insights on market trends and Elliott Wave analysis. Don’t hesitate to reach out with any questions about the market, Elliott Wave patterns, or technical analysis. We’re here to help.

OIL

Source: https://elliottwave-forecast.com/commodities/oil-cl_f-elliott-wave-path-2/
 
Hello everyone! In today’s article, we’ll examine the recent performance of S&P 500 ETF ($SPY) through the lens of Elliott Wave Theory. We’ll review how the rally from the April 21, 2025 low unfolded as a 5-wave impulse followed by a 7-swing correction (WXY) and discuss our forecast for the next move. Let’s dive into the structure and expectations for this ETF.

5 Wave Impulse + 7 Swing WXY correction​

$SPY 1H Elliott Wave Chart 6.22.2025:​

$SPYIn the 1-hour Elliott Wave count from June 22, 2025, we saw that $SPY completed a 5-wave impulsive cycle at 5 of (3). As expected, this initial wave prompted a pullback. We anticipated this pullback to unfold in 7 swings, likely finding buyers in the equal legs area between $592.48 and $585.08.

This setup aligns with a typical Elliott Wave correction pattern (WXY), in which the market pauses briefly before resuming its primary trend.

$SPY 1H Elliott Wave Chart 6.23.2025:​

$SPY
The next update, from June 23, 2025, shows that the ETF bounced as predicted. Currently, it is trading higher in wave 1 of (5) looking for continuation higher in 5 waves towards 627 – 647 area before another pullback can happen.

Conclusion

In conclusion, our Elliott Wave analysis of S&P 500 ETF ($SPY) suggests that it remains supported against April 2025 lows. As a result, traders should buy the dips and monitor the $627–$647 zone as the next potential target. In the meantime, keep an eye out for any corrective pullbacks that may offer entry opportunities. By applying Elliott Wave Theory, traders can better anticipate the structure of upcoming moves and enhance risk management in volatile markets.

Source: https://elliottwave-forecast.com/st...-extreme-areas-offering-buying-opportunities/
 
ARM Holdings plc is a relatively new entrant to public markets, yet its technological foundation is anything but inexperienced. Renowned for pioneering energy-efficient, high-performance processor designs, ARM powers billions of devices globally. Its recent IPO signals a strategic leap, positioning the company for strong, long-term growth as demand for smart, connected technologies accelerates.

ARM enjoys strong positioning in the AI and mobile computing boom. Its licensing model delivers recurring revenue and scalability across multiple markets. Moreover, the company’s robust ecosystem encourages adoption and long-term customer relationships, securing its role in tech’s future.

ARM’s chart reflects solid upside momentum above key moving averages. Bullish breakouts signal trend strength, supported by healthy trading volume. Additionally, positive momentum indicators suggest continued buying interest, reinforcing current price action.

ARM Daily Chart June 2025

In the daily chart above, ARM Holdings began a strong impulsive rally ending wave (I) at 188.75 high. After that, the stock entered a flat correction as wave (II), retracing into the 90.78–68.99 Blue Box—a high-probability reversal zone. The pullback bottomed at 80.00 low, completing wave (II) and triggering a sharp bullish reaction. That move launched a wave ((1)) impulse, which continues unfolding with momentum. Once wave ((1)) completes, expect a pullback in wave ((2)). Typically, wave ((2)) unfolds in 3, 7, or 11 swings. After that, the broader rally is likely to resume. Traders should monitor the correction for entry opportunities.

ARM Daily Alternative Chart June 2025

ARM Weekly Alternative Chart June 2025

While the current reaction from the Blue Box supports the bullish scenario, an alternate view suggests wave (II) may not be completed. In this case, the decline into the 80.00 low would mark wave w of a double correction. The current bounce would then be part of a wave x connector, setting the stage for another leg lower. If so, wave y could take the stock below 80.00 to complete wave (II) and offer a high probability buying opportunity.

To invalidate this alternate scenario, price must break above the 188.75 high. Until then, both views remain valid, and traders should stay flexible while tracking the structure in real time. Stay tuned as the market unfolds the next wave—trade smart!

Source: https://elliottwave-forecast.com/stock-market/arm-breakout-potential-connected-world/
 
In this technical blog, we are going to take a look at the past performance of USDCHF 1-Hour Elliott wave Charts that we presented to our members. In which, the decline to 6.13.2025 low took place as an impulsive structure and showed a lower sequence calling for more downside to happen. Therefore, our members knew that selling the bounces in the direction of the right side tag remained the preferred path. We will explain the Elliott wave structure & selling opportunity our members took below:

USDCHF 1-Hour Elliott Wave Chart From 6.18.2025​

USDCHF Reaches New Lows: A Perfect Reaction from the Blue Box Zone

USDCHF 1-Hour Elliott Wave Chart from 6.18.2025 London update. In which the decline to $0.8052 low ended the decline from 5.12.2025 peak & made a bounce higher. Up from there, the pair made a bounce towards the blue box area. The internals of that bounce unfolded as zigzag structure where wave a ended at $0.8148 high. Wave b pullback ended at $0.8085 low. And wave c was expected to reach the blue box area. From there, sellers were expected to appear looking for further downside or a minimum 3-wave reaction lower.

$USDCHF 1-Hour Elliott Wave Chart From 6.25.2025​

USDCHF Reaches New Lows: A Perfect Reaction from the Blue Box Zone

This is the latest 1-Hour view from the 6.25.2025 Asia update. In which the pair is showing a reaction lower taking place from the blue box area. Allowing shorts to get into a risk-free position shortly after taking the position. Since then the pair has already made a new low below 6.13.2025 low confirming the next extension lower towards $0.7790- $0.7528 target area.

Source: https://elliottwave-forecast.com/forex/usdchf-reaches-new-lows-perfect-reaction/
 

After completing wave II, Coinbase begins a powerful bullish impulse in wave III, with strong momentum and higher targets ahead.​

Coinbase Global, Inc. (NASDAQ: COIN) is currently showing strong bullish momentum as the stock advances in a new impulsive sequence. The daily Elliott Wave chart suggests that COIN has likely completed a significant corrective wave II and is now advancing within wave (3) of a larger degree impulse III. This setup supports the possibility of further upside in the coming months.

After bottoming in early 2023, COIN began a multi-wave rally which unfolded as wave I. A corrective pullback in wave II followed, respecting the Fibonacci support region and maintaining a bullish structure. This correction ended above the key invalidation level of $143.14. The move from there has been sharp and impulsive, supporting the idea that wave III is now underway.


Currently, wave (3) is progressing, and the chart suggests that wave (4) may develop next as a shallow correction before the stock pushes higher in wave (5). The "Right Side" tag is clearly marked on the chart, indicating the preferred direction is to the upside. In addition, the message “We Do Not Recommend Selling” warns traders not to fight the trend.

The price action respects Elliott Wave rules, with clean subdivision and momentum confirmation. As long as COIN holds above the invalidation level at $143.14, the bullish outlook remains firmly in place.

Conclusion:​

In conclusion, Coinbase looks poised to continue higher as it advances through wave (3) of a new bullish cycle. The trend remains strong, and dips should present buying opportunities. Long-term investors and active traders may consider favouring the long side, especially while the structure holds above the key support.

Source: https://elliottwave-forecast.com/st...sh-rally-elliott-wave-analysis-points-upside/
 
TMUS may have started a new bullish cycle after ending the bearish cycle from 03.03.2025. Meanwhile, the corrective pullback ended with a 7-swing structure within a blue box. In the coming weeks, this resurgence could advance to a new bullish cycle.

T-Mobile US (NASDAQ: TMUS) is a leading U.S. wireless carrier, known for its aggressive pricing and nationwide 5G network. Headquartered in Bellevue, Washington, it is majority-owned by Deutsche Telekom. Since merging with Sprint in 2020, T-Mobile has become the third-largest U.S. telecom provider. It is listed on the NASDAQ-100 and S&P 500 indices.

After completing wave IV in January 2022 on the weekly chart, TMUS started a bullish cycle. In the last update on this stock, I explained this bullish cycle on the weekly chart. You might want to read it here. Wave V stated from that low and completed sub-waves ((1)), ((2)), ((3)), ((4)). Meanwhile, wave ((5)) started in January 2025 where wave ((4)) ended. From the low of January 2025, the stock completed wave (1) of ((5)) in March 2025 and then started a corrective pullback for wave (2). It's important to note that there is a clear incomplete bullish sequence from the January 2022 low. Thus, the pullback, if it completes a 3/7/11 swing setup, should end at the extreme zone where buyers should enter new trade. In the last update, I used the chart below to track the pullback. In addition, I shared the blue box where buyers should buy from lower prices.

TMUS Elliott Wave Analysis - 05.24.2025 Update

[caption id="attachment_961582" align="aligncenter" width="1024"]TMUS TMUS, Daily Chart[/caption]
In the last update I shared the TMUS daily chart above. The chart identified a 7-swing structure for the wave (2) pullback. In addition, I shared the 229.98-206.41 as the blue box zone where buyers should go long on this stock.

TMUS Elliott Wave Analysis (Latest) - 06.28.2025 Update

[caption id="attachment_963527" align="aligncenter" width="1024"]TMUS TMUS Daily[/caption]
Just over a month after, the stock dropped as expected to the blue box and bounced. The chart above shows the updated daily. The bounce from the blue box is swift and should make at least a 3-swing (5-3-5) bounce although 5-wave bullish cycle for wave (3) toward 304-331 is more ideal. In trading numbers, traders who bought at the blue box could take partial profit at 238.5 and adjust the rest to either the low of wave (2) or to 229.98 (breakeven).

TMUS H4 Chart Analysis: What Next?

[caption id="attachment_963528" align="aligncenter" width="1024"]TMUS TMUS H4[/caption]
The H4 chart above shows the wave count of this resurgence. It shows a potential 5-wave separation from the blue box to finish wave ((i)) of 1 of (3) of ((5)). After that, it should push higher again from a 3/7/11 swing pullback to complete a 3-swing bounce. From there, we will see where it goes.

Source: https://elliottwave-forecast.com/stock-market/tmus-finds-blue-box-support/
 
Platinum (PL) has broken out of its bearish channel this month, signaling strong bullish trend momentum. This article explores the latest long-term Elliott Wave technical outlook.

Platinum (PL) Monthly Elliott Wave Chart​


The monthly platinum chart indicates that the Grand Cycle wave ((II)) correction concluded at 562. The metal has since turned bullish, advancing in wave ((III)) with a nested impulse structure. From the wave ((II)) low, wave (I) of ((III)) peaked at 1348.2, followed by a pullback in wave (II) of ((III)) ending at 802.1. Platinum has since resumed its upward trajectory, breaking above the descending bearish trendline from the March 2008 peak, confirming a strong bullish shift. The metal is expected to continue rallying within its nested impulsive structure.

Platinum (PL) Daily Elliott Wave Chart​


The daily platinum chart indicates that the wave ((2)) pullback concluded at 843.1. From there, wave 1 peaked at 1105, followed by a wave 2 pullback ending at 875.9. The metal has since resumed its ascent in wave 3. In the near term, as long as the price remains above 875.9, expect platinum to continue extending higher.

Source: https://elliottwave-forecast.com/commodities/platinum-pl-soars-kicking-off-fresh-bullish-rally/
 
MicroStrategy (NASDAQ: MSTR) faced a 58% correction from its November 2024 peak. Meanwhile, Bitcoin resumed its rally this year and already reached new all-time highs. However, the stock continues to lag behind, failing to match Bitcoin’s bullish pace. In today’s article, we explore MSTR’s Elliott Wave structure and outline the bullish paths and key targets that may unfold next.

Elliott Wave Analysis


Starting from the December 2022 low, MSTR has formed three bullish swings into new highs. However, the sequence remains incomplete. Therefore, the stock should extend higher with a fifth swing, aiming to complete a standard impulse pattern.

Meanwhile, the 2025 low is labeled as wave IV, and the April pullback to $230 marks a critical low. As long as MSTR holds above that level, the structure favors further upside, potentially driving the next breakout toward new all-time highs.


The projected upside target for MSTR aligns with the inverted Fibonacci levels of wave IV, falling between $616 and $736. This zone reflects at least another +60% move, suggesting strong bullish potential. Moreover, depending on how the structure unfolds, the stock may extend beyond this range, especially if momentum builds into wave V acceleration.


MicroStrategy MSTR Weekly Chart 6.30.2025

MicroStrategy Elliott Wave MSTR 6.30.2025


Conclusion​


MicroStrategy (MSTR) continues to show a bullish sequence, supporting further upside and helping the stock catch up with Bitcoin’s rally. As momentum builds, traders can capitalize on daily pullbacks using our Elliott Wave strategy.


The ideal strategy is to continue buying pullbacks after MSTR completes 3, 7, or 11 swings from its recent peak. Meanwhile, our extreme Blue Box system enhances accuracy, helping traders pinpoint entry levels with confidence and clarity.

Source: https://elliottwave-forecast.com/stock-market/mstr-elliott-wave-signals-record-highs/
 
Unpacking IBEX's Rally: A Technical Analysis Using 1-Hour Elliott Wave Charts
In this blog post, we'll dive into the recent performance of the IBEX index, focusing on its 1-Hour Elliott Wave Charts. Since the April 7, 2025, low, the rally has unfolded as an impulse structure. Showcasing a sequence of higher highs that suggests further upside potential.
Given this momentum, our advice to members has been to avoid selling the index. Instead buy the dips in 3, 7, or 11 swings within the blue box areas. Below, we'll break down the structure and provide insights into our forecast.

IBEX 1-Hour Elliott Wave Chart From 6.19.2025 update​

IBEX Bounces Back: A Perfect Reaction from the Blue Box Zone

IBEX's Wave Structure Update: A Closer Look at the 1-Hour Elliott Wave Chart
As of our June 19, 2025, NY Midday update, the IBEX index had completed wave 3 at the 14368 high. The subsequent decline unfolded as wave 4, which corrected the preceding cycle. This pullback followed a double three structure, with wave ((w)) ending at 13858 and wave ((x)) bouncing to 14298. Wave ((y)) then extended to the blue box area (13784-13468), a zone anticipated for buyer interest, potentially triggering a 3-wave bounce or the next significant leg higher.


Let's examine the latest 1-Hour Elliott Wave Chart update as of June 30, 2025, to see how the structure has evolved.​

IBEX Bounces Back: A Perfect Reaction from the Blue Box Zone

IBEX's Reaction from the Blue Box Area: A Promising Turnaround​

Our latest 1-Hour Elliott Wave Chart update from June 30, 2025, shows the index reacting higher after completing its correction within the blue box area. This favorable move enabled members to secure risk-free positions shortly after entering long at the blue box zone. However, a decisive break above the 14368 high is crucial to confirm further upside potential and prevent a deeper pullback.

Source: https://elliottwave-forecast.com/stock-market/ibex-bounces-back-perfect-reaction/
 
Royal Bank of Canada., (RY) operates as diversified financial service company worldwide. It operates through personal finance, commercial banking, wealth management & Insurance segments. It comes under Financial services sector & trades as “RY” ticker at NYSE.

RY is trading at all time high & pullback in 3, 7 or 11 swings should provide buying opportunity against April-2025 low. Above April-2025 low, it should continue rally in ((3)) of III in impulse targeting in to $156.3 - $187.2 area.

RY - Elliott Wave Latest Weekly View:​

It ended (II) at $49.55 low in March-2020 & favors rally in III of (III). It ended I at $119.41 high in January-2022 & II at $77.90 low in October-2023 low as 0.618 Fib retracement. Within I, it ended ((1)) at $78.31 high, ((2)) at $67.78 low, ((3)) at $108.09 high, ((4)) at $98.00 low & ((5)) at $119.41 high. Within II pullback, it placed ((W)) at $83.63 low, ((X)) at $104.72 high & ((Y)) at $77.90 low as double correction. Above II low, it placed ((1)) at $128.05 high in December-2024 high & ((2)) at $106.10 as zigzag in April-2025.

Within ((1)), it ended (1) at $102.07 high, (2) at $93.97 low, (3) at $126.96 high, (4) at $120.26 low & (5) at $128.05 high. Within ((2)) pullback, it placed (A) at $117.63 low, (B) at $124.35 high & (C) at $106.10 low. It made all time high in (1) of ((3)) since April-2025 low. It expects small upside in (1) before correcting in to (2) in 3, 7 or 11 swings. Buyers can look for next opportunity in (2) at extreme area as long as the pullback stays above $106.10 low. The ((3)) of III can extend towards $156.3 - $187.2 area against April-2025 low. It needs to erase the momentum divergence in (3) rally to confirm the more upside. Alternatively, if it breaks below $106.10 low, it can be flat in ((2)) pullback.

Source: https://elliottwave-forecast.com/stock-market/royal-bank-canada-ry-hits-new-highs-next/
 
Hello fellow traders,

In this technical article, we are going to present Elliott Wave charts of GOLD (XAUUSD) . As our members know we are long in GOLD from previous equal legs area. As a result, members are enjoying profits in risk-free positions. Recently ,the commodity completed its intraday correction at the Equal Legs zone. In the following sections, we will explain the Elliott Wave count.

GOLD 4-Hour Elliott Wave Analysis 06.28.2025

Our current analysis shows GOLD has completed a 5-wave impulse from the 3119.79 low. Now, Wave 2 (red) is pulling back as a Double Three Pattern. The price has reached the extreme zone between 3284.25 and 3214.03 and buyers are likely to enter here. From this zone, we expect GOLD to move higher. It may form a new bullish impulse toward fresh highs or at least a 3-wave corrective bounce. We recommend avoiding short positions in this area.

Nearly 90% of traders fail because they don’t understand how to read market patterns. Are you among the top 10% who do?

Challenge yourself with this advanced Elliott Wave Test and find out.

Official trading strategy on How to trade 3, 7, or 11 swing and equal leg is explained in details in Educational Video, available for members viewing inside the membership area.

GOLD

GOLD 4-Hour Elliott Wave Analysis 07.01.2025

GOLD completed 7 swings pattern right at the Blue Box area. The commodity found buyers as expected, making decent bounce. The rally has already reached 50 fibs against the ((x)) connector.Consequently, any long positions from the Equal Legs should now be risk-free.

Reminder for members: Our chat rooms in the membership area are available 24 hours a day, providing expert insights on market trends and Elliott Wave analysis. Don’t hesitate to reach out with any questions about the market, Elliott Wave patterns, or technical analysis. We’re here to help.


Source: https://elliottwave-forecast.com/commodities/gold-xauusd-elliott-wave-equal-legs/