Robinhood (NASDAQ: HOOD) dropped 56% this year but rebounded, recovering its losses and reaching new highs. In today’s article, we explore the Elliott Wave structure, outlining potential paths and targets for its continued bullish momentum.
 HOOD Nest[/caption][caption id="attachment_962039" align="alignnone" width="300"]
 HOOD 5 Waves[/caption]
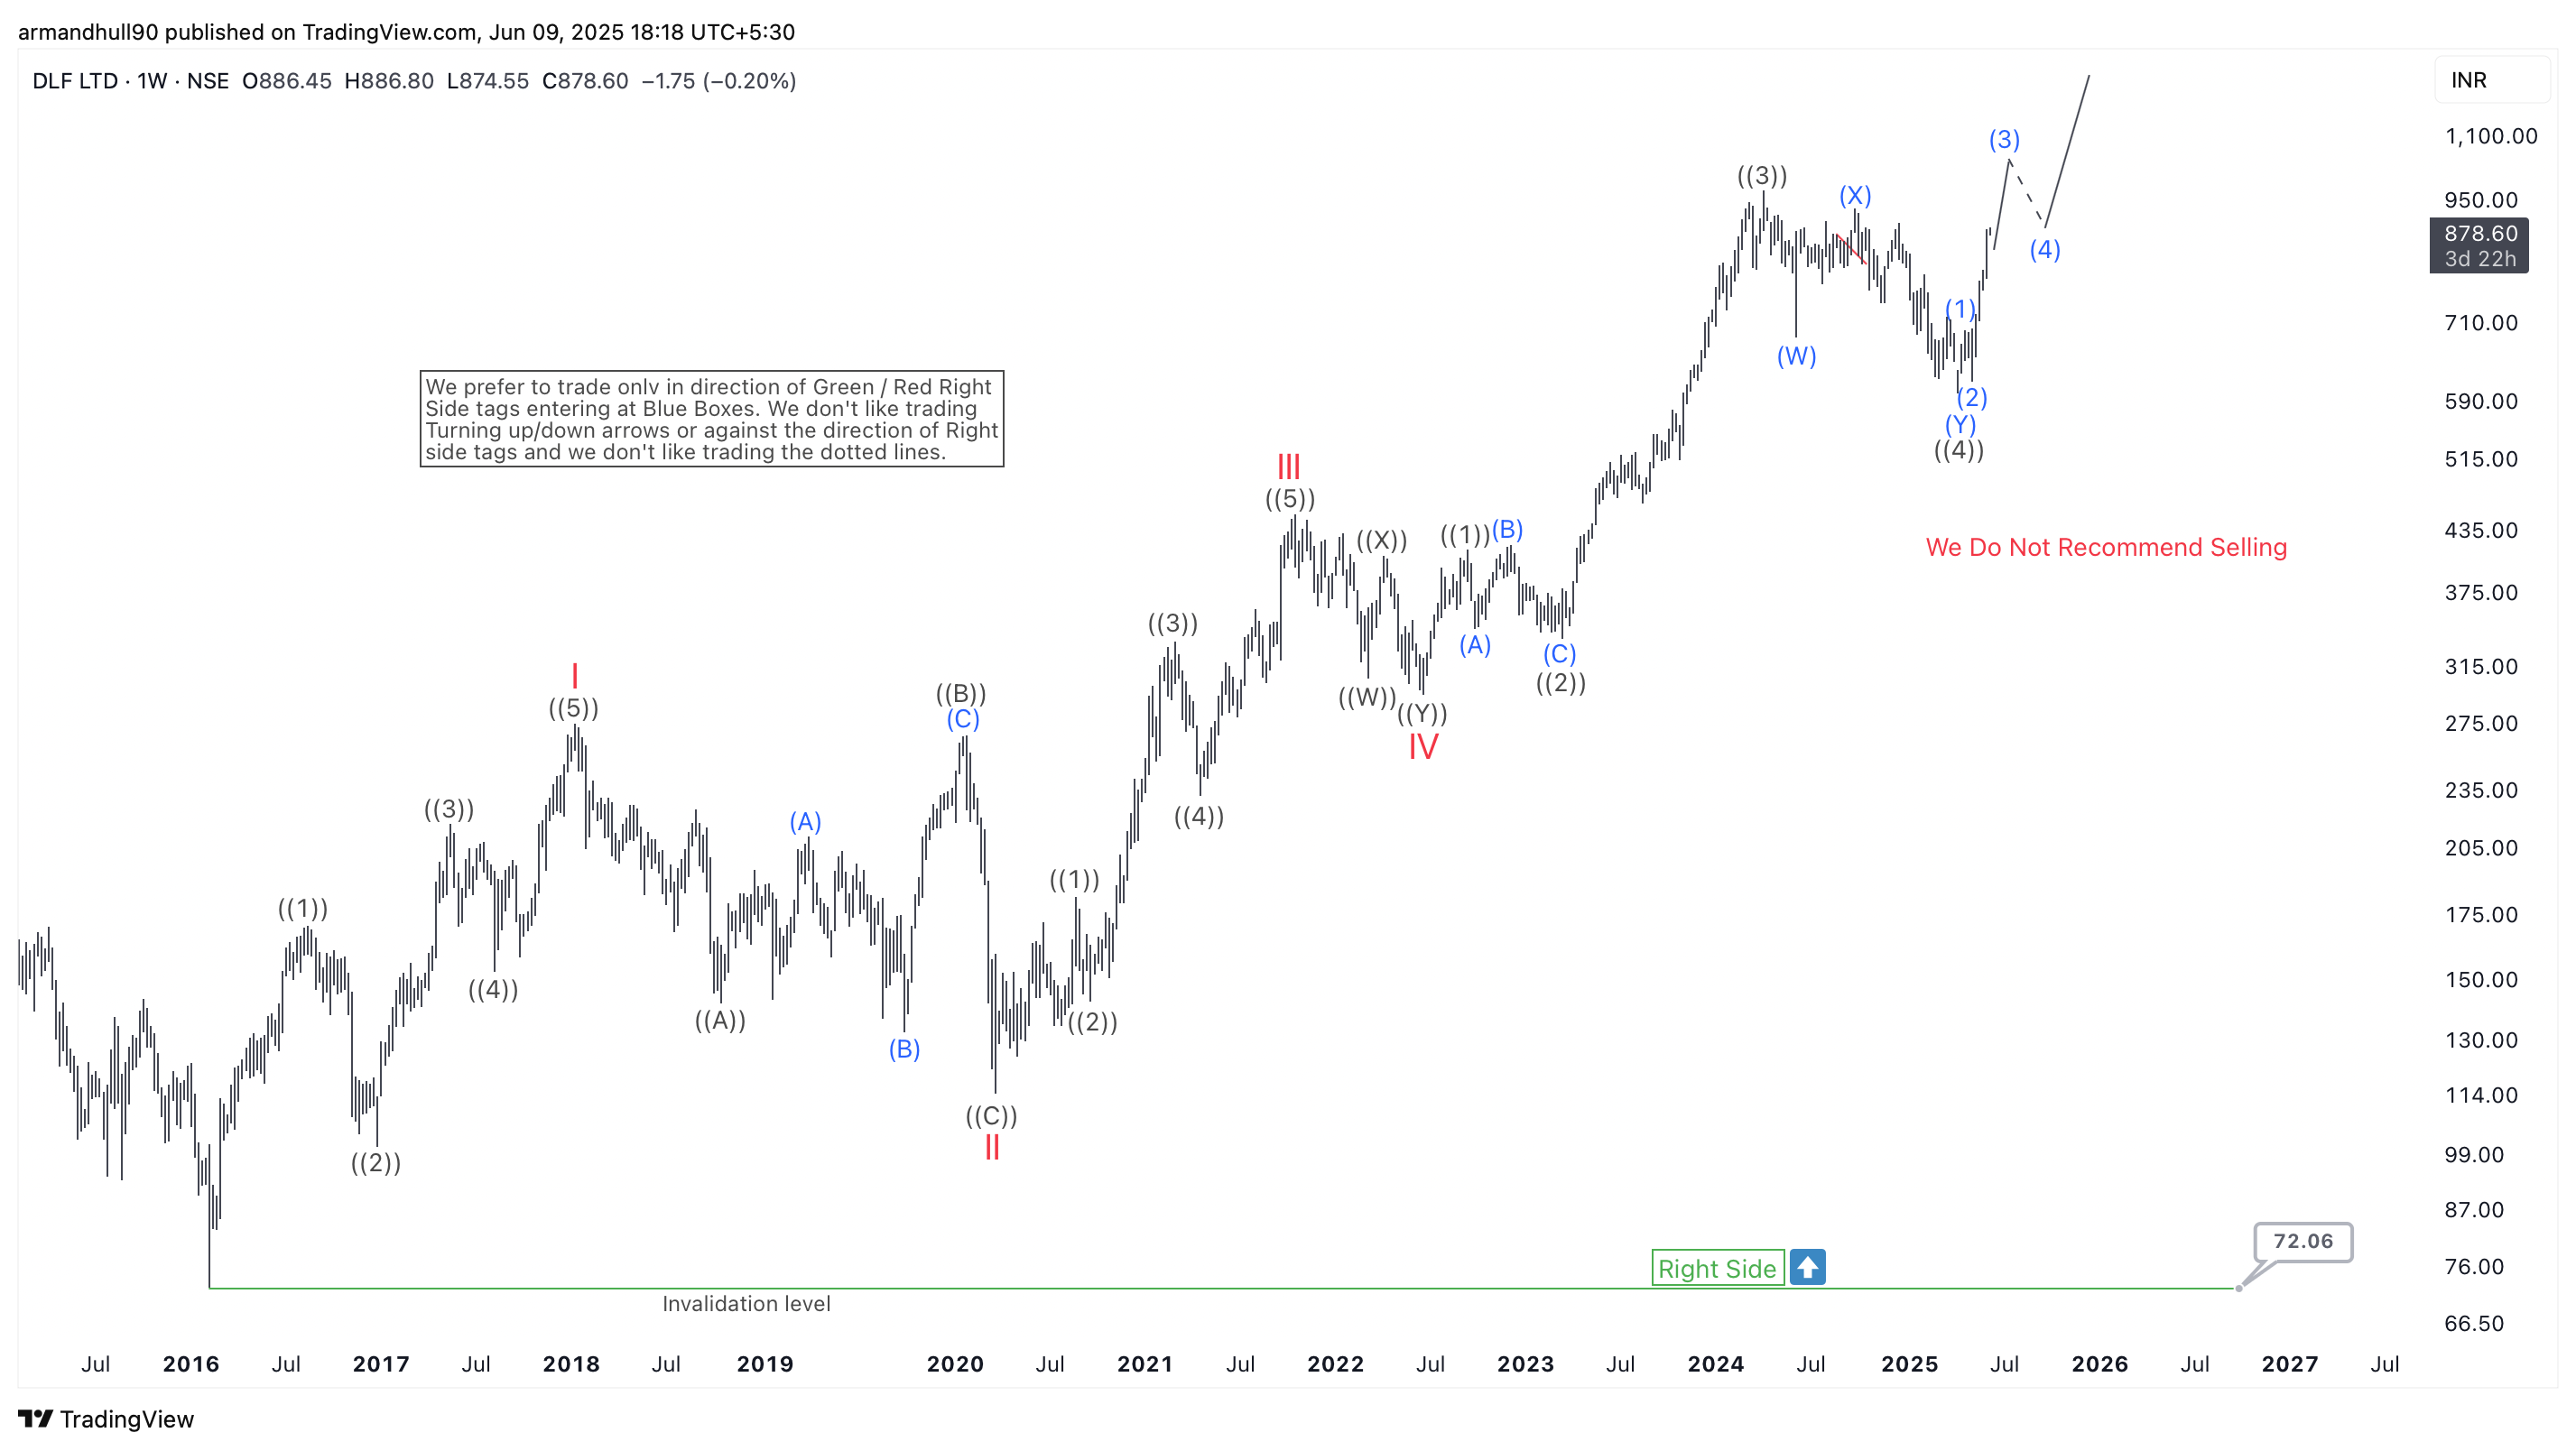
Scenario 1 : Bullish Nest
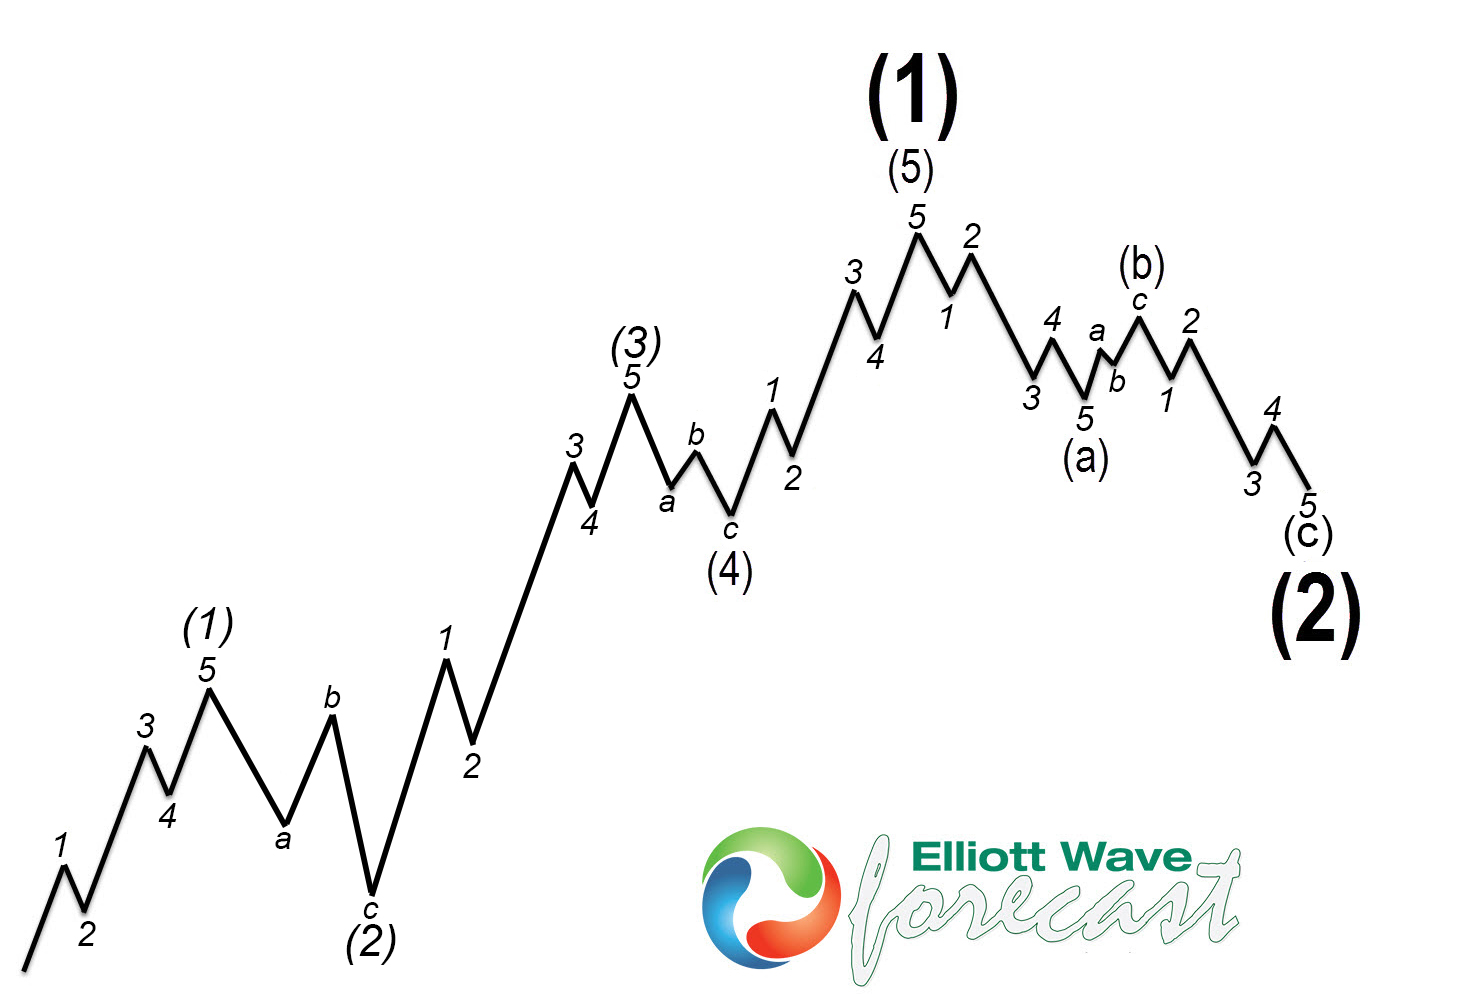
If the stock is forming a nesting structure, then the current rally is likely wave ((1)), with a potential peak between $66 - $74. After that, a pullback in wave ((2)) against the 04.07.2025 low could set the stage for the next bullish move. Moreover, the stock should resume its rally in wave ((3)) of III, targeting the equal legs area between $88 - $125, ultimately breaking into new all-time highs.
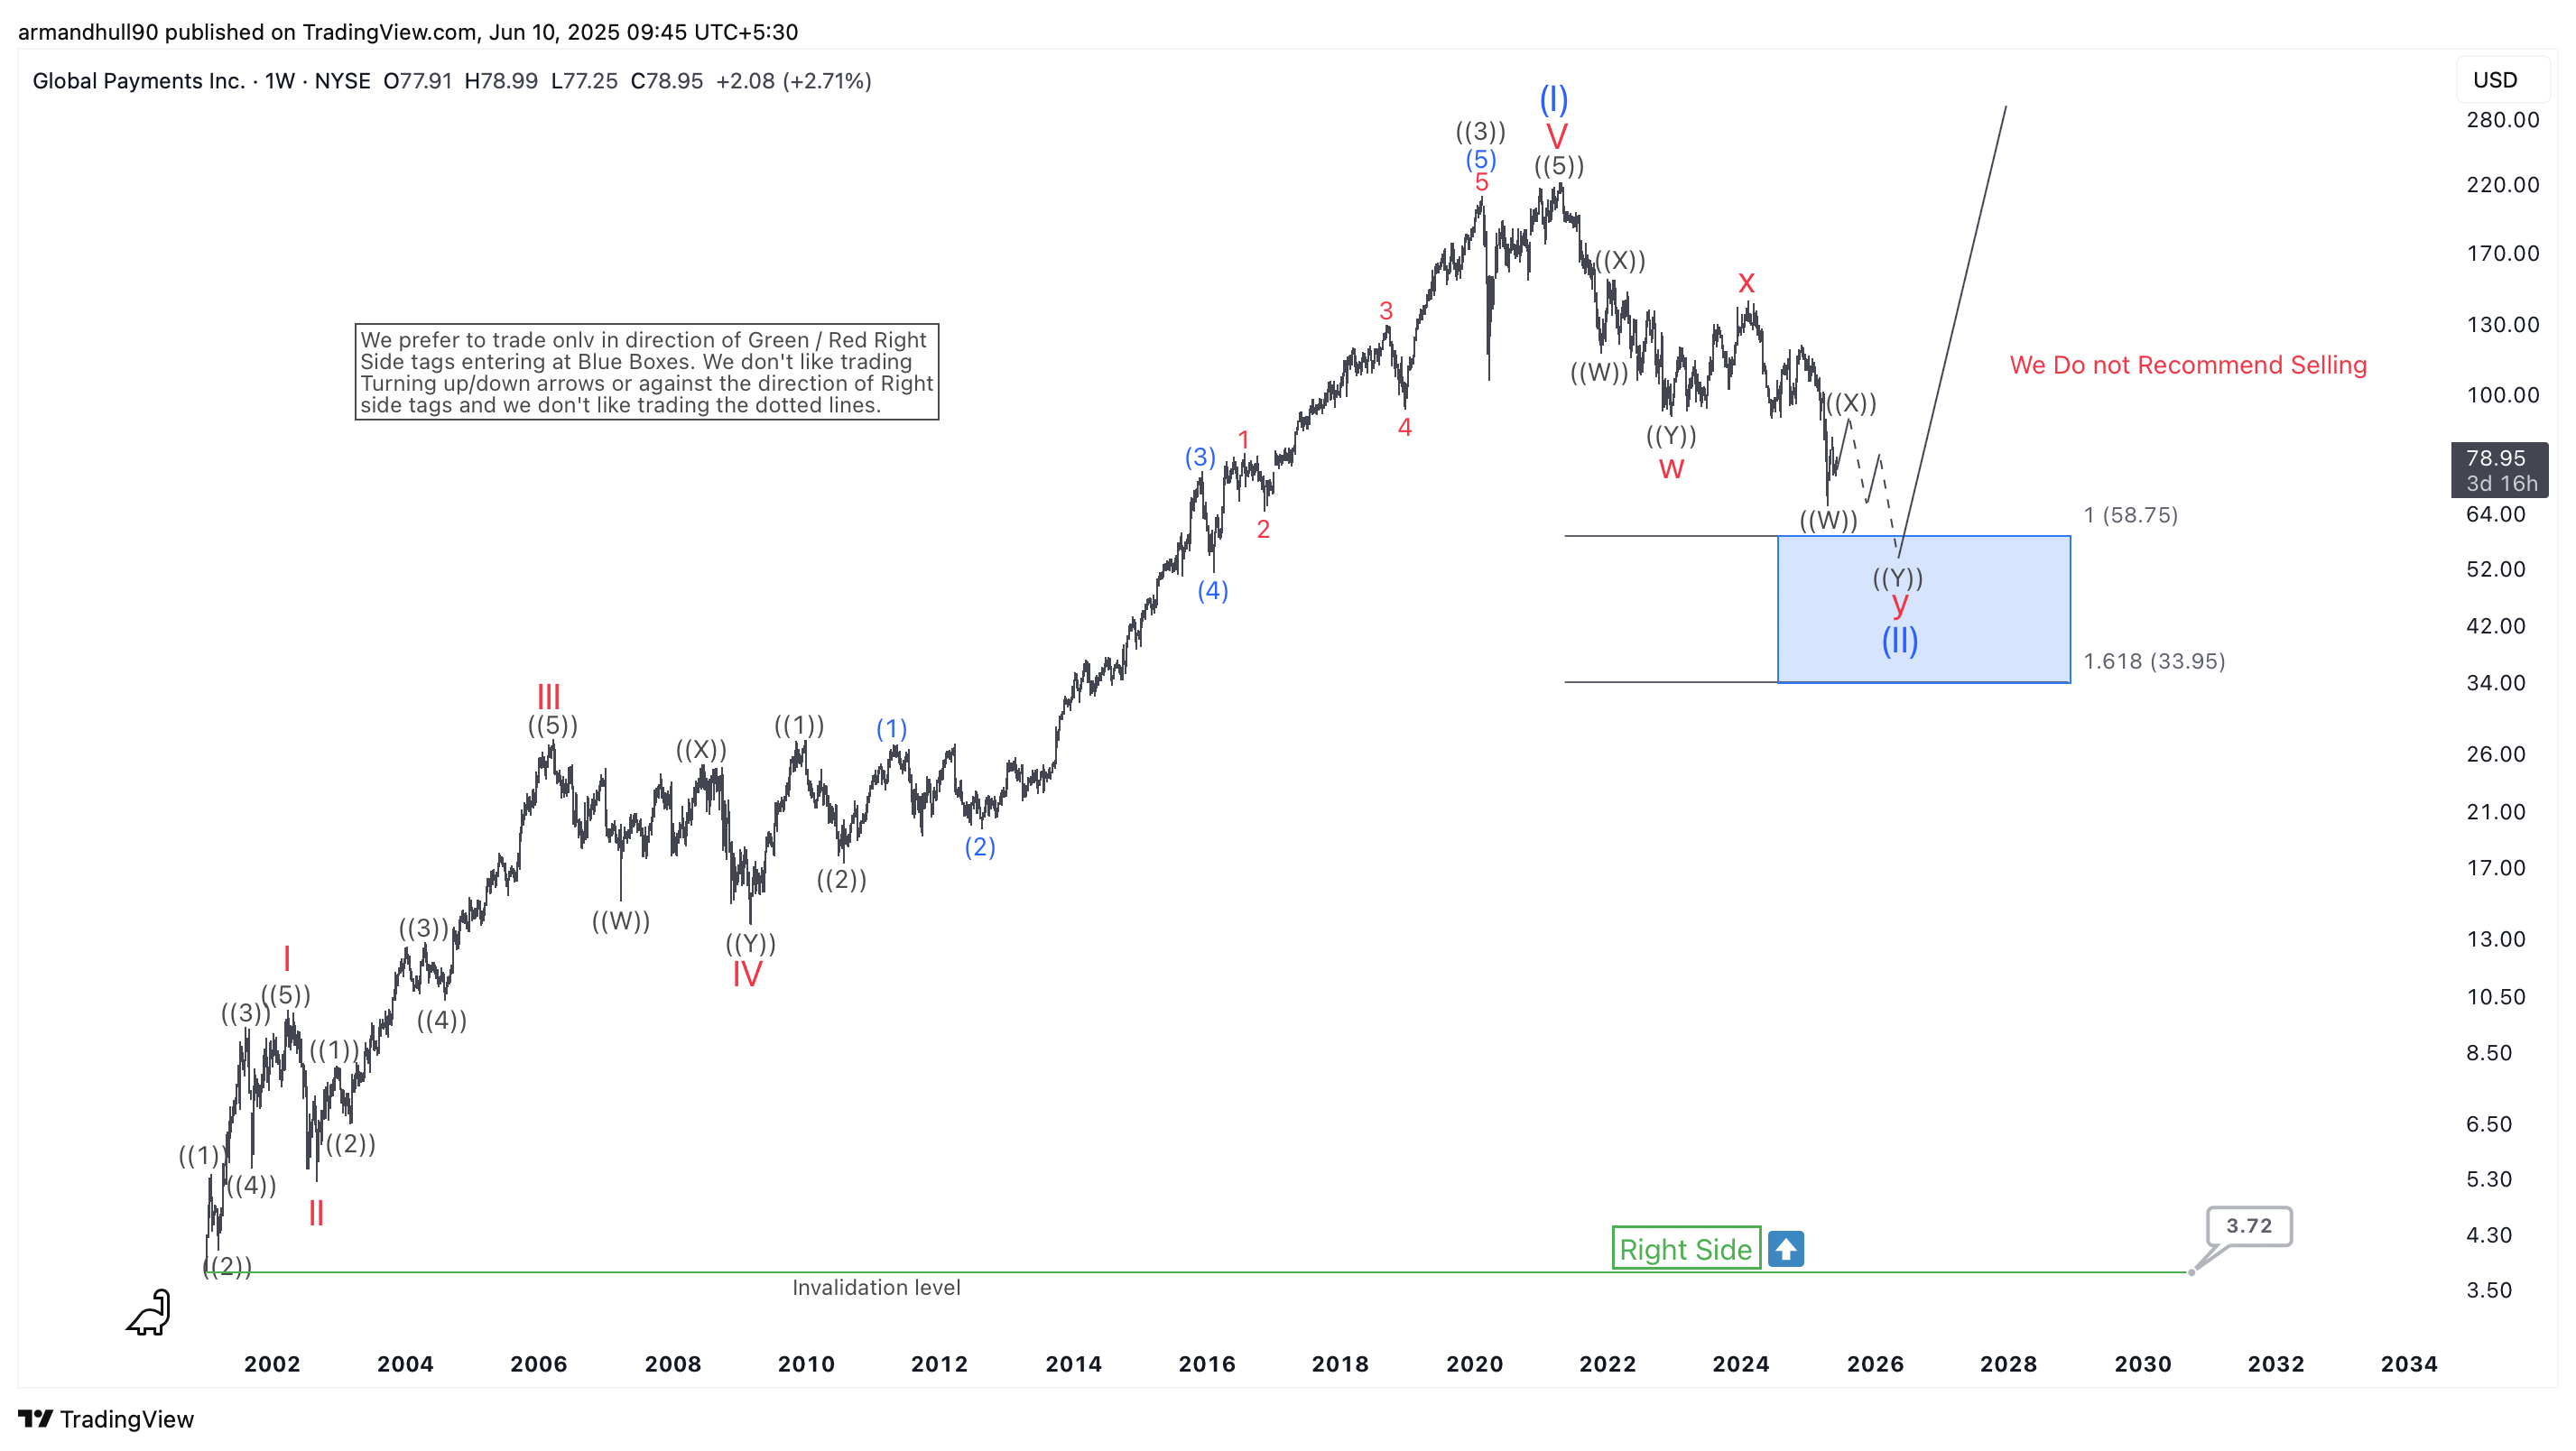
Scenario 2 : 5 Waves
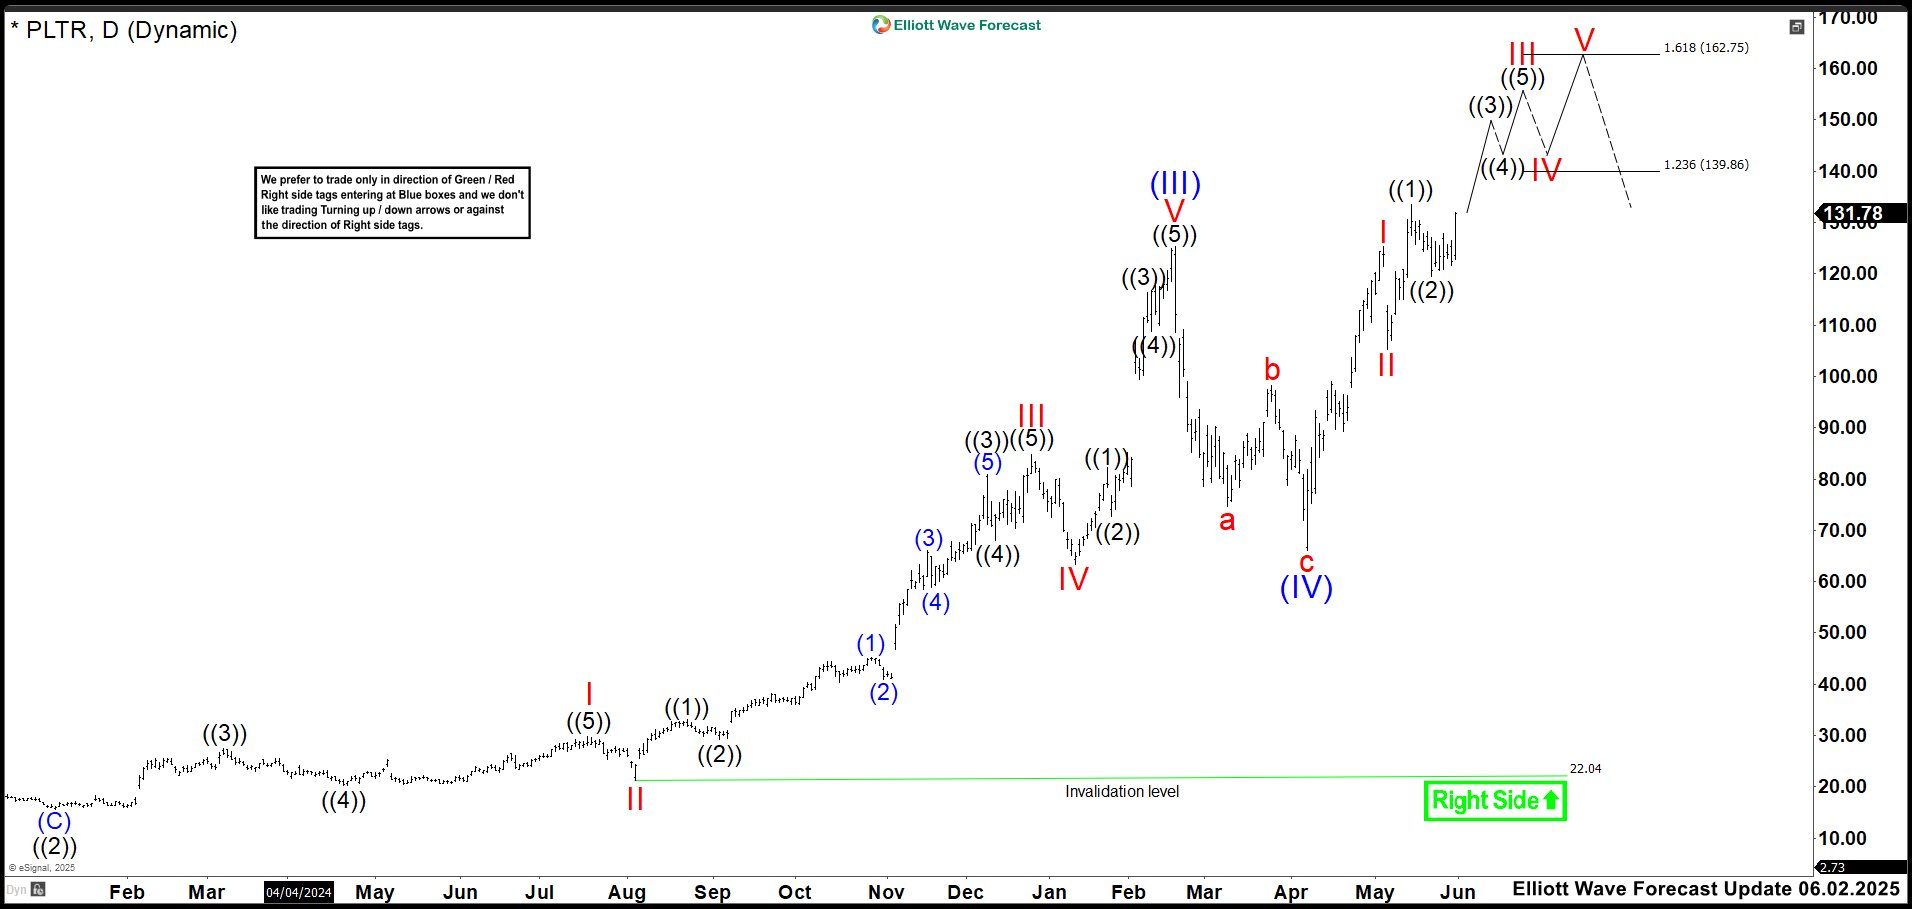
If the stock is nearing the completion of wave V, it could extend higher toward the $75 - $90 range before concluding the entire cycle from the 2022 low in wave (I). After that, a larger 3-wave pullback in wave (II) should unfold, setting the stage for another bullish move. Moreover, once the correction is complete, the stock is expected to turn higher again, aiming for wave (III) to the upside.
Source: https://elliottwave-forecast.com/stock-market/robinhood-hood-bullish-5-swings/
HOOD Weekly Charts
[caption id="attachment_962040" align="alignnone" width="300"] HOOD Nest[/caption][caption id="attachment_962039" align="alignnone" width="300"]
 HOOD 5 Waves[/caption]
Elliott Wave Analysis
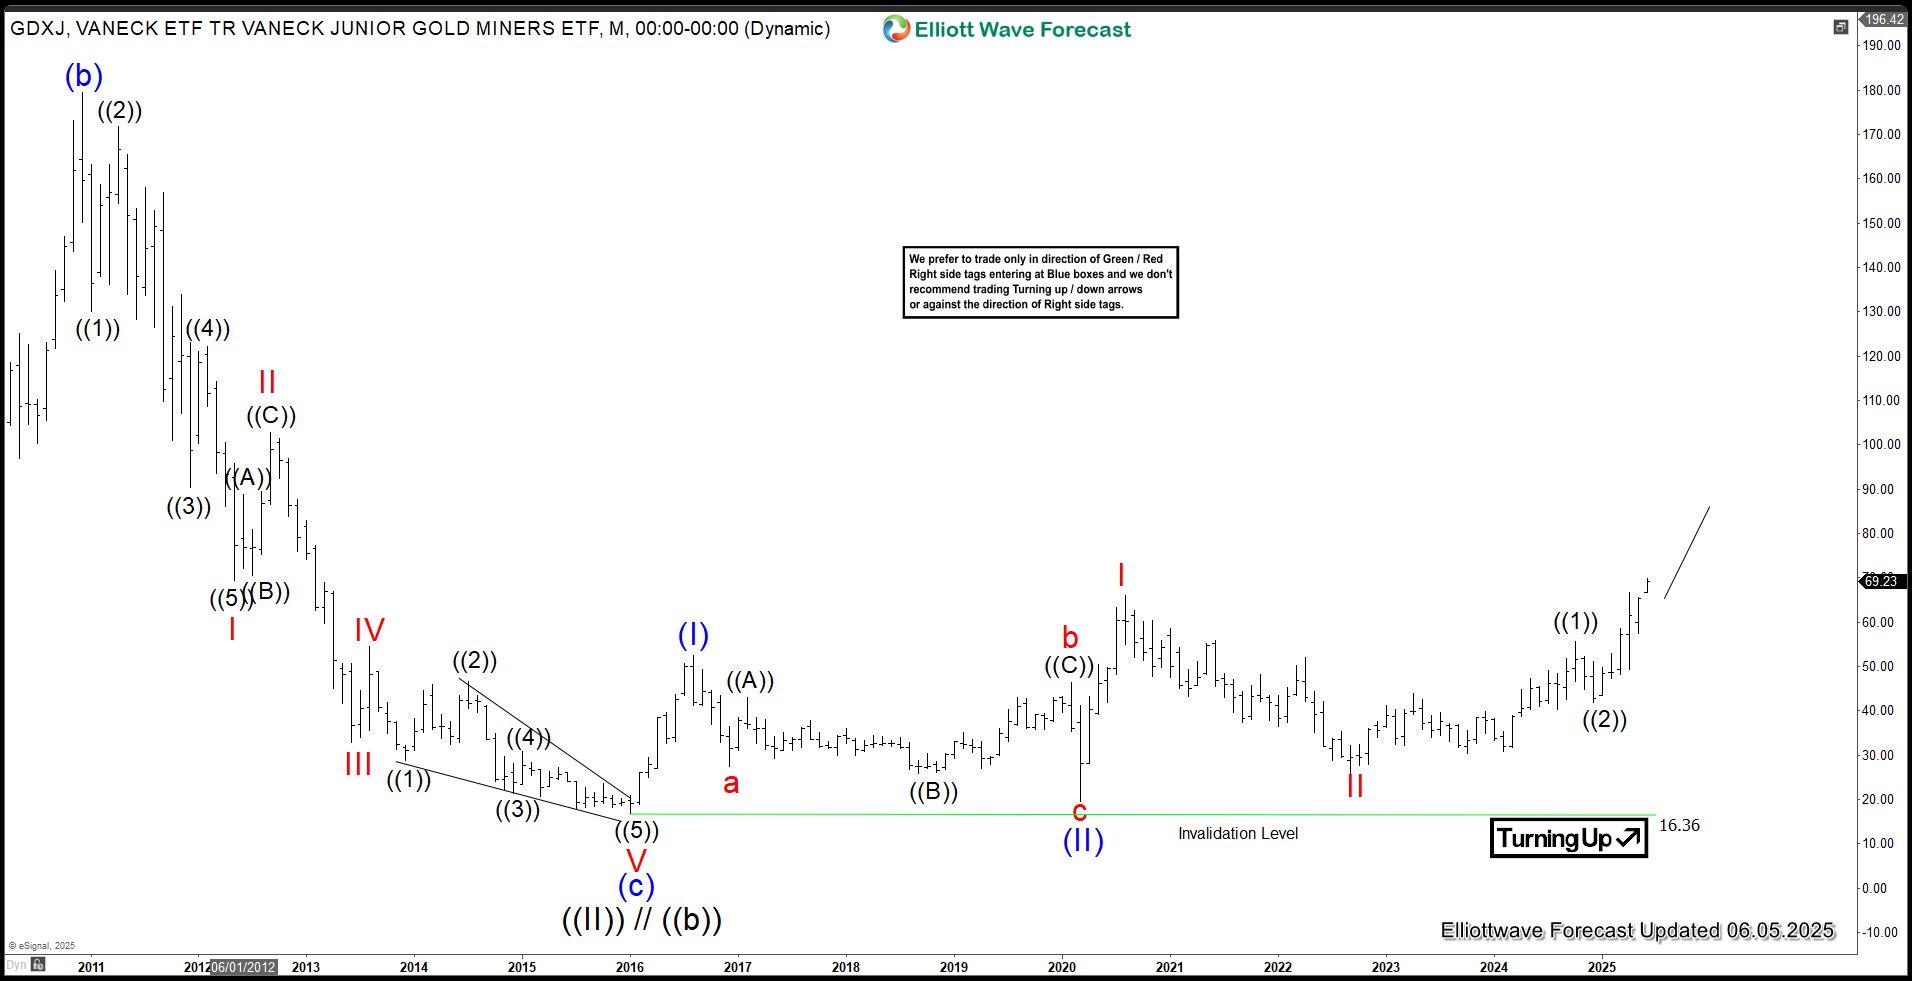
HOOD’s strong rally since April successfully broke above the February 2025 peak, confirming a 5-swing advance from the 2022 low. Moreover, this bullish sequence presents two possible paths that could shape the stock’s future trajectory.Scenario 1 : Bullish Nest
If the stock is forming a nesting structure, then the current rally is likely wave ((1)), with a potential peak between $66 - $74. After that, a pullback in wave ((2)) against the 04.07.2025 low could set the stage for the next bullish move. Moreover, the stock should resume its rally in wave ((3)) of III, targeting the equal legs area between $88 - $125, ultimately breaking into new all-time highs.
Scenario 2 : 5 Waves
If the stock is nearing the completion of wave V, it could extend higher toward the $75 - $90 range before concluding the entire cycle from the 2022 low in wave (I). After that, a larger 3-wave pullback in wave (II) should unfold, setting the stage for another bullish move. Moreover, once the correction is complete, the stock is expected to turn higher again, aiming for wave (III) to the upside.
Conclusion
The bullish 5-swing structure formed by HOOD will support the stock through the upcoming correction, creating opportunities to buy daily and weekly pullbacks using our Elliott Wave strategy. The ideal approach is to enter positions once the stock completes a 3, 7, or 11 swing sequence from its peak. Moreover, our extreme Blue Box system enhances precision, allowing traders to identify optimal entry points with clarity and confidence.Source: https://elliottwave-forecast.com/stock-market/robinhood-hood-bullish-5-swings/