Elliottwave-Forecast

Master Trader
Feb 17, 2017
2,462
9
84
www.elliottwave-forecast.com
$FXE Elliott Wave and Longer Term Cycles

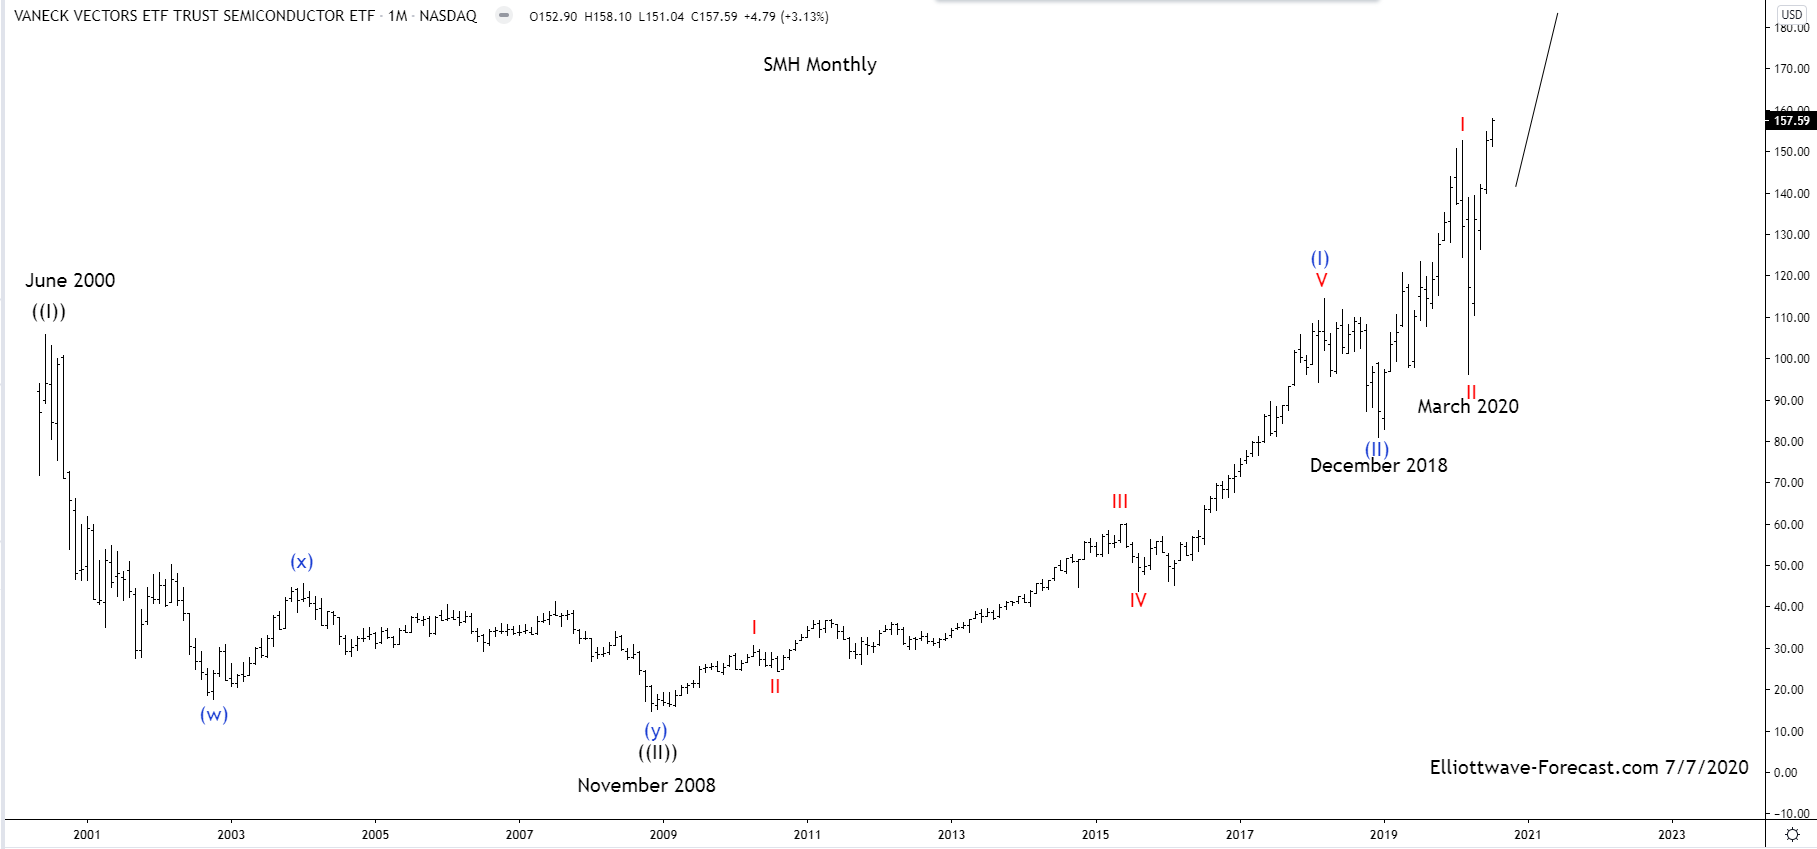
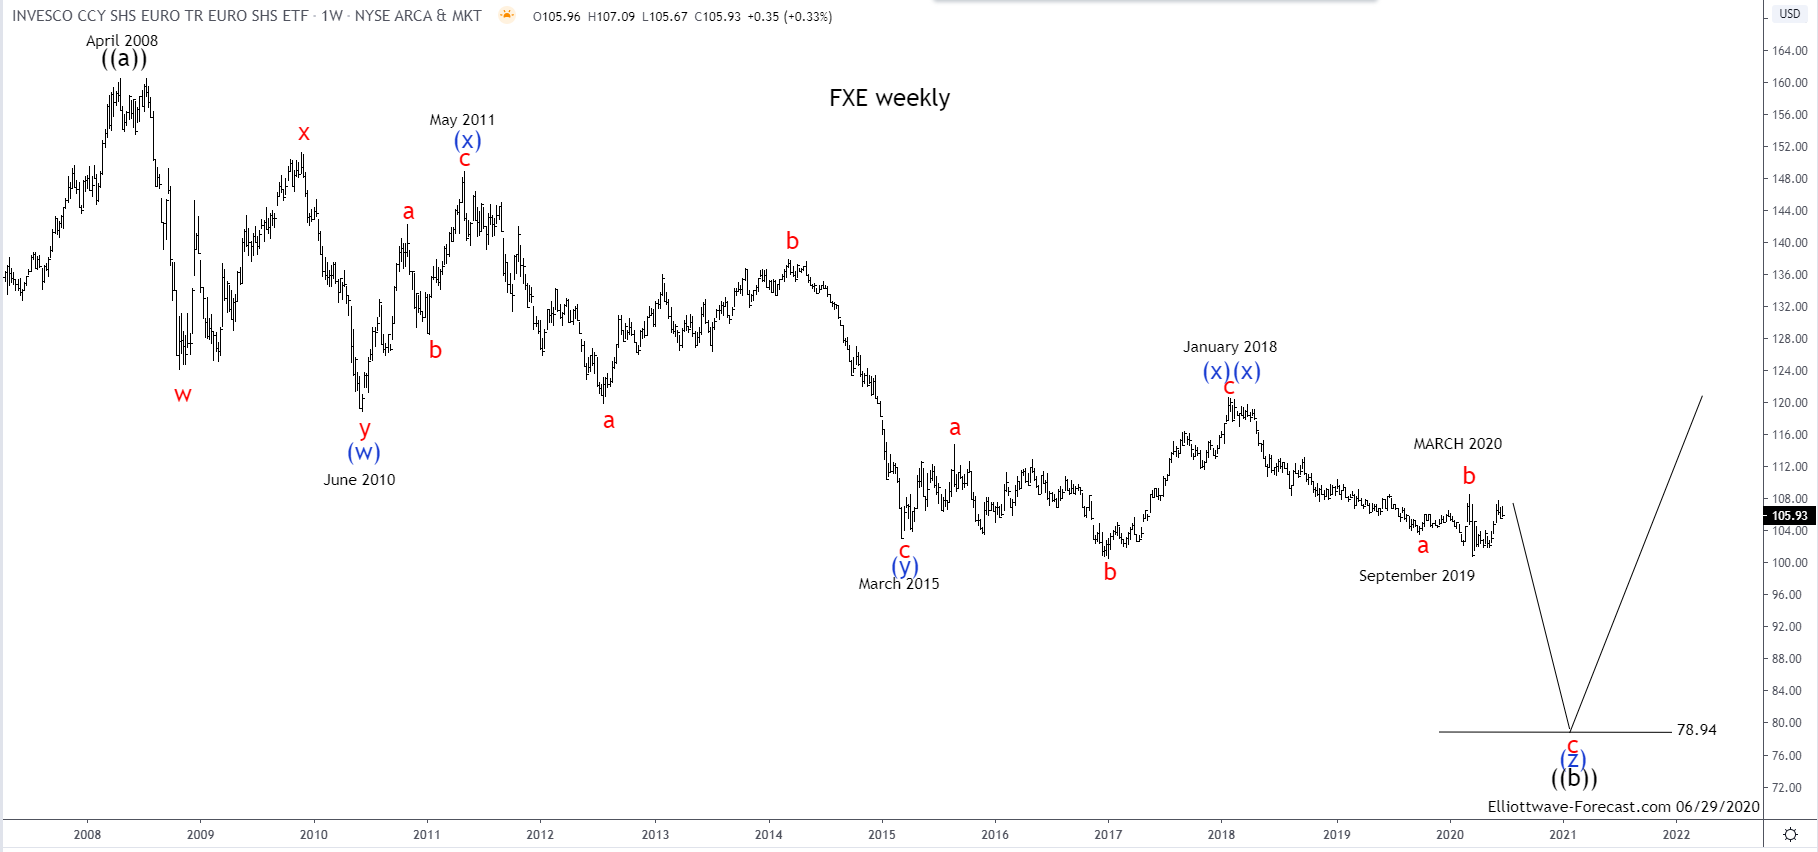
Firstly as seen on the weekly chart shown below the instrument made a high in April 2008. There is data back to December 2005 in the ETF fund. Data correlated in the EURUSD foreign exchange pair suggests the high in April 2008 was the end of a cycle up from the all time lows. EURUSD data shows the pair had a five wave up move from the early 1970’s era. This data is derived from the German Mark currency against the US Dollar that preceded the inception of the Euro currency.

As you can see the FXE instrument reflects the price swings of the single currency well. As previously mentioned the instrument made a high in April 2008. This where the analysis begins on the weekly chart shown below. The correction from those highs appears to be a an Elliott Wave triple three structure correction. The analysis continues below the weekly chart.


Secondly as mentioned the decline from the April 2008 highs appears to be an Elliott Wave triple three structure. The cycle lower from there does not count well as an impulse although there is a such thing as a diagonal that subdivides in five three swing moves in the direction of that cycle. When a cycle ends against a trend it will show in momentum indicators usually before price makes it obvious. These cycle highs and lows are in the blue color as shown on the chart above (w)-(x)-(y)-(xx) & potential (z) to come later.

Lastly in conclusion as said the structure lower from the 2008 highs appears to be a triple three Elliott Wave structure. The instrument currently appears ended a cycle lower from the January 2018 highs. It can further develop a bounce higher to correct the cycle from the January 2018 highs while above the late September 2019 lows. In the near term it should remain below the March 2020 highs. If it gets above there it can see to around the 111.00-113.00 area in the red wave b. While below the January 2018 highs a long term low can be seen. This is the 78.94 area where the wave (z) in blue is equal in length to the wave (w).
 

Elliottwave-Forecast

Master Trader
Feb 17, 2017
2,462
9
84
www.elliottwave-forecast.com
Banco Santander is the largest bank in Spain and the 5th largest bank in Europe. Traded under ticker $SAN at BMAD and NYSE, it is a component of the EuroStoxx50 and IBEX35 market indices. In particular, the weighting of 15% in the IBEX35 makes Santander the component to watch in strongly correlated markets. Indeed, IBEX35 is the index which shows an incomplete pattern to the downside in the long-term perspective. That fact may be responsible for withholding the major world indices to rally. Hereby, the heavy-weight Santander may provide a clue to understand the structure of the consolidation pattern and the levels to be achieved before an uptrend can be finally resumed. Therefore, Santander can provide the timing for the rally in the IBEX35 and probably all other indices as well.

Santander Monthly Elliott Wave Analysis 06.22.2020
The monthly chart below shows the Santander stock $SAN traded at BMAD. From the lows, the stock price has developed a cycle higher in wave (I) of a super cycle degree. Santander has printed the all-time highs on November 2007 at 13.43. From there, a correction lower in wave (II) has started with a first leg unfolding as an impulse. The 5 subwaves of the impulsive decline in red wave a have ended on March 2009 at 3.67. From the lows, a bounce in red wave b has retraced a large part of the decline. It has ended on January 2010 at 11.44. Now, 5 waves lower and 3 waves higher may be a hint that the consolidation pattern might be unfolding as a zigzag pattern being 5-3-5 structure. As a consequence, one may expect another 5 waves of red wave c to extend lower from the January 2010 peak.

View of the decline, as matter of fact, provides a case of an overlapping structure. Only the break of the March 2009 lows has proven that the leg lower in the red wave c is in progress opening up the monthly bearish sequence against the 2010 highs related to the 2007 highs. The equal legs extension area towards 1.71 and lower should become the target for the wave c of (II) to end. Once that area is achieved, the rally in wave (III) to the all-time highs towards 13.43 and higher can resume.

Technically speaking, wave c unfolds so far as an ending diagonal which is an Elliott Wave 3-3-3-3-3 structure. Wave ((1)) has demonstrated a double three pattern which has found its bottom on July 2012 at 3.93. Wave ((2)) in 3 swings higher has ended at 7.83. From there, on September 2014, wave ((3)) has started an extension lower.

Santander Elliott Wave Monthly

Santander Weekly Elliott Wave Analysis 06.22.2020
The weekly chart below shows the subdivisions of the wave ((3)) of the ending diagnonal in wave c. Hereby, wave ((3)) unfolds as a zigzag pattern. Waves (A) and (B) have been accomplished. The market has confirmed being in the wave (C) lower by breaking the June 2016 lows at 3.05. Based on the equal legs extension of the wave (C) related to the wave (A), Santander may now achieve 1.48-0.39 area. Thereafter, bounce in 3 waves in wave ((4)) should fail below September 2014 highs at 7.83. Ideally, Santander should drop from below the monthly resistance line for the last push lower in the wave ((5)). The final decline should unfold 3 subwaves. It may retest the lows or even do a marginal new low within the monthly blue box area.

As a consequence, the complete pattern along with achievement of the monthly extension area and the lack of space to the downside may become the end of the syper cycle wave (II). After all, Santander is expected to extend from the monthly blue box area higher in the wave (III) towards 13.43 and higher.

Santander Elliott Wave Weekly
 

Elliottwave-Forecast

Master Trader
Feb 17, 2017
2,462
9
84
www.elliottwave-forecast.com
USDCAD 45 minutes chart below shows that the pair has ended 3 wave pullback from June 15 high in wave 2. The pullback unfolded as double three Elliott Wave structure and ended at 1.3482 low. Afterwards, the pair resumed higher in wave 3. Up from 1.3482 low, wave ((i)) ended at 1.3559 high. Wave ((ii)) pullback ended at 1.3525 low. The pair then extended higher in wave ((iii)), which ended at 1.3666 high. The internal subwave of wave ((iii)) unfolded as 5 waves impulse Elliott Wave structure in lesser degree. The pullback in wave ((iv)) then unfolded as a triangle and ended at 1.3632 low. From there, the pair pushed higher in wave ((v)) which ended at 1.3715 high. This final move completed wave 3 in higher degree and ended cycle from June 23 low.

The pair is currently doing a pullback in wave 4 to correct the cycle from June 23 low. The correction is unfolding as a double three structure. Down from wave 3 high, the pair ended wave ((w)) at 1.3642 low. Wave ((x)) bounce ended at 1.3705 high. Wave ((y)) is currently in progress. While above 1.3482 low, expect the dips to find support in 7 or 11 swings for more upside. The 100 -161.8% extension of wave ((w))-((x)) where wave ((y)) can potentially end is at 1.3586 - 1.3631 area and shown with a blue box. That area, if reached later, can see a reaction for 3 waves bounce at least.

USDCAD 45 Minutes Elliott Wave Chart
USDCAD 6.30.2020 Asia Update
 

Elliottwave-Forecast

Master Trader
Feb 17, 2017
2,462
9
84
www.elliottwave-forecast.com
In this technical blog, we are going to take a look at the past performance of 1 hour Elliott Wave Charts of the Exxon Mobil ticker symbol: XOM. In which, the decline from 08 June 2020 peak unfolded as an impulse 5 wave structure. Thus suggested that it’s a continuation pattern. And as per Elliott wave theory after a 3 waves pullback, it should do another extension higher in 5 waves impulse structure at least. Therefore, we advised members not to buy the instrument & trade the no enemy areas ( blue boxes) as per the Elliott wave hedging tool. Looking for 3 wave reaction lower at least. We will explain the structure & forecast below:

XOM 1 Hour Elliott Wave Chart
XOM Elliott Wave View: Forecasting Decline Lower

XOM 1 Hour Elliott Wave Chart from 6/16/2020 Pre-Market update. In which, the bounce to $56.39 high ended a cycle from March 2020 lows. Down from there, the decline unfolded as 5 waves impulse structure where wave (1) ended at $50.60 low. Wave (2) ended at $52.16 high, wave (3) ended at $46.93 low, wave (4) ended at $48.84 high, and wave (5) ended at $46.05 low. Above from there, the stock made a 3 wave bounce to correct the cycle from $56.39 high. The internals of that bounce unfolded as an Elliott Wave Flat structure where wave (A) ended at $48.62 high. Wave (B) ended at $44.75 and wave (C) was expected to reach $49.59- $51.45 100%-161.8% Fibonacci extension area of (A)-(B). From where sellers were expected to appear in the stock looking for another 5 waves lower or for 3 wave reaction lower at least.

XOM 1 Hour Elliott Wave Chart
XOM Elliott Wave View: Forecasting Decline Lower

Here's 1 Hour Elliott Wave Chart from 6/25/2020 Post-Market update. In which, the stock is showing strong reaction lower taking place from the blue box area. Allowed members to create a risk-free position shortly after taking the shorts at $49.59- $51.45 blue box area. It’s important to note that with further market data, we re-adjusted the count by downgrading the degree of labeling in 1 Hour Charts.
 

Elliottwave-Forecast

Master Trader
Feb 17, 2017
2,462
9
84
www.elliottwave-forecast.com
Silver (XAGUSD) shows a higher high sequence from 6.15.2020 low favoring further upside. Up from 6.15.2020 low, the metal extended higher in wave 1 as 5 waves impulse Elliott Wave Structure. The rally in wave 1 ended at 18.07 high. From there, the metal did a pullback in wave 2, which unfolded as a zigzag Elliott Wave structure. Wave ((a)) ended at 17.80 low and the bounce in wave ((b)) ended at 17.99 high. Silver then declined lower and ended wave ((c)) of 2 at 17.34 low.

Afterwards, the metal continues to extend higher. It has already broken above the previous wave 1 high, confirming the next leg higher is in progress. From wave 2 low, wave ((i)) ended at 17.96 high. Wave ((ii)) pullback then ended at 17.66 low. Currently wave ((iii)) is in progress. Wave (i) of ((iii)) ended at 17.89 high and wave (ii) pullback ended at 17.76 low. From there, the metal resume higher in wave (iii), which ended at 18.24 high. The pullback in wave (iv) is proposed complete at 18.10 low. Near term, while pullback stays above 17.34 low, expect the dips in 3,7, or 11 swings to find support and silver to continue to extend higher.

Silver (XAGUSD) 1 Hour Elliott Wave Chart
Silver 7.1.2020 Asia Update
 

Elliottwave-Forecast

Master Trader
Feb 17, 2017
2,462
9
84
www.elliottwave-forecast.com
The next entry in the theme of Corona Virus stocks is iBioPharma Inc. iBio has had a steady advance during the COVID-19 spreading worldwide. It also remains very technical as with all other stocks. Lets take a look at what they do as a company:

“iBio is an innovator biologics company developing therapeutics and vaccines for the betterment of human and animal health, including a virus-like particle (VLP) -based vaccine against SARS-CoV-2. iBio’s subsidiary, iBio CDMO is a global leader in plant-based manufacturing. It’s FastPharming™ and FastGlycaneering™ platforms provide contract development and manufacturing services via its 130,000 square foot facility in Bryan, Texas. The speed and scalability of FastPharming make it an ideal choice for other innovator companies who want to rapidly produce COVID-19 biologics.”

iBio has had an impressive rally so far this year. The Elliott Wave view seems to be counting technically clean. Let’s take a look below at the 4H View since the all time low:

iBio 4H Elliottwave View:
iBio

Medium term term view from 11/19/2019 lows of 0.05. Wave ((1)) is set at 0.52 on 2/4/2020 and wave ((2)) at 0.18 on 2/21/2020. After that, a sharp increase to Black ((3)) took place, which topped on 3/2/2020 at 3.98. After that, iBio has set a black ((4)) bottom at 0.76, and is currently working on breakout out above previous ((3)) peak. Blue (1) and (2) of ((5)) are favoured to be set with Blue (3) in progress.

In conclusion, iBio is favoured to advance in the final ((5)) to a higher high. If the invalidation line of 0.76 is violated, then a larger degree correction would be favoured to be in progress. As it stands now the sequence is calling for one more high before a larger degree pullback may take place.
 

Elliottwave-Forecast

Master Trader
Feb 17, 2017
2,462
9
84
www.elliottwave-forecast.com
Alphabet (GOOGL) has broken above June 24 high, suggesting that the next leg higher has started. The stock has ended the correction from June 11 high in wave ((4)) as a Flat Elliott Wave Structure. Wave (A) ended at 1385.80 low, wave (B) ended at 1475.79 high, and wave (C) ended at 1351.65 low. This 3 waves move ended wave ((4)) pullback. From that low, the stock extended higher in wave 1, which ended at 1402 high. The pullback in wave 2 then ended at 1393.22 low.

Afterwards, the stock resumed higher in wave 3, where the subwave unfolded as a 5 waves Elliott Wave structure. Wave ((i)) ended at 1406.50 high, wave ((ii)) ended at 1395.64 low, wave ((iii)) ended at 1448.48 high, wave ((iv)) ended at 1441 low, and wave ((v)) ended at 1488.52 high. Wave 4 pullback is proposed complete at 1468.55 low. The stock can push for another high before ending 5 waves rally from June 29 low in wave (1). A larger degree pullback in wave (2) should then follow before the rally resume again. As far as pivot at 1351.05 low stays intact, expect dips in 3, 7, or 11 swing to continue finding support.

Alphabet (GOOGL) 15 Minutes Elliott Wave Chart
Alphabet 7.2.2020 Post Market
 

Elliottwave-Forecast

Master Trader
Feb 17, 2017
2,462
9
84
www.elliottwave-forecast.com
Hello fellow traders. Another instrument that we have been trading lately is Nvidia ( $NVDA ) stock. In this technical blog we’re going to take a quick look at the Elliott Wave charts of $NVDA , published in members area of the website. As our members know, NVDA is showing Impulsive sequences in the cycle from the March low, calling for further rally. Consequently, we advised members to avoid selling $NVDA and keep on buying the dips in the sequences of 3,7,or 11 swings whenever get chance. In further text we’re going to explain Elliott Wave Forecast and Trading strategy.

NVDA 1 Hour Elliott Wave Analysis 6.28.2020
Current view suggests NVDA is trading within March 18th cycle that is unfolding as impulsive structure. As of right now NVDA is doing wave ((4)) pull back that looks incomplete at the moment. . The price is still missing another leg down toward equal legs/ blue box area : 362.5-350.12 . As our members know, Blue Boxes are no enemy areas , giving us 85% chance to get a bounce. We don’t recommend selling it against the main trend. Strategy is buying the dips at the marked blue box area when invalidation level comes at 349.89. As the main trend is bullish, we expect to see 3 waves bounce at least from the mentioned zone. As soon as the price reach 50 Fibonacci Retracement against the (X) peak, we should make long positions Risk Free ( put SL at BE).

NVDA

NVDA 1 Hour Elliott Wave Analysis 7.02.2020
NVDA found buyers at 362.5-350.12 , the Blue Box area. We got nice rally from there, when wave ((4)) completed at 355.98 low. All longs from the blue box should be risk free at this stage. Break of 06/23 peak confirmed that next leg up is in progress. Now NVDA should ideally find buyers again in short term dips against the 355.98 low.

Keep in mind that market is dynamic and presented view could have changed in the mean time. Best instruments to trade are those having incomplete bullish or bearish swings sequences. We put them in Sequence Report and best among them are shown in the Live Trading Room. You can check most recent charts in the membership area of the site.


Elliott Wave Forecast
 

Elliottwave-Forecast

Master Trader
Feb 17, 2017
2,462
9
84
www.elliottwave-forecast.com
The Corona Virus has had its toll on the marketplace in general. But some select names have rallied sharply off the March 2020 lows, Penn National Gaming is one of those names. Not only has Penn rallied from a low of 3.75 to a high of 40.46. But it has made a new All Time High in the process. Lets take a look at the company profile:

"Penn National Gaming owns, operates or has ownership interests in 41 gaming and racing properties in 19 states and video gaming terminal operations with a focus on slot machine entertainment. We also offer live sports betting at our properties in Indiana, Iowa, Michigan, Mississippi, Pennsylvania and West Virginia. In total, Penn National’s properties feature approximately 50,000 gaming machines, 1,300 table games and 8,800 hotel rooms. In addition, the Company operates an interactive gaming division through its subsidiary, Penn Interactive Ventures, LLC, which launched iCasino in Pennsylvania and, through strategic partnerships, operates online sports betting in Indiana, Pennsylvania and West Virginia."

I am sure by now, most of you have heard of Barstool Sports founder, Dave Portnoy. Who has also started the DDTG (Davey Day Trader Group), and has one of the more colourful personalities in the trading sphere these days. Penn National Gaming also has a 36% stake in Barstool Sports. Lets take a look at the Elliott Wave view of Penn, it is counting clean and shows a possible opportunity for a long position in the near future.

Penn Elliott Wave Long Term View
Penn

On a longer term view, Penn shows a complete 5 waves sequence into the 2018 peak. From the Blue (I) top in 2018, Penn is favoured to have set a flat correction structure for Blue (II), which bottomed in March 2020 with the rest of the general market. It has since gone to make new all time highs off that low which gives it a bullish sequence. In the longer term view, a Red I high is favoured to materialize in the months ahead, before a deeper retrace for Red II. Before that happens though, there is opportunity for a long side trade. Lets take a look at the 4H view below.

Penn Elliott Wave 4H View
PENN

Medium term term view from 3/18/2020 lows of 3.75. Wave ((1)) is set at 19.83 on 4/29/2020 and wave ((2)) at 14.31 on 5/04/2020. After that, an extened Black ((3)) took place, which topped on 6/05/2020 at 40.46. After that, it is favoured that Penn is currently in progress of a Black ((4)) before heading higher. There is an equal leg extreme blue box area from 23.28 to 19.93. That is an area where a bounce may occur in 3 waves at least. After Black ((4)) is set, it is favoured for prices to head to new all time highs.

In conclusion, Penn is favoured to decline a little bit more to the extreme area before heading higher in ((5)) of Red I. As it stands now the sequence is calling for one more high before a larger degree pullback may take place in Red II.
 

Elliottwave-Forecast

Master Trader
Feb 17, 2017
2,462
9
84
www.elliottwave-forecast.com
Franco Nevada (ticker: FNV) is a Canada-based company that own royalties and streams in gold mining and other commodity and natural resource investments. The company does not operate mines, develop projects, or conduct explorations. The entire business model of the company focuses on managing the royalties and streams. Shares of the company have rallied > 60% year to date compared to the industry's growth of 45.5% and S&P 500's gain of 6.8%.

One of the advantages of the company's business models is the portfolio diversification. While some of the Franco Nevada's mining operators need to shutdown due to coronavirus pandemic, some other mines continue to operate normally , which helps negates the overall negative impact. As of March 13, 2020, the company has available cash of $1.5 billion, thus it's financially strong to survive in the current tough business environment. With Gold's price projected to continue higher due to economic uncertainties and unprecedented money printing, the company should continue to outperform.

Franco Nevada (FNV) Monthly Elliott Wave Chart

Monthly chart of Franco Nevada (FNV) above shows the rally from all-time low is unfolding as a 5 waves impulse Elliott Wave structure favoring further upside. The rally to $86.06 on November 2017 is proposed to end wave (I). The pullback to $58.26 ended wave (II). The stock is now nesting within wave (III) with subdivision as multiple impulse in lesser degree. Up from wave (II) low, wave I ended at $122.65, and pullback to $77.18 ended wave II. Stock then resumes higher again. Expect dips to continue to find buyers in 3 ,7, or 11 swing going forward.

FNV Daily Elliott Wave Chart


Daily Elliott wave chart above shows FNV is now within wave (III) as a nest. Up from $59.64, wave I ended at $122.65 and wave II pullback ended at $104. Stock then resumed higher and ended wave ((1)) at $152.70 and pullback in wave ((2)) ended at $124.51. While dips stay above $124.51, and more importantly above $104, expect the stock to continue higher.

FNV 4 Hour Elliott Wave Chart


4 hour chart of FNV above suggests the stock is rallying within wave III. Subdivision of wave III is unfolding as an impulse where wave ((1)) ended at $152.70 and pullback in wave ((2)) is proposed to end at $124.51. The stock still needs to break above wave ((1)) at $152.70 to rule out a double correction in wave ((2)). Alternatively, pullback to $124.51 ended wave (W). The current short term bounce is wave (X), then stock does another leg lower to end wave (Y) of ((2)) before the rally resumes.
 

Elliottwave-Forecast

Master Trader
Feb 17, 2017
2,462
9
84
www.elliottwave-forecast.com
In this blog, we are going to take a look at the Elliott Wave chart of TSLA (Tesla). The 1 hour post market update from June 25, 2020 shows that the stock extended higher from wave 4 low. The rally from June 15 low in wave ((i)) unfolded as 5 waves impulse Elliott Wave Structure and ended at 1019.85 high. The stock then did a pullback to correct that cycle as a zig-zag structure. Down from wave ((i)) high, wave (a) ended at 962.39 low. The bounce in wave (b) ended at 1019.74 high. The pair then continued to push lower in wave (c). The 100%-161.8% extension of wave (a)-(b) where (c) can potentially end is at 926.25-961.77 area. We showed this area with a blue box. This is the area where we expect buyers to appear for 3 waves bounce at least or an extension higher.

TSLA 25 June Post Market Elliott Wave Update
TSLA 6.25.2020 Post Market

June 30 Midday update shows that TSLA ended wave ((ii)) pullback at 937.38 low, which is within the blue box. From there, the pair saw a reaction higher after buyers appeared at that blue box area. The rally broke above previous wave ((i)) high and also wave 3 high, to confirm that wave ((ii)) is already in place and the next leg higher is already in progress. This allows buyers from the blue box a risk free position (stop loss moved to entry).

TSLA 30 June Midday Market Elliott Wave Update
TSLA 6.30.20 Midday

July 5 weekend update shows that TSLA continue to extend higher from the blue box. Up from 937.38 low, wave (i) ended at 998 high and the dip in wave (ii) ended at 948.52 low. The stock then resumed higher and ended wave (iii) at 1135.33 high. Wave (iv) pullback ended at 1066 low. Currently, the stock is close to ending wave (v), which would end wave ((iii)) in larger degree. A pullback in wave ((iv)) should follow after that. As long as the low at 937.38 stays intact, expect dips in 3,7, or 11 swings to find support for more upside.

TSLA 5 July Weekend Elliott Wave Update
TSLA 7.5.2020 Weekend Update
 

Elliottwave-Forecast

Master Trader
Feb 17, 2017
2,462
9
84
www.elliottwave-forecast.com
In this technical blog, we are going to take a look at the past performance of Elliott Wave Charts AMD. We presented to members at elliottwave-forecast. In which, the rally from 12 March 2020 low ( $36.25) unfolded as a 5 wave leading diagonal structure with the sub-division of (3-3-3-3-3) structure in each leg. Thus suggested that it’s a continuation pattern. And as per Elliott wave theory after a 3 waves pullback, it should do another extension higher in 5 waves impulse structure at least. Therefore, we advised members not to sell the instrument & trade the no enemy areas ( blue boxes) as per Elliott wave hedging remained the preferred path looking for 3 wave reaction higher at least. We will explain the structure & forecast below:

AMD 4 Hour Elliott Wave Chart From 6.28.2020
AMD Forecasting The Bounce From Blue BOX Area


Above is the 4 Hour Elliott Wave Chart of AMD stock from 6/28/2020 Weekend update. In which, the rally from 12 March 2020 low unfolded as 5 waves sequence where wave (1) ended at $48.99 high. Wave (2) ended at $41.70 low, wave (3) ended at $58.95 high, wave (4) ended at $49.09 low. While wave (5) ended at $59 high which ended a bigger degree wave ((1)). Down from there, the stock made a 3 wave pullback to correct the cycle from 3/12/2020 low within wave ((2)). The internals of that pullback unfolded as a zigzag structure where wave (A) ended at $52.80 low. Wave (B) bounce ended at $56.10 high and wave (C) was expected to reach $48.59- $43.90 blue box area. From there, buyers were expected to appear in the stock looking for another 5 waves rally. Or to do a 3 wave reaction higher at least.

AMD 4 Hour Elliott Wave Chart From 7.02.2020
AMD Forecasting The Bounce From Blue BOX Area

Here's 4 Hour Elliott Wave Chart of AMD from 7/02/2020 update. In which the stock is showing reaction higher taking place from the blue box area. Allowed members to create a risk-free position shortly after taking the longs at $48.59- $43.90 blue box area. However, a clear break above 6/20/2020 prior wave (5) of ((1)) peak ($59) still needed to confirm the next extension higher & avoid double correction lower.
 

Elliottwave-Forecast

Master Trader
Feb 17, 2017
2,462
9
84
www.elliottwave-forecast.com
Hello fellow traders. In this technical blog we’re going to take a quick look at the Elliott Wave charts of GOOGLE stock, published in members area of the website. As our members know, GOOGLE is another instrument that has been giving us trading opportunities lately. The stock is showing Impulsive sequences in the cycle from the March 23th low (1011.07) . The price structure has been calling for further rally. Consequently, we advised members to avoid selling $GOOGL and keep on buying the dips in the sequences of 3,7,or 11 swings whenever get chance. In further text we’re going to explain Elliott Wave Forecast.

GOOGLE 4 Hour Elliott Wave Analysis 6.29.2020
GOOGLE is trading within March 23th cycle that is unfolding as impulsive structure. Wave ((4)) pull back is showing clear 3 waves structure (A)(B)(C). The pull back reached equal legs area at 1392.79-1339.9 (buyers zone). As our members know, Blue Boxes are no enemy areas , giving us 85% chance to get a bounce. We don’t recommend selling it against the main trend in any proposed pull back. We favor the long side from the marked blue box area. As the main trend is bullish, we expect to see 3 waves bounce at least from the mentioned zone.

GOOGLE


Let's take a look at the lower time frame to see what short term price structure looks like.

GOOGLE 1 Hour Elliott Wave Analysis 6.30.2020
Wave ((4)) pull back is counted completed at the 1351.23 low. As far as the price stays above mentioned low, we expect more upside to follow. The stock should ideally break above June 24th peak in order to confirm next leg up is in progress. Anyway, we favor the long side from H4 blue box area. As soon as the price reach 50 Fibonacci Retracement against the (B) blue peak, we should make long positions Risk Free ( put SL at BE).

Keep in mind market is dynamic and presented view could have changed in the mean time. You can check most recent charts in the membership area of the site. Best instruments to trade are those having incomplete bullish or bearish swings sequences.We put them in Sequence Report and best among them are shown in the Live Trading Room

Google

Elliott Wave Forecast
 

Elliottwave-Forecast

Master Trader
Feb 17, 2017
2,462
9
84
www.elliottwave-forecast.com
The Corona Virus has had its toll on the marketplace in general. But some select names have rallied sharply off the March 2020 lows, Overstock is one of those names. Overstock has managed to rally from a low of 2.53 in March 2020 to a recent high of 40.90, with plenty more upside left in the sequence. Lets take a look at the company profile:

“Overstock.com, Inc. is an American internet retailer headquartered in Midvale, Utah. Overstock.com was originally founded in 1997 by Robert Brazell as D2: Discounts Direct. Two years later, it was sold to Patrick M. Byrne who renamed it Overstock.com. The company initially sold exclusively surplus and returned merchandise on an online e-commerce marketplace, liquidating the inventories of at least 18 failed dot-com companies at below-wholesale prices. The company continues to sell home decor, furniture, bedding, and many other goods that are closeout merchandise; however, it also sells new merchandise."

Lets take a look at the Elliott Wave view of Overstock, it is counting clean, and has an incomplete bullish sequence to the upside.

Overstock Elliott Wave 4H View
Overstock

OSTK has been public since 2002, and has recently in March 2020 set new all time lows. This has reset the count for a clean slate, and Overstock is off to an amazing start in this post COVID world.

Medium term term view from 3/18/2020 lows of 2.53 Wave ((1)) is favoured set at 20.85 on 5/12/2020 and wave ((2)) at 14.64 on 5/18/2020. After that, some nesting has taken place. Blue (1) and (2) of ((3)) are favoured to be set at 24.23 and 18.80 respectively. After that, Red 1 and 2 of Blue (3) of ((3)) favoured to be set at at 29.60 and 24.81 respectively. After that more nesting in ((i)) and ((ii)) has taken place with the heart of the 3rd wave advance underway. There is an equal leg extreme blue box area from 33.00-44.35. This is an area where buyers may start to take profits from the advance that has taken place. With that said, there is an incomplete bullish sequence.

In conclusion, Overstock is favoured to continue the rally into a wave ((3)) top. After that, a pullback in ((4)), then a final rally in wave ((5)) is still favoured to take place. More upside is needed to complete the sequence before a larger degree top can be realized. As it stands now the sequence is calling for more upside, with the ball firmly in the bulls court.
 

Elliottwave-Forecast

Master Trader
Feb 17, 2017
2,462
9
84
www.elliottwave-forecast.com
JPM Chase & Corporation, as many World Indices is showing an incomplete impulse since the all-time lows. The Instrument is showing a Grand Super Cycle propose impulse which is showing a wave (I) ending at 2000 peak. Then a nine years correction into 2009 lows and an amazing reaction higher since until this year peak. If we count the swings since the all-time lows it comes at this moment with an eleven swing count, and currently in swing twelve.

An impulse sequence comes as 5-9-13-17, which makes the upside still more likely to happen. One of the main differences between an impulse and a corrective advance is the separation between the waves, which we always identify, as per our new rules. Like if the relationship between (I) and (II) passes the 1.618 extensions, then most likely a wave (V) will be ending happening. The advance in JPM Chase is supporting the idea, because, as we can see went above the 126.00 area, which is the 1.618% extension.

JPM Elliott Wave Monthly Chart
JP Morgan Chase ( NYSE: JPM) Soon Will Define The Path.

The following chart is showing an impulse structure in the Elliott wave Theory, which at this stage looks very similar to the reaction in JPM Chase and we should be coming higher into the wave (V),

JP Morgan Chase ( NYSE: JPM) Soon Will Define The Path.

Since the lows at 03.2020, the recovery so far it is in three waves, which still is in what we call the twilight area because there is not a single winner. At this stage buyers need to wait for the peak presented as (3) to be broken, then buyers will gain control. And buying after three waves pullback will be a very good idea. The other definition will happen, if sellers will break the lows of wave (IV), and then buying at the 100% extension will also be a good idea.

JPM Elliott Wave Daily Chart
JP Morgan Chase ( NYSE: JPM) Soon Will Define The Path.
 

Elliottwave-Forecast

Master Trader
Feb 17, 2017
2,462
9
84
www.elliottwave-forecast.com
SPY has ended the cycle from June 16 high in wave (2), which unfolded as a double three Elliott Wave Structure. From June 16 high, wave W ended at 305.85 low. Wave X bounce ended at 314.57 high and wave Y ended at 298.99 low. Up from that wave (2) low, the ETF has resumed higher as a 5 waves Impulse Elliott Wave structure. Wave ((i)) ended at 304.02 high and pullback in wave ((ii)) ended at 302.22 low. SPY then extended higher in wave ((iii)), which ended at 315.70 high. The pullback in wave ((iv)) then ended at 311.51 low.

The ETF then continued to resume higher in wave ((v)) with the internal unfolding as another 5 waves Impulse in lesser degree. Up wave ((iv)) low, wave (i) extended higher and broke above previous June 16 high, confirming next leg higher has started. Wave (i) ended at 317.68 high and wave (ii) dips ended at 315.56 low. Currently, wave (iii) is in progress. Expect ETF to extend higher before ending wave (iii) of ((v)). Afterwards, pullback in wave (iv) should follow before another leg higher in wave (v). This would then end 5 waves rally in larger degree wave 1. A bigger 3 waves pullback in wave 2 should follow before the ETF resumes higher. As long as pullback stays above 298.99 low, expect wave 2 dips to find support in 3, 7, or 11 swing for more upside.

SPY 30 Minutes Elliott Wave Chart
SPY 7.7.2020 Post Market
 

Elliottwave-Forecast

Master Trader
Feb 17, 2017
2,462
9
84
www.elliottwave-forecast.com
$SMH Semiconductors Long Term Cycles & Elliott Wave

Firstly as seen on the monthly chart shown below. There is data back to May 2000 in the ETF fund. Data suggests the fund made a low in November 2008. This low has not been taken out in price. The cycles in this instrument tends to reflect the Nasdaq index fairly well however it has a larger degree difference in that the Nasdaq made a low to correct the cycle from the all time lows in October 2002 compared to the all time low made in November 2008 in the SMH semiconductors.

Secondly every way I count this data it suggests several things. Several counts are always possible the wave (III) in blue is still in progress as per the best reading of the cycles.

The analysis continues below the monthly chart.


Thirdly and in conclusion. Furthermore the instrument could be called lower correcting the cycle from the 2018 lows in a 3-3-5 expanded Elliott Wave flat. The other call lower is to correct the cycle from the March 2020 lows which data does not support in the smaller time frames. The bullish direction is higher in wave (III). It appears the pullback to the March 2020 lows already corrected that cycle up from the blue wave (II) lows. I always like to give the trend benefit of the doubt. In this case it should be obvious the trend is higher. The longer term lows highlighted on the chart above suggest the SMH should trade higher while above the March 2020 lows and certainly while above the December 2018 lows according to the price data currently available.
 

Elliottwave-Forecast

Master Trader
Feb 17, 2017
2,462
9
84
www.elliottwave-forecast.com
EEM (The Emerging Market ETF) could be getting ready for a huge move higher. The ETF has been sideways since the peak in 2007. EEM looks weaker when compared to the rest of the World Indices because of its inability to break above the 2007 highs, whereas almost every indices have already broken above that high. While there is still a possibility to break lower below the (b) low at 11.2008, it is hard to forecast that path due to the constructive price action since the lows. Every dips that occurred have been bought after three waves pullback. The reaction afterwards also looks to be impulsive and strong. Therefore, we are expecting the upside to prevail and a break higher to happen soon.

EEM Grand Super Cycle Elliott Wave Chart
EEM 7.6.2020 Grand Super Cycle

The EEM Weekly chart above is divided into two important cycles. The Blue area represents the Grand Super Cycle, which has ended back in 2007. Meanwhile, the Gray Area represents the Super Cycle after the significant drop in 2008, which is in agreement with the whole World Indices correction in 2009. The structure from the 11.2008 lows can be labeled in three different ways. We will explain each scenario from the most likely to the least likely to happen.

EEM 7.6.20 Chart

First scenario: A Leading Diagonal
A Leading Diagonal is a structure which happens most of the time coming off huge lows. The nature of this structure is a fight between buyers and sellers who still believe the Market will keep trading lower after the previous decline. A leading diagonal has an overlapping structure with sequences of 5-3-5-3-5, as shown in the following illustration.


As we can see, the structure and sequences of a leading diagonal are similar when compared to the EEM Daily chart above. If this is the scenario unfolding, then the idea is for EEM to extend for another high and end the cycle from 11.2008 in wave I, followed by a big pullback in wave II. Afterwards, a rally higher in wave III, which will last for years to come, will happen.

Second scenario: A Nest
A nest is a sequence of impulses that will produce a big move. Most of the time, this structure happens after a strong move against the trend. It is a representation of a fight between both sides, but with a clear defined price action in favor of one side. The sequences for this structure are 5-3-5-3-5 as shown below. The sequences of higher highs and higher lows usually are followed by a huge acceleration, which is most likely a wave III.


Third scenario: A WXY lower from 2007
A WXY is a structure that comes with a sequence of 3-3-3 as shown in the illustration below. This structure unfolds with an overlapping structure with no clear separation between the subdivisions. Most of the time the subdivision of this structure can be labeled as A-B-C for wave W, X, and Y. If this is the scenario unfolding, then the highs represented as wave ((3)) need to hold. Otherwise, this scenario will be invalidated.


At EWF, we understand the Market Nature. Therefore, we look at possible paths and find confirmations across other Market Instruments. That way, our members trade the right side and are consequently anticipating the Market, instead of reacting or chasing it.
 

Elliottwave-Forecast

Master Trader
Feb 17, 2017
2,462
9
84
www.elliottwave-forecast.com
CAC40 is a French stock market index representing a capitalization-weighted measure of the 40 most significant stocks on the Euronext Paris; the ticker is $PX1. The drop in indices in February-March 2020 which many still relate to COVID-19 events has marked most probably a significant low in world indices. It seems like CAC40 has also found its bottom on march lows at 3622.5 and is now looking higher.

CAC40 Weekly Elliott Wave Analysis 07.08.2020
The weekly chart below shows the CAC40 index $PX1 listed at Euronext. From the march 2009 lows at 2460.9, the stock price has developed a cycle higher in wave I of a cycle degree. It has ended by printing a high in February 2020 at 6111.4. Hereby, the overall move higher is an impulse. Within the wave I, the internal waves ((1)), ((3)) and ((5)) themselves are also impulses consisting of 5 motive subwaves (1), (3) and (5) each. The wave ((3)) of I shows an extension which occurs frequently within 3rd waves of impulsive moves.

From February 2020 highs at 6111.4, a sharp corection lower in wave II has retraced a respectable part of the motive cycle higher towards March lows at 3622.5. Technically speaking, the decline can be seen as an Elliott Wave zigzag correction. As a consequence, after a corrective move, the trend may resume which is pointing without any doubt to the upside. While above 3622.5, CAC40 might be now in development of the wave ((1)) of III to the upside.

CAC40 Elliott Wave Weekly

CAC40 Daily Elliott Wave Analysis 07.08.2020
The daily chart below shows in more detail the zigzag lower as wave II. Also, it demonstrates clearly the subdivisions of the March cycle higher in black wave ((1)). Hereby, blue subwaves (1)-(3) of ((1)) might have ended and the wave (4) is currently retracing part of the rise. The wave (4) by nature can unfold different Elliott wave patterns. Among them are zigzags, flats, double and tripple corrections as well as triangles. Here, one can see a corrective pattern in form of a converging triangle. Still, a double corection lower can take place. Also, a more bullish scenario can not be excluded. Within that view, wave (4) has already ended and wave (5) does multiple nests. Therefore, acceleration higher can happen.

From current levels, we are looking in general to the upside. Another push higher will probably end the march cycle in wave ((1)). After an advance in 5 waves, a pullback in 3 waves follows. So, CAC40 may soon peak in wave ((1)), consolidate thereafter in wave ((2)) lower and start another leg higher in wave ((3)) to new highs.

As a consequence, contrary to the social mood and economical expectations, CAC40 has found most probably its multi-year low in march 2020 at 3622.5. The index is currently resuming a rally. Alternatively, it should do after a pullback another leg higher at least.

CAC40 Elliott Wave Daily
 

Elliottwave-Forecast

Master Trader
Feb 17, 2017
2,462
9
84
www.elliottwave-forecast.com
Amazon (AMZN) 30 minutes chart below shows that the stock has ended the cycle from June 29 low. The rally in wave 1 unfolded as a 5 waves Impulse Elliott Wave structure. Up from 2630.28 low, wave ((i)) ended at 2696.80 high. Wave ((ii)) dip ended at 2665.47 low. The pair then extended higher in wave ((iii)), which ended at 2955.56 high. The internal subwave of wave ((iii)) also unfolded as 5 waves impulse Elliott Wave structure in lesser degree. Afterwards, the pullback in wave ((iv)) ended at 2871.10 low. From there, the pair pushed higher in wave ((v)), which ended at 3075.55 high. This final move completed wave 1 in higher degree and ended cycle from June 29 low.

The pair is currently doing a pullback in wave 2 to correct the cycle from June 23 low. The correction could unfold as a zig-zag structure. While above 2630.28 low, expect the dips to find support in 3,7, or 11 swings for more upside. The alternate count for AMZN would be that the stock has already ended wave (5) in its entirety instead of just wave 1 of (5). If this is the case, then the stock could have ended the cycle from March low. AMZN then could be doing a larger degree pullback to correct the cycle from March low before upside resume again.

Amazon (AMZN) 30 Minutes Elliott Wave Chart
Amazon 7.8.2020 Post Market