EUR/USD, GBP/USD Build Key Sideways Correction and Chart Patterns
EUR/USD
4 hour

25-09-2017eu4.png1668x754 232 KB
The EUR/USD is moving sideways as price stays in between support (green) and resistance (red) trend lines. The overall trend however is up and a bearish break could stop at the Fibonacci support levels of wave 4 (blue). A bullish breakout could indicate that the WXY (red) correction is finished.
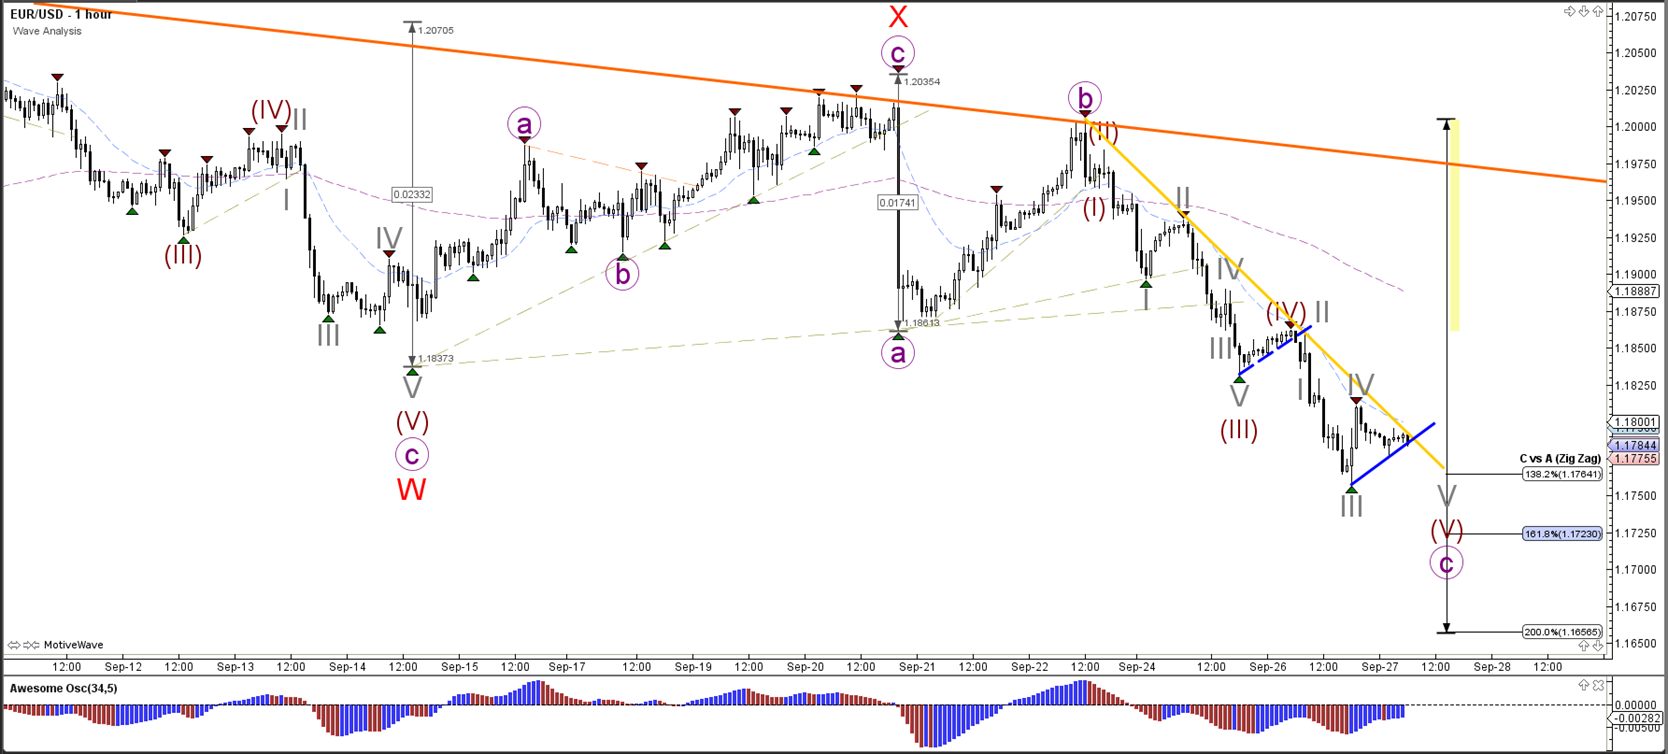
1 hour

25-09-2017eu1.png1668x754 223 KB
The EUR/USD is in a triangle chart pattern which is indicated by the trend lines. Price is in a wave C (purple) of wave Y (red) unless price manages to break above resistance (red). In that case, the wave C is most likely completed at the most recent bottom.
GBP/USD
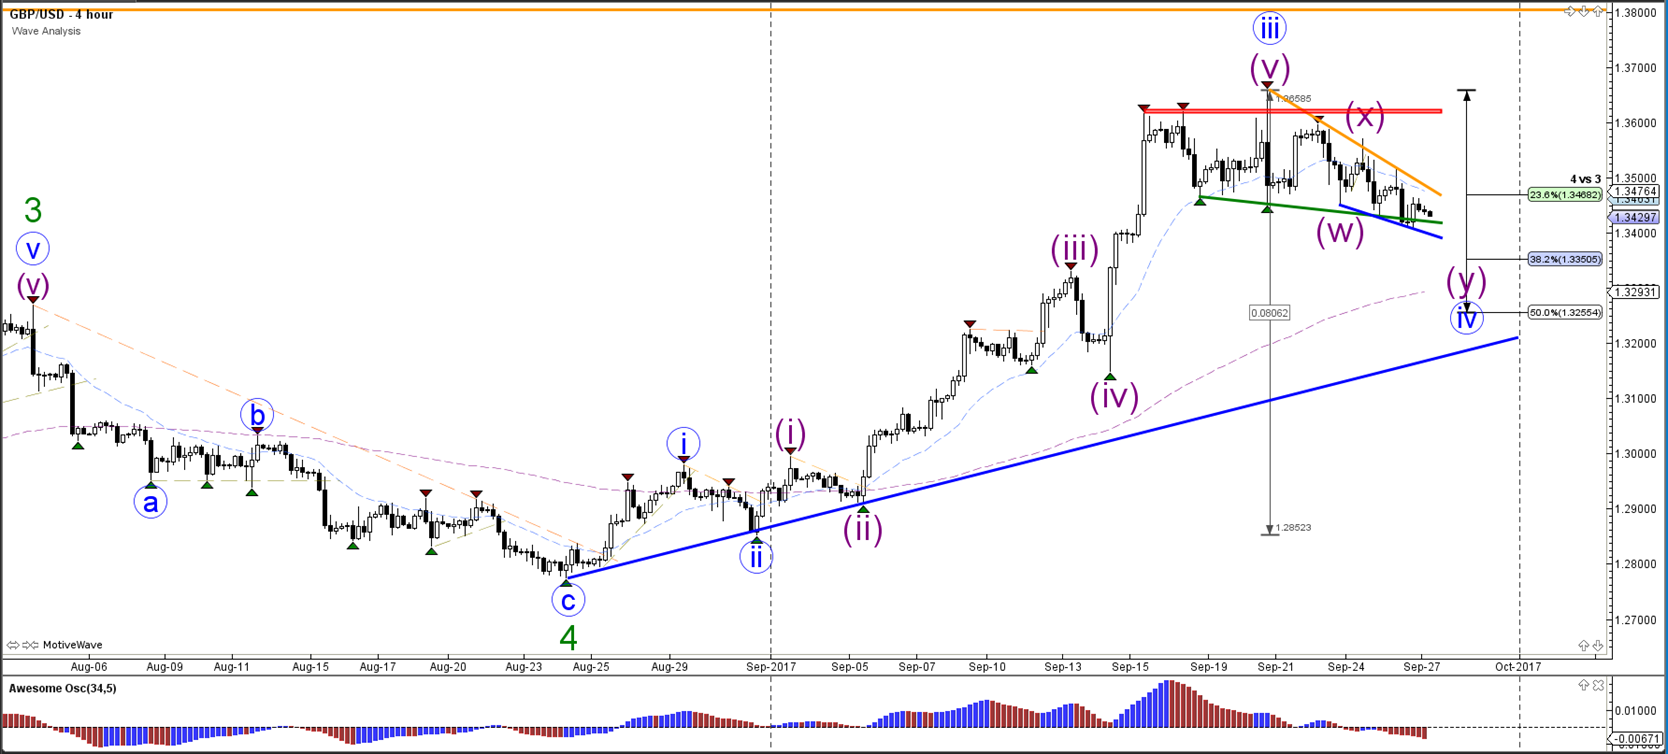
4 hour

25-09-2017gu4.png1668x754 212 KB
The GBP/USD is also in a sideways range (red/green lines) within a larger uptrend. A break below support could see price challenge the 38.2% Fibonacci level of wave 4 vs 3. A break above resistance could see price continue with the trend.
1 hour

25-09-2017gu1.png1668x754 199 KB
The GBP/USD needs to breakout below support (green) or above resistance (red/orange) otherwise the sideways range remains valid.
USD/JPY
4 hour

25-09-2017uj4.png1668x754 211 KB
The USD/JPY is testing a support trend line (green) of the uptrend channel.
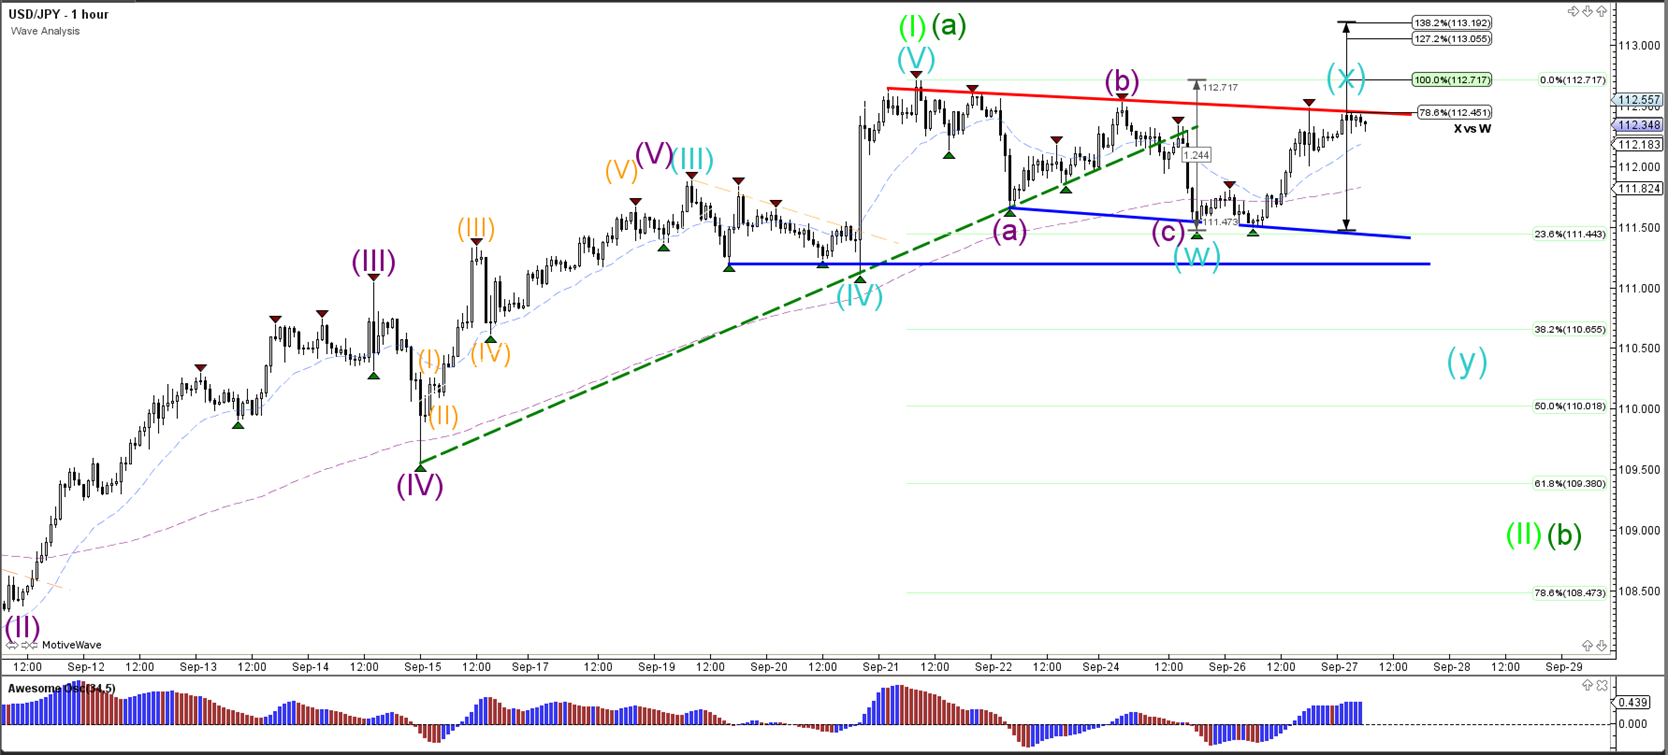
1 hour

25-09-2017uj1.png1668x753 218 KB
The USD/JPY needs to break above resistance (orange) before an uptrend continuation is likely. A break below support (blue) could confirm an ABC (blue) correction.
Follow @ChrisSvorcik on twitter for latest market updates.
Connect with Chris Svorcik on Facebook for latest Forex and education tips.
Risk disclosure - Forex and CFD trading carries a high level where losses can exceed your deposits. This material does not contain, and should not be construed as containing, investment advice or an investment recommendation or, an offer of or solicitation for any transactions in financial instruments. Please note that the trading analyses which refers to past performance, may change over time. No representation is given as to the accuracy or completeness of the information and any person acting upon it does so entirely at their own risk. Before making any investment decisions, you should seek advice from an independent financial advisor to ensure you understand the risks involved.
EUR/USD
4 hour
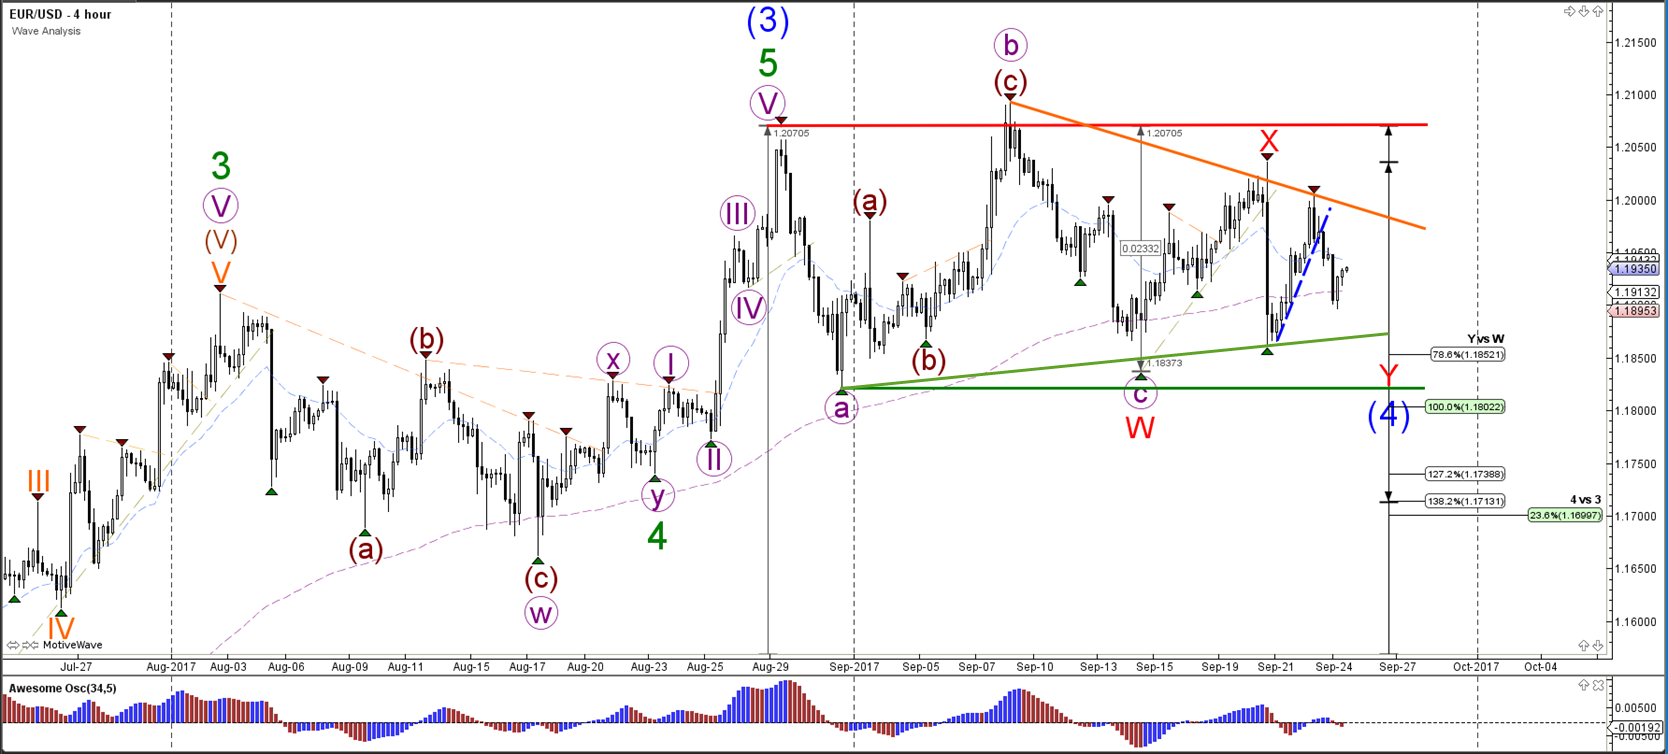
25-09-2017eu4.png1668x754 232 KB
The EUR/USD is moving sideways as price stays in between support (green) and resistance (red) trend lines. The overall trend however is up and a bearish break could stop at the Fibonacci support levels of wave 4 (blue). A bullish breakout could indicate that the WXY (red) correction is finished.
1 hour

25-09-2017eu1.png1668x754 223 KB
The EUR/USD is in a triangle chart pattern which is indicated by the trend lines. Price is in a wave C (purple) of wave Y (red) unless price manages to break above resistance (red). In that case, the wave C is most likely completed at the most recent bottom.
GBP/USD
4 hour

25-09-2017gu4.png1668x754 212 KB
The GBP/USD is also in a sideways range (red/green lines) within a larger uptrend. A break below support could see price challenge the 38.2% Fibonacci level of wave 4 vs 3. A break above resistance could see price continue with the trend.
1 hour

25-09-2017gu1.png1668x754 199 KB
The GBP/USD needs to breakout below support (green) or above resistance (red/orange) otherwise the sideways range remains valid.
USD/JPY
4 hour

25-09-2017uj4.png1668x754 211 KB
The USD/JPY is testing a support trend line (green) of the uptrend channel.
1 hour

25-09-2017uj1.png1668x753 218 KB
The USD/JPY needs to break above resistance (orange) before an uptrend continuation is likely. A break below support (blue) could confirm an ABC (blue) correction.
Follow @ChrisSvorcik on twitter for latest market updates.
Connect with Chris Svorcik on Facebook for latest Forex and education tips.
Risk disclosure - Forex and CFD trading carries a high level where losses can exceed your deposits. This material does not contain, and should not be construed as containing, investment advice or an investment recommendation or, an offer of or solicitation for any transactions in financial instruments. Please note that the trading analyses which refers to past performance, may change over time. No representation is given as to the accuracy or completeness of the information and any person acting upon it does so entirely at their own risk. Before making any investment decisions, you should seek advice from an independent financial advisor to ensure you understand the risks involved.