GBP/USD Bullish Break Runs into Resistance ahead of UK Elections
GBP/USD
4 hour

The UK will hold general parliamentary elections on Thursday 8 June 2017.
The GBP/USD broke above the resistance trend line (dotted red) which invalidated yesterday’s bearish wave count and could make a bullish variant more likely although both support and resistance levels remain nearby.
1 hour

The GBP/USD broke out above the smaller resistance line (dotted yellow) and is now challenging the resistance top (red).
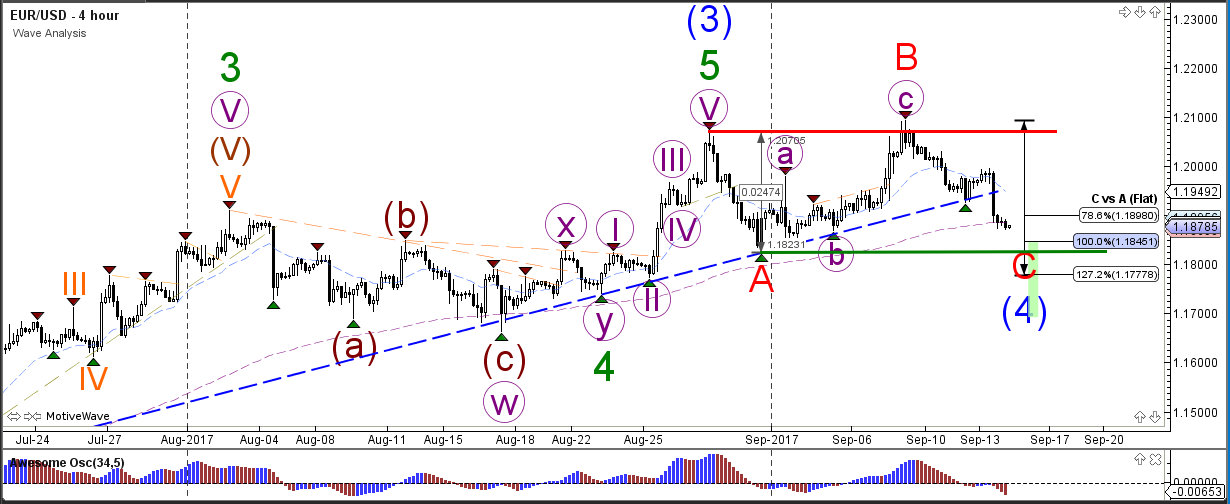
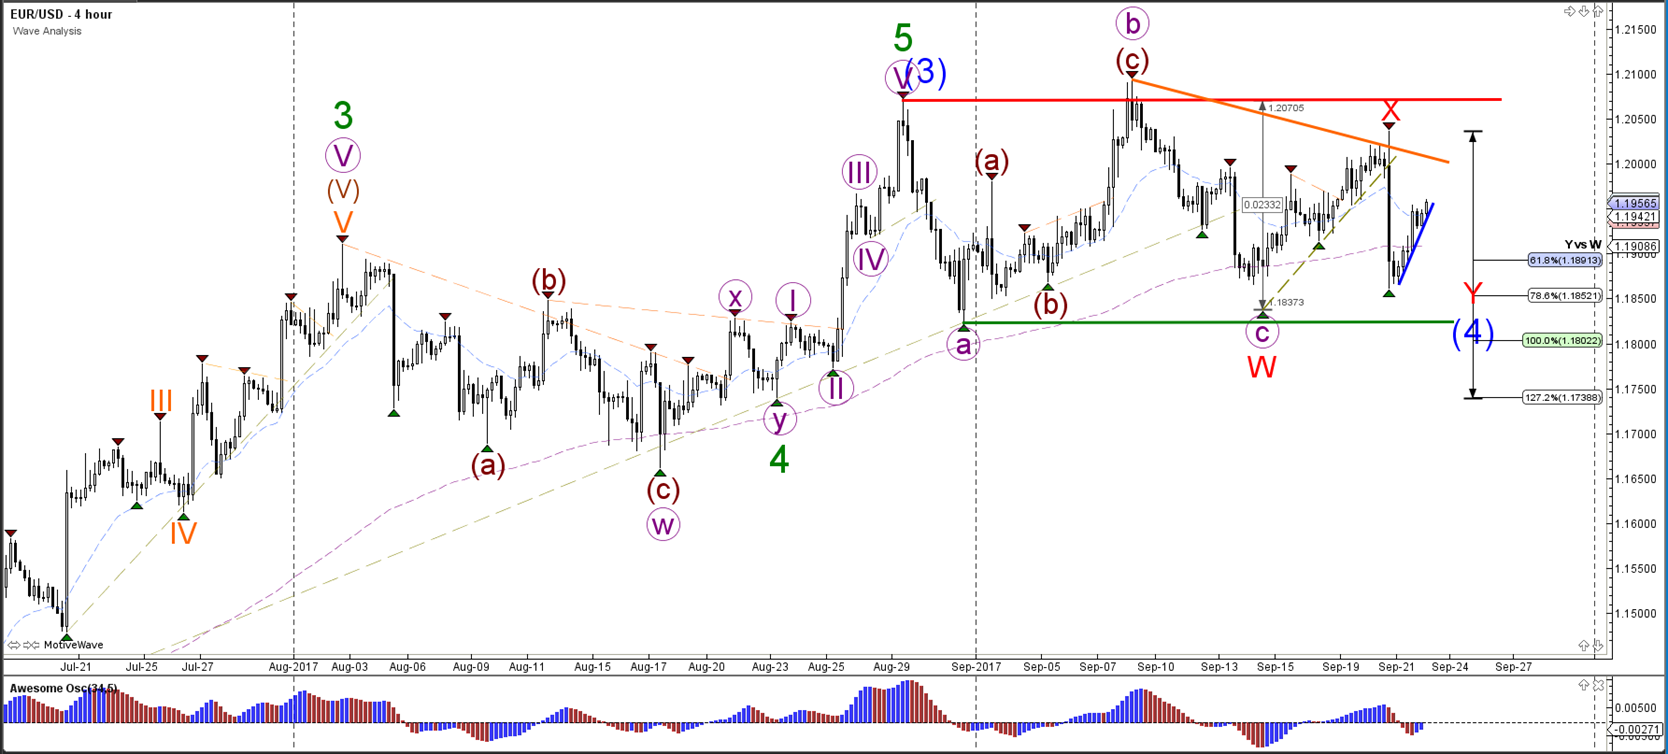
EUR/USD
4 hour

The EUR/USD is moving higher in a bullish trend channel indicated by the support (blue) and resistance (red) trend lines. The new higher high is challenging the 100% Fib level at 1.13 of wave 2 (green), which is a break or bounce zone.
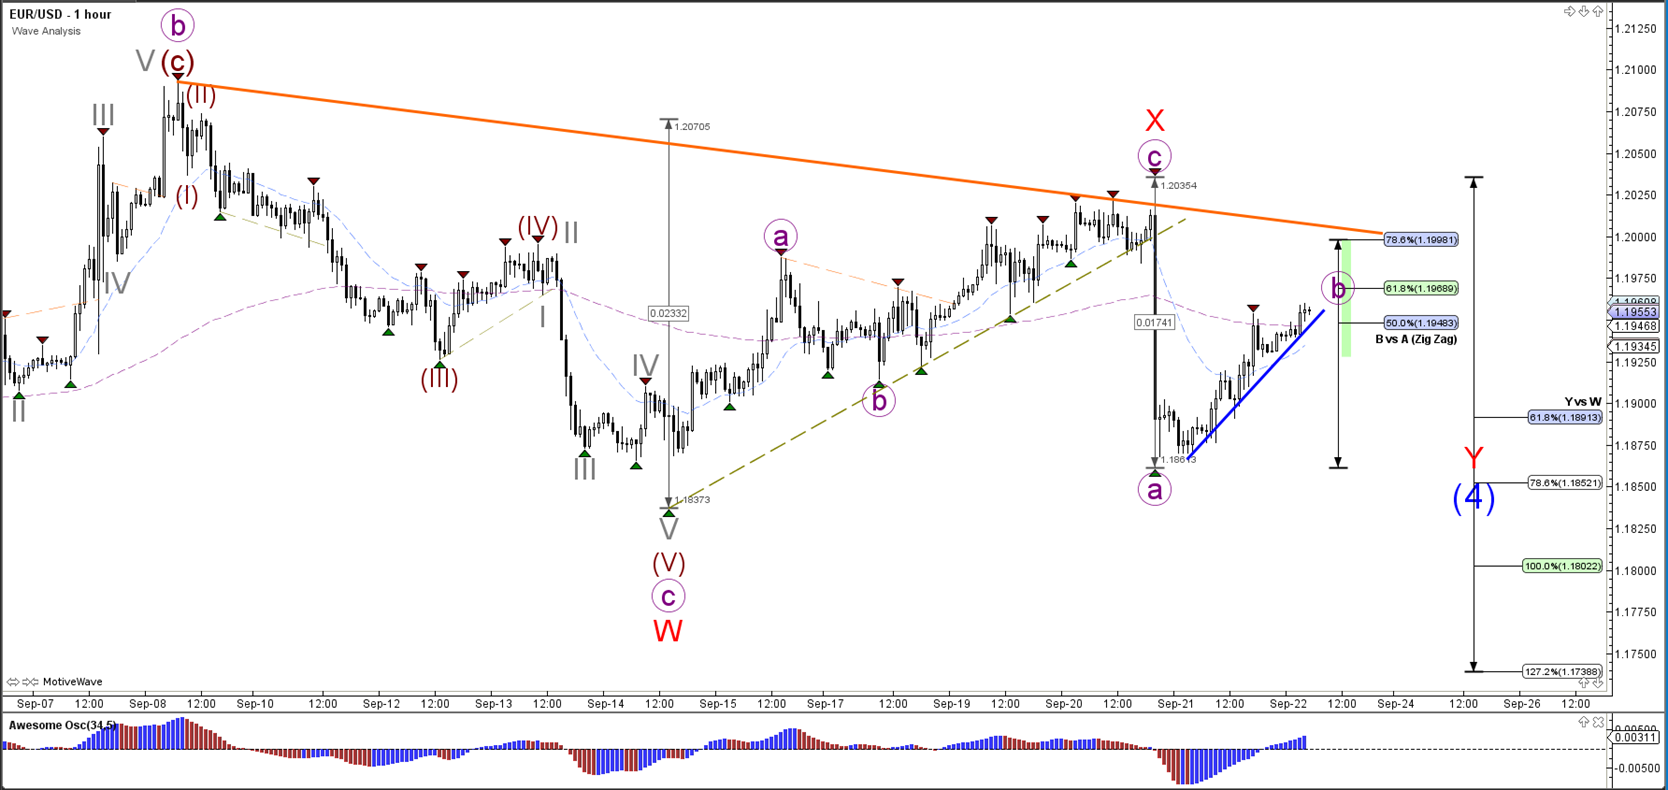
1 hour

The EUR/USD is trying to break above the resistance trend line (dotted orange) but it has a major resistance zone (red) at 1.13 just above it. It remains to be seen whether price will break or bounce at 1.13.
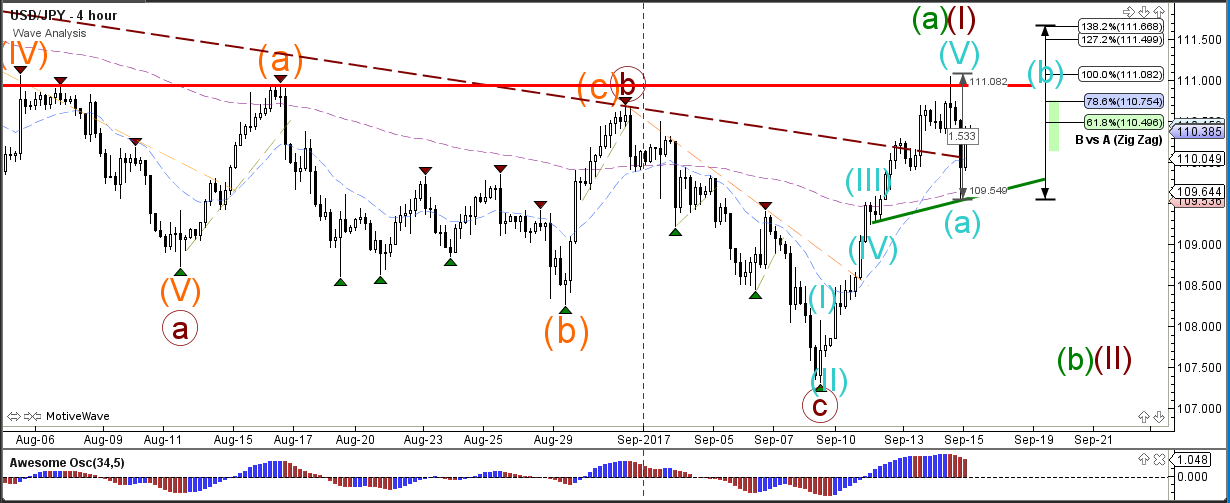
USD/JPY
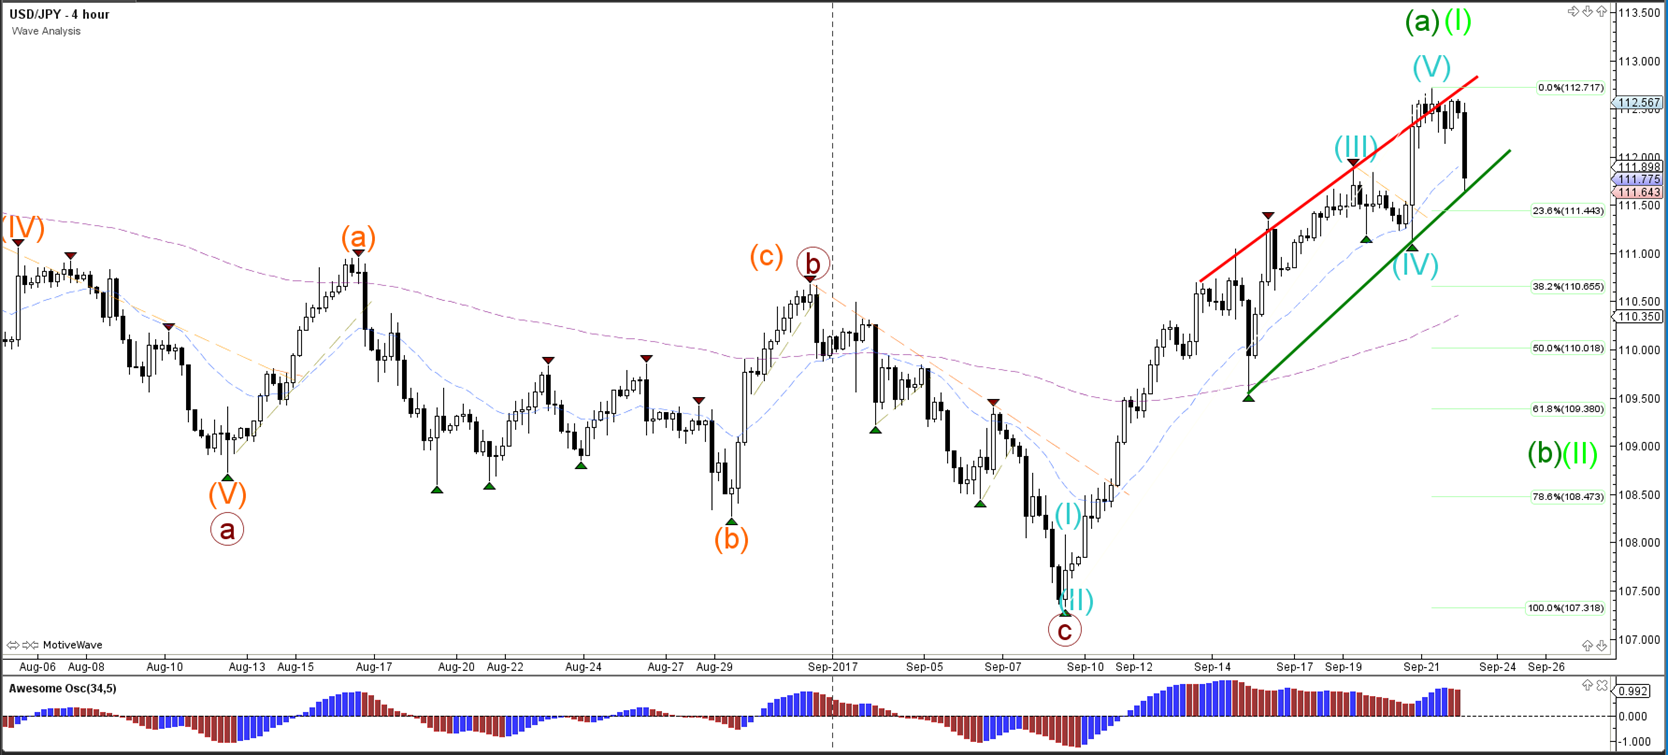
4 hour

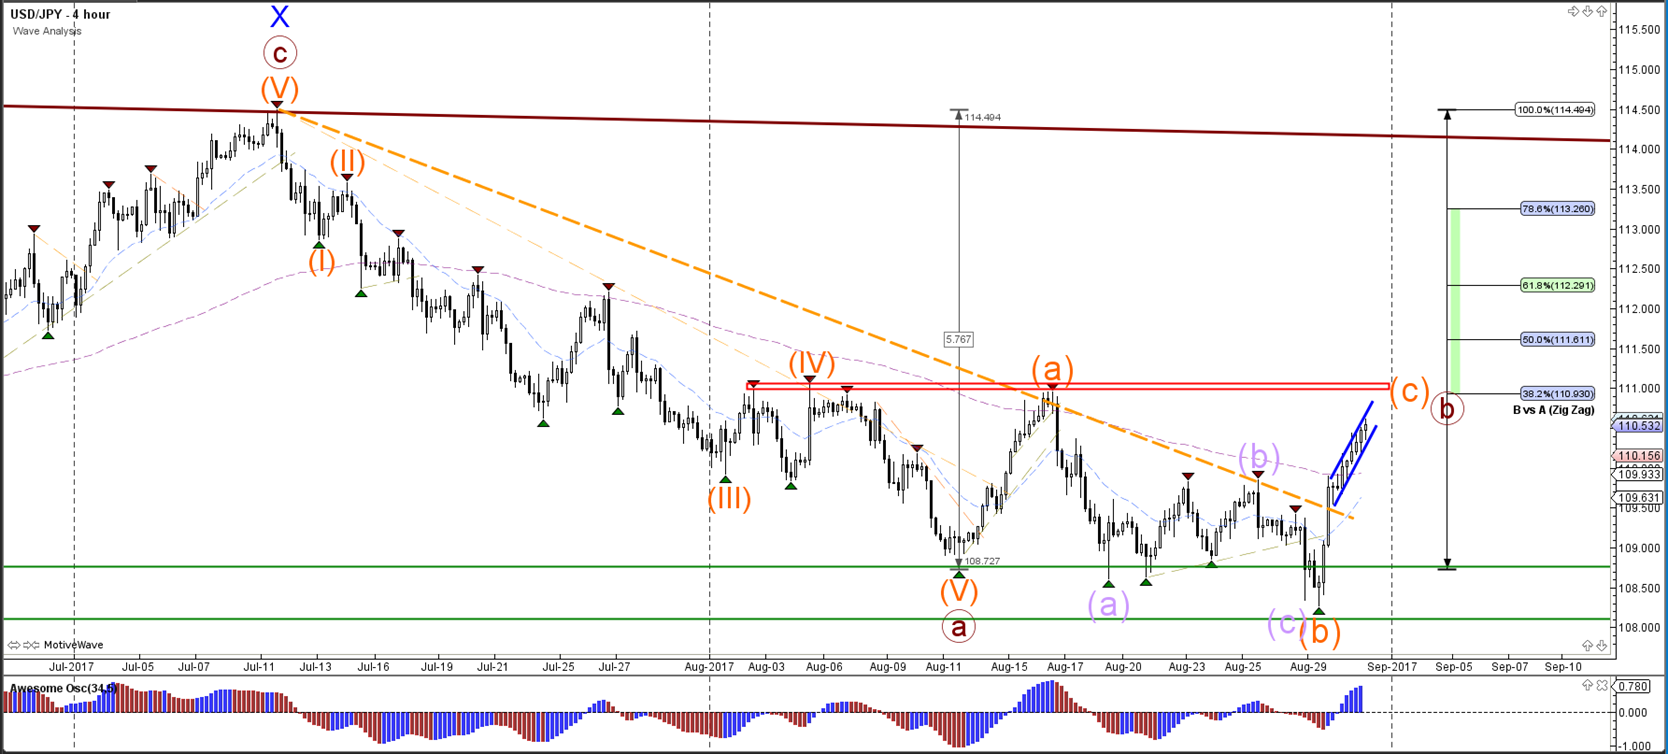
The USD/JPY broke below the support trend line (dotted green) and is challenging the Fibonacci levels of wave B (brown).
1 hour

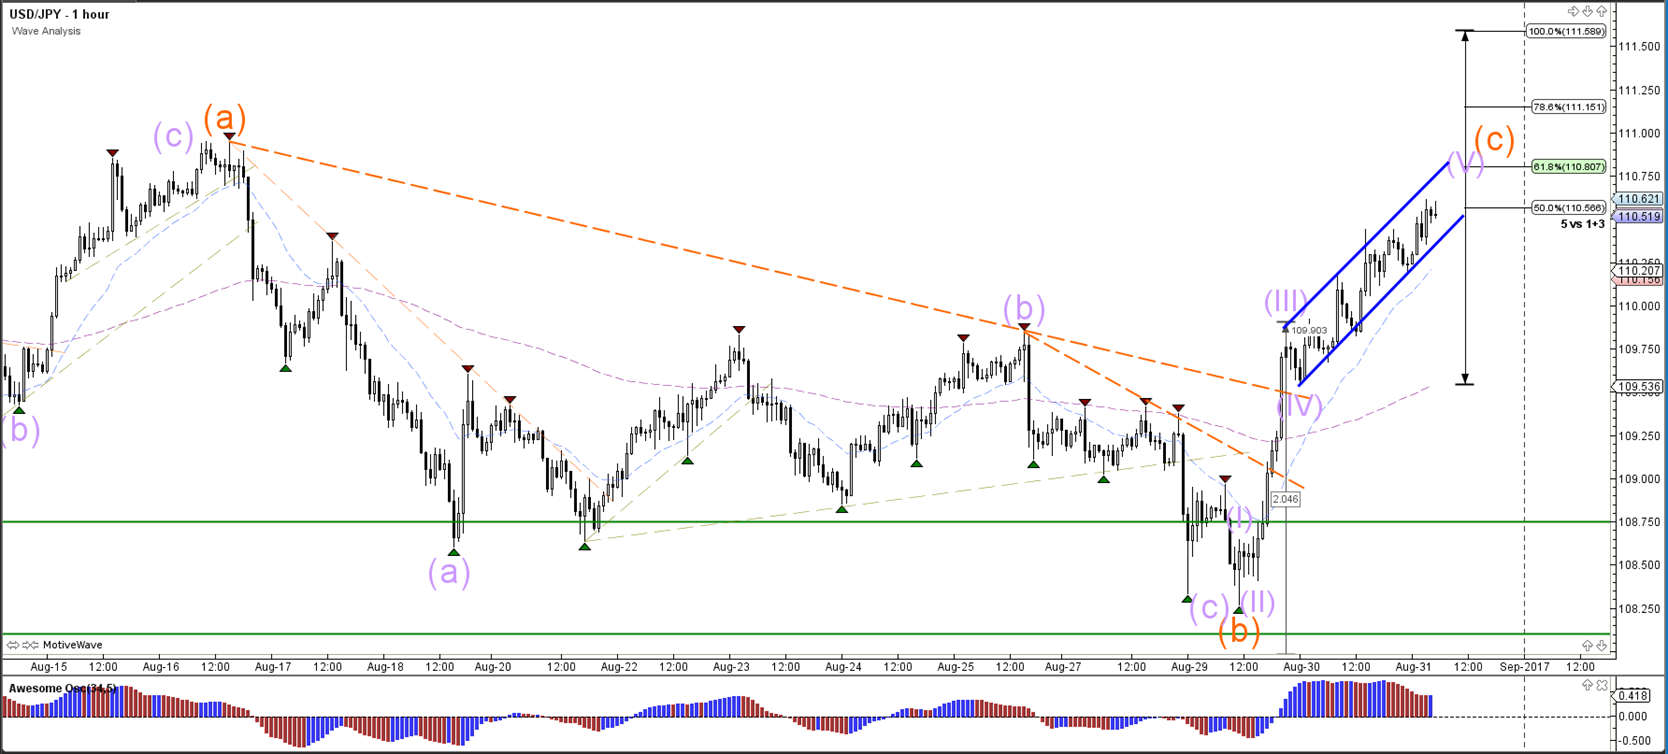
The USD/JPY indeed completed a wave 4 (grey) as indicated earlier this week and is building one more lower low via a wave 5.
Follow @ChrisSvorcik on twitter for latest market updates.
Connect with Chris Svorcik on Facebook for latest market updates.
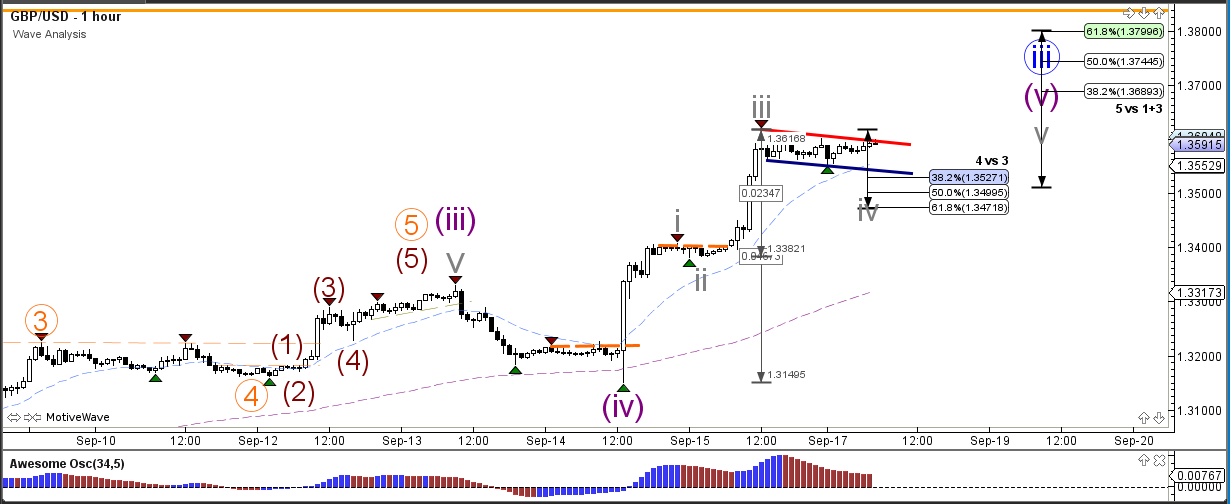
GBP/USD
4 hour
The UK will hold general parliamentary elections on Thursday 8 June 2017.
The GBP/USD broke above the resistance trend line (dotted red) which invalidated yesterday’s bearish wave count and could make a bullish variant more likely although both support and resistance levels remain nearby.
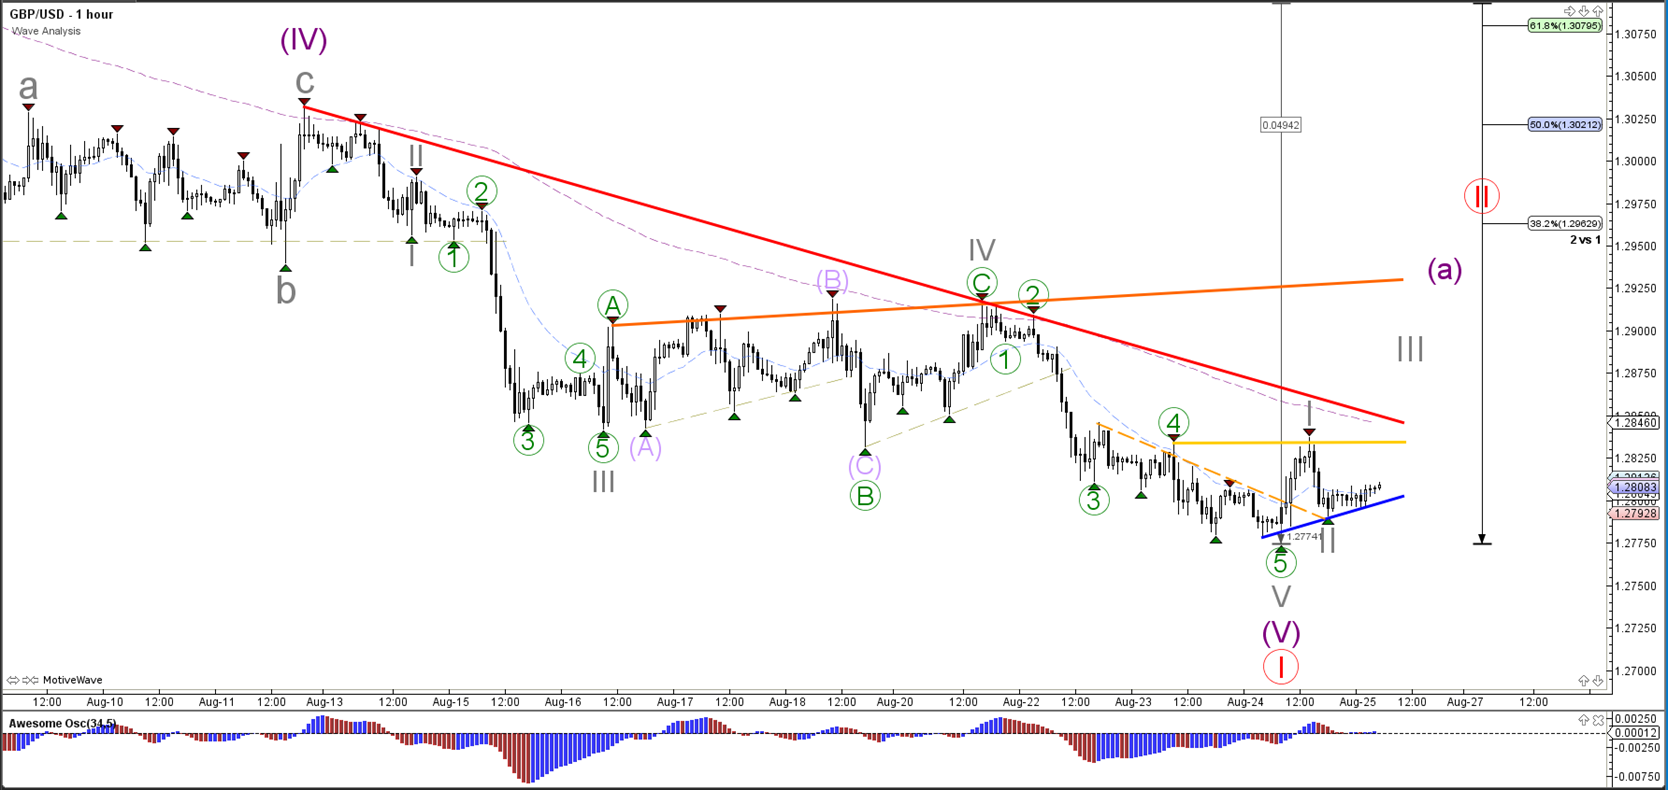
1 hour
The GBP/USD broke out above the smaller resistance line (dotted yellow) and is now challenging the resistance top (red).
EUR/USD
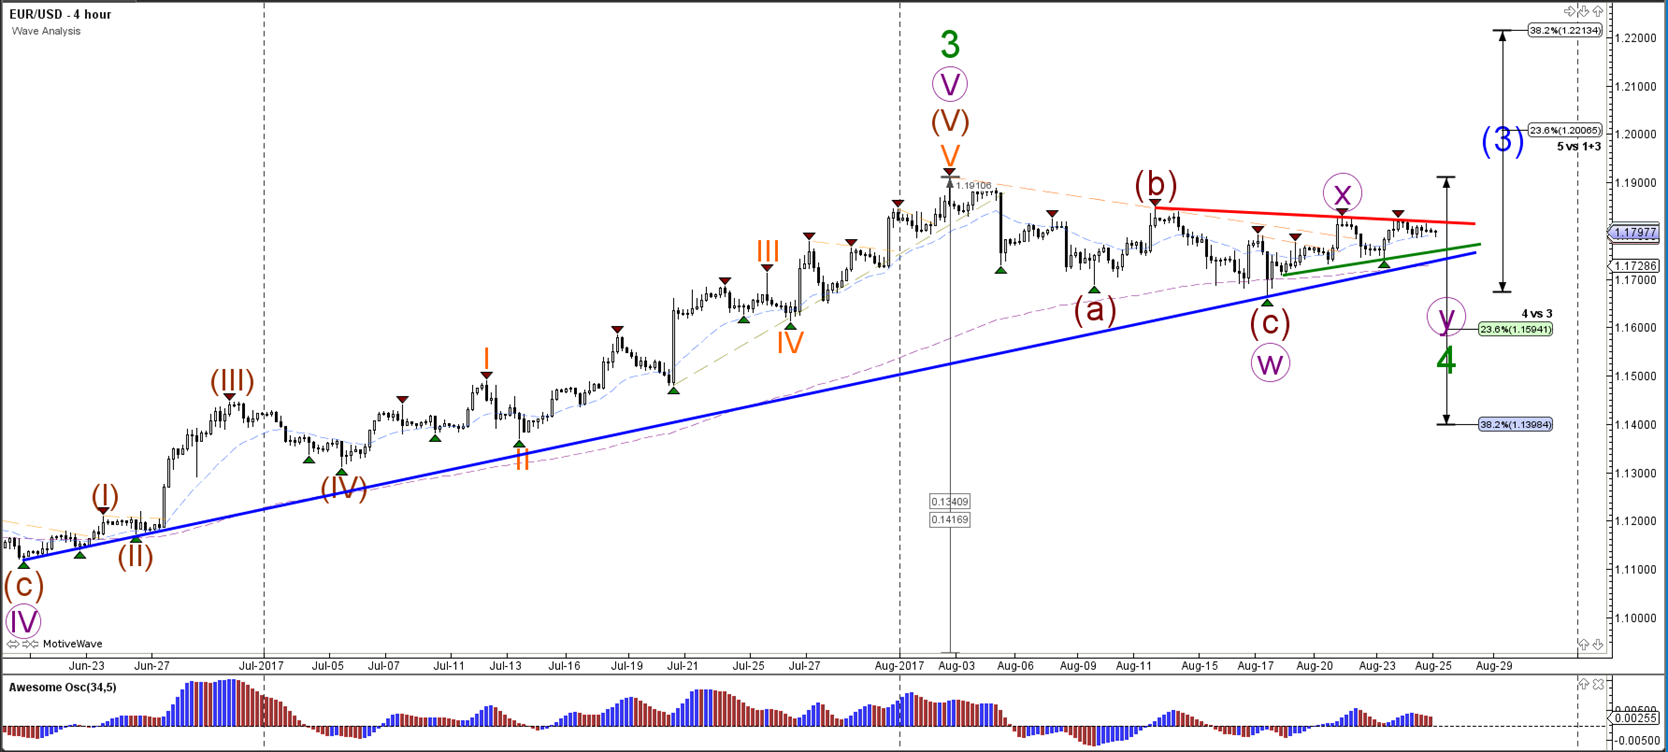
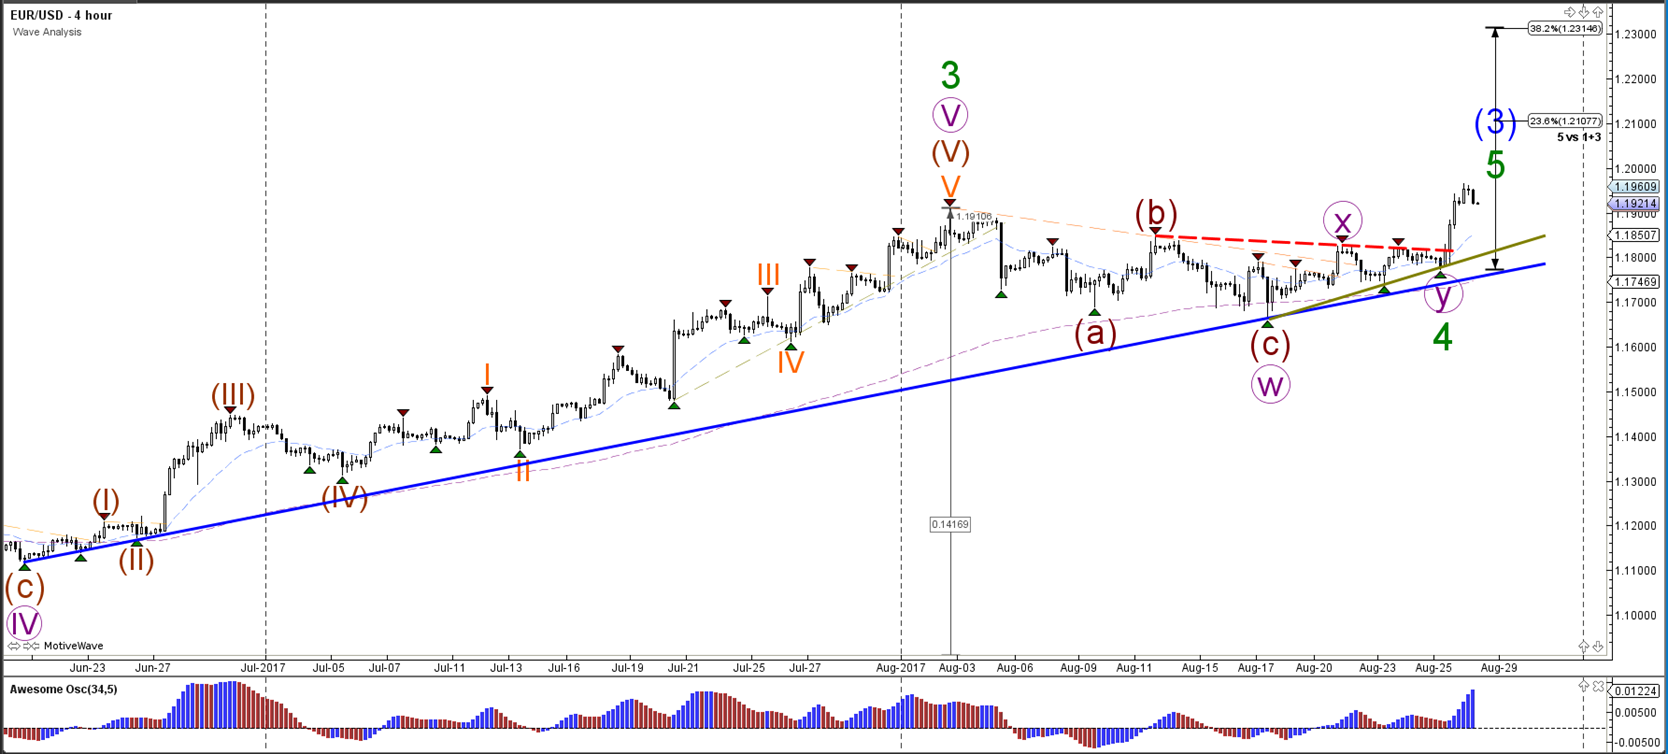
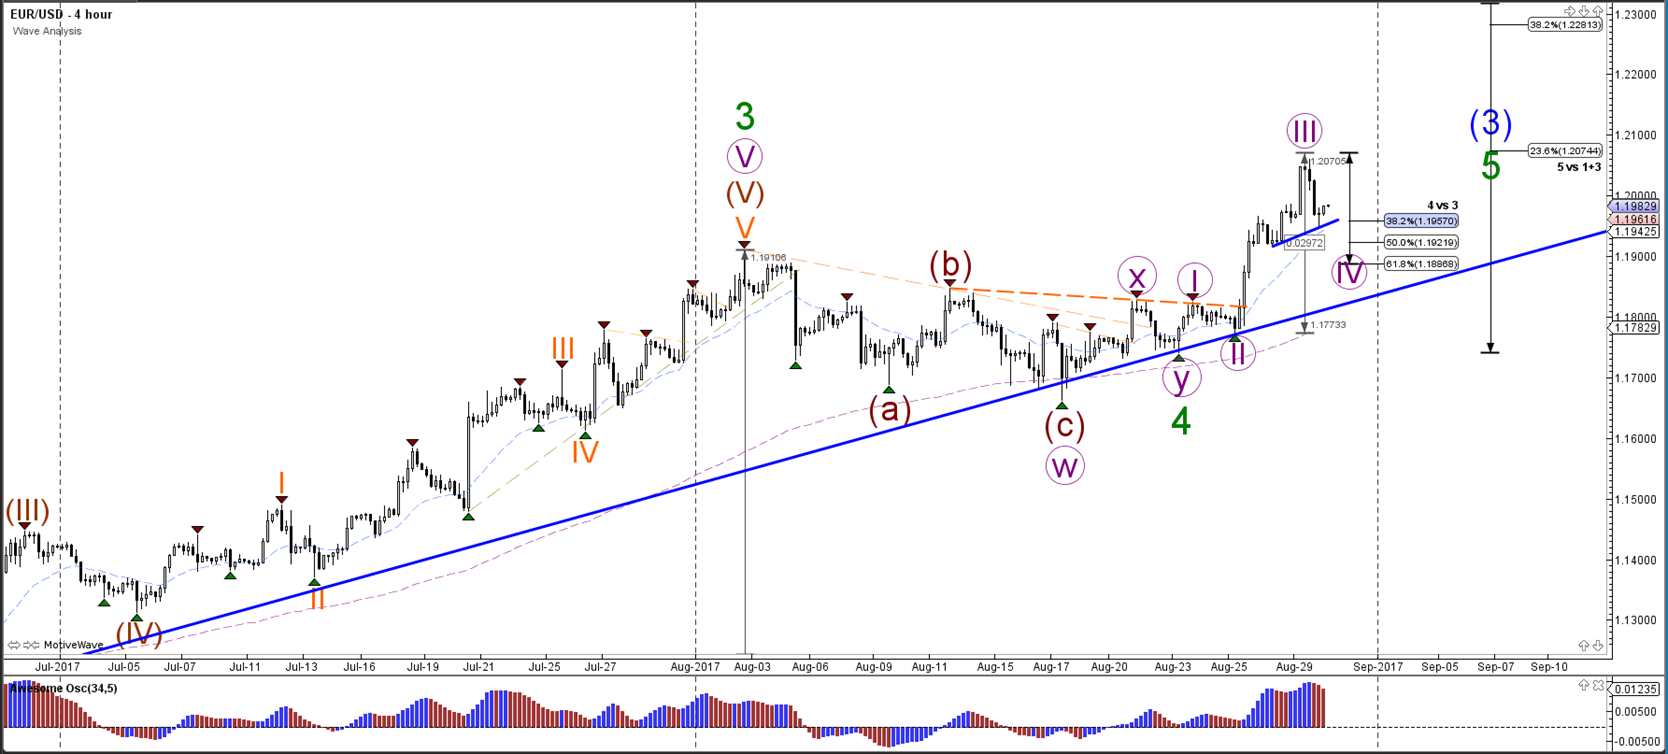
4 hour
The EUR/USD is moving higher in a bullish trend channel indicated by the support (blue) and resistance (red) trend lines. The new higher high is challenging the 100% Fib level at 1.13 of wave 2 (green), which is a break or bounce zone.
1 hour
The EUR/USD is trying to break above the resistance trend line (dotted orange) but it has a major resistance zone (red) at 1.13 just above it. It remains to be seen whether price will break or bounce at 1.13.
USD/JPY
4 hour
The USD/JPY broke below the support trend line (dotted green) and is challenging the Fibonacci levels of wave B (brown).
1 hour
The USD/JPY indeed completed a wave 4 (grey) as indicated earlier this week and is building one more lower low via a wave 5.
Follow @ChrisSvorcik on twitter for latest market updates.
Connect with Chris Svorcik on Facebook for latest market updates.