Daily Technical Outlook

katetrades

Master Trader
Feb 11, 2013
2,560
8
84
Dominica
www.tradersway.com
NZD/JPY Range Setup (November 7, 2013)

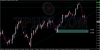
NZD/JPY is about halfway through in climbing to the top of its range on the 4-hour time frame. The pair is approaching the 83.50 minor psychological level, which could hold as resistance.

Stochastic has made its way into the overbought region and has crossed down, indicating that Kiwi bears are ready to push the pair down. A selloff could take the pair back to the bottom of the range at the 80.50 minor psychological level or at least until the middle around 81.50.

131107_nzdjpy.jpg


Shorting at market with a stop above 83.50 and a target of 80.50 could serve as a good swing trade. More conservative traders could wait for the actual test of resistance for a better return on risk.

By Kate Curtis from Trader's Way
 

katetrades

Master Trader
Feb 11, 2013
2,560
8
84
Dominica
www.tradersway.com
USDCHF Downtrend Intact (November 8, 2013)

Thanks to the better than expected headline GDP figure released yesterday, USD/CHF surged up to the .9200 major psychological level which was in line with the 50% Fibonacci retracement level and the falling trend line on the 4-hour time frame.

Stochastic crossed down from the overbought region, hinting that dollar bears will push this pair down, possibly until the previous lows near .8950. Shorting at market with a stop above the previous spike to .9250 and a target of .8950 will give a 2-to-1 return on risk.

131108_usdchf.jpg


Events risks for today include the non-farm payrolls release, which is expected to print a weak reading because of the recent government shutdown.

By Kate Curtis from Trader's Way
 

katetrades

Master Trader
Feb 11, 2013
2,560
8
84
Dominica
www.tradersway.com
USD/JPY Symmetrical Triangle Breakout (November 11, 2013)

After months of consolidation, USD/JPY finally seems ready to break out of its symmetrical triangle. As you can see on the pair’s daily chart, a long green candlestick has already closed above the triangle resistance, hinting that an uptrend is in the works.

The pattern is approximately a thousand pips in height, spanning from a high of 103.00 in May to a low of 93.00. Further rallies could last by roughly 1000 pips as well, but this could take place for months.

131111_usdjpy.jpg


Going long at market with a stop below the triangle support and a target of roughly 1000 pips could be a good position setup with a high return on risk.

By Kate Curtis from Trader's Way
 

katetrades

Master Trader
Feb 11, 2013
2,560
8
84
Dominica
www.tradersway.com
NZD/USD Head and Shoulders (November 12, 2013)

NZD/USD seems to have completed the head and shoulders formation on the 4-hour time frame, pending a break below the neckline around .8225. The pattern is roughly 300 pips in height, which suggests that the resulting breakdown could be of the same height.

Take note though that stochastic is already in the oversold zone, which suggests that Kiwi bears are taking a break. A strong catalyst could be needed for a stronger move lower.

nzdusd.jpg


Setting a sell stop below .8200 might be a good idea for a conservative entry and a stop above .8250 should be able to weather additional volatility.

By Kate Curtis from Trader's Way
 

fx abser

Trader
Nov 5, 2013
17
1
22
signaltoday
EURUSD Falling after breaking channel and horizontal support

EURUSD broke the channel support and horizontal area where it consolidate for few days. ECB rate cut decision has come and there was no stopping EURUSD from falling. A Strong NFP job data accelerate the move after ratracement.

EURUSD now approaching 1.3177-1.3100 area.


Attachments

  • Daily6.png
    Daily6.png
    112.5 KB · Views: 4

katetrades

Master Trader
Feb 11, 2013
2,560
8
84
Dominica
www.tradersway.com
EUR/JPY Rally Over? (November 13, 2013)

Despite the recent ECB interest rate cut, EUR/JPY has still managed to rally in the past few days. The pair has already climbed up to the 61.8% Fibonacci retracement level on the latest swing high and low on the 4-hour time frame, and this area could hold as resistance.

Stochastic is in the overbought zone, suggesting that euro bears are ready to push this pair back down. In addition, the Fib lines up with a former support area and the 134.00 major psychological level.

131113_eurjpy.jpg


Shorting at market with a 50-pip stop and a target around the previous lows near 131.50 would yield a 5:1 return on risk.

By Kate Curtis from Trader's Way
 

katetrades

Master Trader
Feb 11, 2013
2,560
8
84
Dominica
www.tradersway.com
AUD/USD Downtrend Test (November 14, 2013)

A falling trend line can be seen connecting the highs of the price on AUD/USD’s 1-hour time frame, reflecting the ongoing downtrend for the pair. It has just bounced off the .9300 major psychological level and appears ready to test the trend line.

Resistance could hold at the 38.2% to 50% Fib area, as this lines up with the trend line and the .9400 major psychological level. Stochastic is still in the overbought area but hasn’t crossed down, suggesting that Aussie bulls have run out of buying power but that bears aren’t quite ready to push this pair back down.

131114_audusd.jpg


Shorting at .9400 with a stop above the trend line or 61.8% Fibonacci retracement level and a target of new lows could yield a good return on risk for a short-term trade. Moving the stop to entry once the pair tests the previous lows around .9300 could protect profits.

By Kate Curtis from Trader's Way
 

katetrades

Master Trader
Feb 11, 2013
2,560
8
84
Dominica
www.tradersway.com
EUR/AUD Confluence at 1.4450 (November 15, 2013)

EUR/AUD might be ready to resume its drop, as the pair is testing the top of a falling channel on its 4-hour time frame. Stochastic is pointing down from the overbought region, indicating that bears are ready to push the pair lower.

Zooming back a little further shows that the 1.4450 to 1.4500 area lines up with an area of interest. It has served as the neckline of a double top pattern a few months back and has been acting as resistance for a while after the breakdown.

131115_euraud.jpg


Shorting at market with a wide stop above 1.4550 could give this trade enough room to breathe. After all, this cross pair does tend to be volatile. Aiming for the bottom of the channel around 1.4100 would still yield a good return on risk.

By Kate Curtis from Trader's Way
 

katetrades

Master Trader
Feb 11, 2013
2,560
8
84
Dominica
www.tradersway.com
GBP/USD Descending Channel (November 18, 2013)

Last week’s anti-dollar sentiment and relatively upbeat data from the U.K. has triggered a bounce from the bottom of the descending support level on GBP/USD, yet a descending resistance level can also be seen.

The pair is on its way to test the top of the falling channel on the 4-hour time frame while stochastic is indicating overbought conditions. Once the oscillator crosses below the oversold region, a selloff might take place as bears push the pair back to the middle or possibly the bottom of the channel.

131118_gbpusd.jpg


Shorting around the top of the channel around 1.6150 with a stop above 1.6200 could mean at least a 4:1 return on risk, depending on how wide the stop is.

By Kate Curtis from Trader's Way
 

katetrades

Master Trader
Feb 11, 2013
2,560
8
84
Dominica
www.tradersway.com
EUR/GBP Long-Term Channel (November 19, 2013)

EUR/GBP has sold off in the past few days but the daily time frame seems to suggest that a bounce is in the cards. The pair is currently testing the bottom of the descending channel right around the .8400 major psychological support level.

Stochastic has moved out of the oversold region, suggesting that euro bulls are ready to push the pair back up to the top of the channel or probably just around the middle or its previous highs. A close above the .8400 level could mean that buying pressure is strong and that the pair could climb at least to the .8500 mark.

131119_eurgbp.jpg


Going long at market with a stop below the channel or .8300 could be at least a 1:1 trade with a target of .8500. Aiming for the top of the channel around .8600 could be a 2:1 return on risk.

By Kate Curtis from Trader's Way
 

katetrades

Master Trader
Feb 11, 2013
2,560
8
84
Dominica
www.tradersway.com
AUD/USD Head and Shoulders Forming? (November 20, 2013)

AUD/USD has just come off a strong selloff and looks ready to make a pullback to the Fibonacci retracement levels marked on the 4-hour time frame. It seems that the right shoulder on the potential head and shoulders pattern is about to form if the Fib levels hold.

Stochastic is still around the overbought levels, indicating that the selloff could resume soon. The 50% Fib is in line with the .9500 major psychological level and an area of interest, making it a potential resistance area.

131120_audusd.jpg


Shorting at .9500 with a stop above the 61.8% Fib level or .9575 would make a 2:1 trade if one aims for the recent lows around .9350.

By Kate Curtis from Trader's Way
 

katetrades

Master Trader
Feb 11, 2013
2,560
8
84
Dominica
www.tradersway.com
NZD/USD Range Behavior (November 21, 2013)

After testing .8400 resistance in the past few weeks, NZD/USD looks ready to head back to the bottom of its range, as seen on the 1-hour time frame. There’s support at the .8200 major psychological level, which has held in the past few weeks as well.

Stochastic has reached the overbought mark, which hints at a potential bounce sooner or later. A rally from the bottom of the range could last at least until the middle around .8300 while stronger buying pressure could push the pair up to the top at .8400.

131121_nzdusd.jpg


Going long at .8200 with a 50-pip stop or a stop below that previous spike could yield a good return on risk of 4:1. Moving the stop to entry once price tests .8300 is a good way to protect profits and manage risk.

By Kate Curtis from Trader's Way
 

katetrades

Master Trader
Feb 11, 2013
2,560
8
84
Dominica
www.tradersway.com
EUR/USD Trend Line Retest (November 22, 2013)

EUR/USD finally broke below that tight consolidation on top of a rising trend line, but it appears that a pullback could be in the cards. The pair bounced off the 1.3400 major psychological level and appears ready to retrace to the Fibs on the 1-hour time frame.

The 61.8% Fibonacci retracement level is in line with the trend line and is close to the 1.3500 major psychological resistance. Stochastic is already in the oversold region, with a shallow bearish divergence indicating that bears are ready to push the pair back down soon.

131122_eurusd.jpg


Shorting at 1.3500 with a 50-pip stop and a target of the previous lows around 1.3400 could yield a 2:1 return on risk.

By Kate Curtis from Trader's Way
 

katetrades

Master Trader
Feb 11, 2013
2,560
8
84
Dominica
www.tradersway.com
NZD/USD Support-turned-resistance at .8200 (November 25, 2013)

NZD/USD just broke below the key support level at .8200 last week but it appears that price needs to retrace before heading any lower. On the 1-hour time frame, the 38.2% Fibonacci retracement level is close to the broken support, which might then act as resistance.

However, stochastic has just reached overbought levels but hasn’t shown any sign of crossing down yet. Kiwi bulls might have enough buying power to push the pair a little higher, perhaps until the next Fib levels before the selloff resumes.

131125_nzdusd.jpg


Shorting at market with a stop above the 61.8% Fib level and a target of 200 pips, which is the same size as the previous range, could yield a decent return on risk for a short-term trade.

By Kate Curtis from Trader's Way
 

katetrades

Master Trader
Feb 11, 2013
2,560
8
84
Dominica
www.tradersway.com
AUD/USD Neckline Pullback? (November 26, 2013)

Just last week, AUD/USD broke below the neckline of the head and shoulders pattern on the 4-hour time frame, indicating that a long-term downtrend might be in the cards. However, the pair looks prime for a retracement as sellers gather more energy.

Stochastic is still climbing out of the oversold levels, suggesting that a bounce is in the cards for the near term. From there, the pair might find resistance around the .9300 handle, which is around the broken neckline.

131126_audusd.jpg


Shorting at .9300 with a stop above the 61.8% Fib or wider could yield a good return on risk. Aiming for new lows or the next support at .8900 is a potential swing trade opportunity until the end of the year but locking in profits or moving the stop to entry once price tests the recent lows at .9100 can help limit exposure.

By Kate Curtis from Trader's Way
 

katetrades

Master Trader
Feb 11, 2013
2,560
8
84
Dominica
www.tradersway.com
Symmetrical Triangle on CAD/JPY (November 27, 2013)

CAD/JPY has staged such a strong rally recently yet it seems to be reaching an exhaustion at the moment. In fact, a bearish divergence can be seen with price making higher highs and stochastic making lower highs this month.

Aside from that, the pair is testing the top of a symmetrical triangle forming on its 4-hour time frame. If the top of the triangle holds as resistance, the pair might be on its way back to the bottom or until the middle of the triangle.

131127_cadjpy.jpg


Shorting at market with a stop above the triangle could yield a high return on risk if one aims for the bottom of the triangle around 94.00. Moving the stop to entry once price reaches the middle of the triangle somewhere close to 94.50 is a good way to protect profits.

By Kate Curtis from Trader's Way
 

katetrades

Master Trader
Feb 11, 2013
2,560
8
84
Dominica
www.tradersway.com
AUD/JPY Range Trade (November 28, 2013)

AUD/JPY has just tested and bounced off the bottom of the range visible on the 1-hour and 4-hour time frames. It has shown enough momentum, perhaps enough to push it back to the top of the range around 94.20.

However, stochastic has already reached the overbought level, indicating that Aussie bulls are running out of steam. If that’s the case, the pair might make another test of the range bottom before resuming its climb.

131128_audjpy.jpg


Going long at market with a stop below the previous low around 92.25 and a target of 94.20 would yield at least a 1:1 return on risk, which is good enough for a short-term trade.

By Kate Curtis from Trader's Way
 

katetrades

Master Trader
Feb 11, 2013
2,560
8
84
Dominica
www.tradersway.com
GBP/USD Long-Term Rally (November 29, 2013)

After months of consolidation inside a 300-pip range, GBP/USD finally made an upside breakout as it reached the 1.6350 minor psychological level recently. This could mean that more gains are in the cards, as the next resistance level is located around 1.6700.

In addition, the size of the breakout is typically the same size as the rectangle pattern. In this case, it spans from 1.5950 to 1.6250, so the resulting breakout could carry on to 1.6600-1.6650.

131129_gbpusd.jpg


Going long at market with a stop inside the range and below 1.6250 could yield a 3:1 return on risk if you’re aiming for 1.6650. Moving stop to entry once price heads halfway there is a good way to manage exposure. Adding every 100 or 150 pips could increase the reward ratio.

By Kate Curtis from Trader's Way
 

katetrades

Master Trader
Feb 11, 2013
2,560
8
84
Dominica
www.tradersway.com
AUD/USD Major Pullback (December 2, 2013)

After breaking below the neckline of the head and shoulders pattern on the 4-hour time frame, AUD/USD looks ready to make a quick pullback before resuming its selloff.

The pair found support just around the .9050 to .9100 psychological levels and appears ready to retrace to the .9200 to .9300 area, which is spanned by the Fibonacci retracement levels.

131202_audusd.jpg


The broken neckline of the reversal pattern lines up with the .9300 handle, which might be the line in the sand for any rallies. An aggressive entry could be set at the .9200 level with a stop above .9300 and aiming for new lows could yield a good return on risk.

By Kate Curtis from Trader's Way