Daily US Dollar / Japanese Yen-USDJPY As of 29/07/16
*** Intra-Daily Trading Strategy: SELL US Dollar / Japanese Yen
Sell Target: 100.8193
Enter New SELL on OPEN and exit SELL positions at Target price or at Stop price.
(NOTE: Adjust Stop Loss Price according to your trading risk.)
Do not reverse after exiting. This is a recommendation for INTRA-DAY TRADING only!!!!!
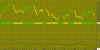
A big bearish black candle has formed. Prices closed considerably lower than open. If the candle appears when prices are "high," it may be the first sign of a top. If it occurs when prices are confronting an overhead resistance area, a moving average, trend line, or price resistance level, the long black candle adds credibility to the resistance. Likewise, if the candle appears as prices break below a support area, the long black candle confirms the failure of the support area.
The previous 10 candlestick bars, there are 5 white candles versus 5 black candles.
The previous 50 candlestick bars, there are 21 white candles versus 29 black candles with a net of 8 black candles.
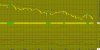
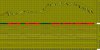
MACD is BEARISH as the MACD is below the signal line.
The MACD crossed below the signal line 0 day(s) ago. Since the MACD crossed the MACD moving average, US Dollar / Japanese Yen's price has been unchanged, and has been fluctuating from a high of 105.518 to a low of 101.969.
The MACD is currently not in an Overbought/Oversold range.
There have been no divergence signals during the last 5 periods.
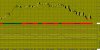
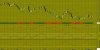
No Stochastic Buy or Sell signals generated today. The last signal was a Sell 4 Day(s) Ago.
The RSI is not currently in a topping (above 70) or bottoming (below 30) range. A buy or sell signal generated when the RSI moves out of an overbought/oversold area. The last signal was a Buy 14 day(s) ago.
The RSI has just reached its lowest value in the last 14 day(s). This is BEARISH signal.
Currently, the Momentum Oscillator does not show an overbought or oversold condition.
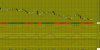
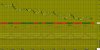
The DMI BUY reference point was crossed. If you are still buying, this might be a good place to stop out and prevent losses.
The last Directional Movement Indicators (DMI) signal was a BUY 11 day(s) ago.
There were no SAR signals generated today. The last SAR signal was a Sell 1 day(s) ago.
The close is currently
BELOW its 200 daily moving average
BELOW its 50 daily moving average
BELOW its 20 daily moving average
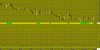
The current market condition for US Dollar / Japanese Yen is Very Bearish
US Dollar / Japanese Yen closed above the lower Bollinger Band by 24.9%. Bollinger Bands are 53.49% wider than normal.
*** Intra-Daily Trading Strategy: SELL US Dollar / Japanese Yen
Sell Target: 100.8193
Enter New SELL on OPEN and exit SELL positions at Target price or at Stop price.
(NOTE: Adjust Stop Loss Price according to your trading risk.)
Do not reverse after exiting. This is a recommendation for INTRA-DAY TRADING only!!!!!
A big bearish black candle has formed. Prices closed considerably lower than open. If the candle appears when prices are "high," it may be the first sign of a top. If it occurs when prices are confronting an overhead resistance area, a moving average, trend line, or price resistance level, the long black candle adds credibility to the resistance. Likewise, if the candle appears as prices break below a support area, the long black candle confirms the failure of the support area.
The previous 10 candlestick bars, there are 5 white candles versus 5 black candles.
The previous 50 candlestick bars, there are 21 white candles versus 29 black candles with a net of 8 black candles.
MACD is BEARISH as the MACD is below the signal line.
The MACD crossed below the signal line 0 day(s) ago. Since the MACD crossed the MACD moving average, US Dollar / Japanese Yen's price has been unchanged, and has been fluctuating from a high of 105.518 to a low of 101.969.
The MACD is currently not in an Overbought/Oversold range.
There have been no divergence signals during the last 5 periods.
No Stochastic Buy or Sell signals generated today. The last signal was a Sell 4 Day(s) Ago.
The RSI is not currently in a topping (above 70) or bottoming (below 30) range. A buy or sell signal generated when the RSI moves out of an overbought/oversold area. The last signal was a Buy 14 day(s) ago.
The RSI has just reached its lowest value in the last 14 day(s). This is BEARISH signal.
Currently, the Momentum Oscillator does not show an overbought or oversold condition.
The DMI BUY reference point was crossed. If you are still buying, this might be a good place to stop out and prevent losses.
The last Directional Movement Indicators (DMI) signal was a BUY 11 day(s) ago.
There were no SAR signals generated today. The last SAR signal was a Sell 1 day(s) ago.
The close is currently
BELOW its 200 daily moving average
BELOW its 50 daily moving average
BELOW its 20 daily moving average
The current market condition for US Dollar / Japanese Yen is Very Bearish
US Dollar / Japanese Yen closed above the lower Bollinger Band by 24.9%. Bollinger Bands are 53.49% wider than normal.