SAR
SAR triggered a Buy signal today. Exit positions if short.
Trend Analysis
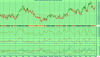
USDCAD prices close
above the 200, 50 and 20 period Moving Average
The current trend for US Dollar / Canadian Dollar is Extremely Bullish
US Dollar / Canadian Dollar broke above the upside resistance level of 1.04 today. This is a bullish sign. This previous resistance level of 1.04 now provide downside support. The most recently confirmed downside support level for US Dollar / Canadian Dollar is around 0.98. Expect prices to have some difficulty falling below this level. A break below this level particularly on heavy trading would be a bearish sign.
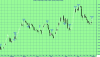
Bollinger Band
US Dollar / Canadian Dollar closed below the upper Bollinger Band by 45.4%. Bollinger Bands are 14.87% wider than normal. The current width of the Bollinger Bands (alone) does not suggest anything conclusive about the future volatility or movement of prices.
Candlestick
White Body has formed as prices closed higher than the open.
The past 10 candlesticks there are 4 white candles and 6 black candles with a net of 2 black candles.
The past 50 candlesticks there are 25 white candles and 25 black candles .
Overall, the bias in prices is: Sideways.
Short term: Prices are stalling.
Intermediate term: Prices are ranging.
The projected upper bound is: 1.05.
The projected lower bound is: 1.02.
The projected closing price is: 1.04.
Technical Outlook
Short Term:Neutral
Intermediate Term:Bearish
Long Term:Bullish
SAR triggered a Buy signal today. Exit positions if short.
Trend Analysis
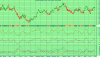
USDCAD prices close
above the 200, 50 and 20 period Moving Average
The current trend for US Dollar / Canadian Dollar is Extremely Bullish
US Dollar / Canadian Dollar broke above the upside resistance level of 1.04 today. This is a bullish sign. This previous resistance level of 1.04 now provide downside support. The most recently confirmed downside support level for US Dollar / Canadian Dollar is around 0.98. Expect prices to have some difficulty falling below this level. A break below this level particularly on heavy trading would be a bearish sign.
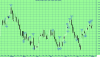
Bollinger Band
US Dollar / Canadian Dollar closed below the upper Bollinger Band by 45.4%. Bollinger Bands are 14.87% wider than normal. The current width of the Bollinger Bands (alone) does not suggest anything conclusive about the future volatility or movement of prices.
Candlestick
White Body has formed as prices closed higher than the open.
The past 10 candlesticks there are 4 white candles and 6 black candles with a net of 2 black candles.
The past 50 candlesticks there are 25 white candles and 25 black candles .
Overall, the bias in prices is: Sideways.
Short term: Prices are stalling.
Intermediate term: Prices are ranging.
The projected upper bound is: 1.05.
The projected lower bound is: 1.02.
The projected closing price is: 1.04.
Technical Outlook
Short Term:Neutral
Intermediate Term:Bearish
Long Term:Bullish