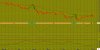
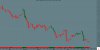
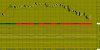
Weekly US Dollar / Japanese Yen-USDJPY As of 27/05/16
A white body has formed as prices closed higher than open.
The previous 10 candlestick bars, there are 7 white candles versus 3 black candles with a net of 4 white candles.
The previous 50 candlestick bars, there are 26 white candles versus 24 black candles with a net of 2 white candles.
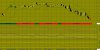
A long lower shadow has formed. This is typically a bullish signal (particularly when it occurs near a low price level, at a support level, or when the security is oversold).A spinning top has formed which is a candle with a small real body. Spinning tops identify a session in which there is little price action as defined by the difference between the open and the close. During a rally or near new highs, a spinning top can be a sign that prices are losing momentum and the bulls may be in trouble.Three white candles has formed during the last three bars. Although these candles were not big enough to create three white soldiers, the steady upward pattern is bullish.MACD is BEARISH as the MACD is below the signal line.
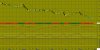
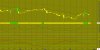
The MACD crossed below the signal line 24 week(s) ago. Since the MACD crossed the MACD moving average, US Dollar / Japanese Yen's price has decreased 8.87%, and has been fluctuating from a high of 123.538 to a low of 105.543.
The MACD is currently not in an Overbought/Oversold range.
There have been no divergence signals during the last 5 periods.
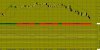
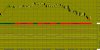
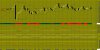
No Stochastic Buy or Sell signals generated today. The last signal was a Buy 1 Week(s) Ago.
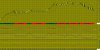
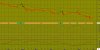
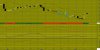
A Stochastic Bullish divergence signal was generated today.The RSI is not currently in a topping (above 70) or bottoming (below 30) range. A buy or sell signal generated when the RSI moves out of an overbought/oversold area. The last signal was a Buy 6 week(s) ago.
The RSI has just reached its highest value in the last 14 week(s). This is BULLISH signal.
The RSI has set a new 14-period high while the price of US Dollar / Japanese Yen has not. This is a BULLISH DIVERGENCE.
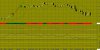
Currently, the Momentum Oscillator does not show an overbought or oversold condition.
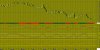
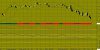
The last Directional Movement Indicators (DMI) signal was a SELL 39 week(s) ago.
There were no SAR signals generated today. The last SAR signal was a Sell 20 week(s) ago.
The close is currently
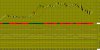
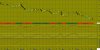
ABOVE its 200 weekly moving average
BELOW its 50 weekly moving average
BELOW its 20 weekly moving average
The current market condition for US Dollar / Japanese Yen is Mildly Bullish
US Dollar / Japanese Yen closed above the lower Bollinger Band by 35.7%. Bollinger Bands are 57.66% wider than normal.
A white body has formed as prices closed higher than open.
The previous 10 candlestick bars, there are 7 white candles versus 3 black candles with a net of 4 white candles.
The previous 50 candlestick bars, there are 26 white candles versus 24 black candles with a net of 2 white candles.
A long lower shadow has formed. This is typically a bullish signal (particularly when it occurs near a low price level, at a support level, or when the security is oversold).A spinning top has formed which is a candle with a small real body. Spinning tops identify a session in which there is little price action as defined by the difference between the open and the close. During a rally or near new highs, a spinning top can be a sign that prices are losing momentum and the bulls may be in trouble.Three white candles has formed during the last three bars. Although these candles were not big enough to create three white soldiers, the steady upward pattern is bullish.MACD is BEARISH as the MACD is below the signal line.
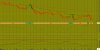
The MACD crossed below the signal line 24 week(s) ago. Since the MACD crossed the MACD moving average, US Dollar / Japanese Yen's price has decreased 8.87%, and has been fluctuating from a high of 123.538 to a low of 105.543.
The MACD is currently not in an Overbought/Oversold range.
There have been no divergence signals during the last 5 periods.
No Stochastic Buy or Sell signals generated today. The last signal was a Buy 1 Week(s) Ago.
A Stochastic Bullish divergence signal was generated today.The RSI is not currently in a topping (above 70) or bottoming (below 30) range. A buy or sell signal generated when the RSI moves out of an overbought/oversold area. The last signal was a Buy 6 week(s) ago.
The RSI has just reached its highest value in the last 14 week(s). This is BULLISH signal.
The RSI has set a new 14-period high while the price of US Dollar / Japanese Yen has not. This is a BULLISH DIVERGENCE.
Currently, the Momentum Oscillator does not show an overbought or oversold condition.
The last Directional Movement Indicators (DMI) signal was a SELL 39 week(s) ago.
There were no SAR signals generated today. The last SAR signal was a Sell 20 week(s) ago.
The close is currently
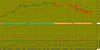
ABOVE its 200 weekly moving average
BELOW its 50 weekly moving average
BELOW its 20 weekly moving average
The current market condition for US Dollar / Japanese Yen is Mildly Bullish
US Dollar / Japanese Yen closed above the lower Bollinger Band by 35.7%. Bollinger Bands are 57.66% wider than normal.