Auto TrendLines Indicator Overview
The Auto TrendLines Indicator for MT4 is a smart technical analysis tool that automatically draws dynamic ascending and descending trendlines on the price chart. By analyzing swing highs and lows, the indicator accurately identifies market structure and visually highlights the prevailing trend direction.This automated approach removes subjectivity from manual trendline drawing and helps traders clearly recognize key support and resistance levels.
Technical Specifications
Category | Details |
Indicator Categories | Support & Resistance Indicators for MT4, Signal & Forecast Indicators for MT4, Price Level Indicators |
Platform | MetaTrader 4 (MT4) |
Trading Skill Level | Beginner (Elementary) |
Indicator Types | Breakout Indicator, Reversal Indicator |
Timeframe Compatibility | Multi-Timeframe |
Trading Styles | Day Trading, Scalping, Swing Trading |
Supported Markets | Forex, Cryptocurrencies, Stocks & Shares, Indices, Commodities |
Download Link |
Auto TrendLines Indicator at a Glance
The indicator automatically plots:· Green ascending trendlines to represent bullish support
· Red descending trendlines to represent bearish resistance
When price approaches, breaks, or reacts to these trendlines, the indicator generates trading signals aligned with the market direction, making it easier to spot potential entries and reversals.
Buy Signal Explanation
On the EUR/JPY daily chart, price breaks above a descending trendline. The indicator detects this bullish breakout and confirms a buy signal, which is displayed using a green arrow.This signal typically indicates a potential trend reversal or the beginning of a bullish continuation.
Sell Signal Explanation
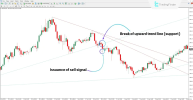
Based on the 4-hour chart of Solana (SOL), price breaks below an ascending trendline that previously acted as support. Immediately after this breakdown, the indicator generates a sell signal, marked by a red arrow.Such signals often suggest increasing bearish momentum and a possible downward trend continuation.
Auto TrendLines Indicator Settings
The Auto TrendLines Indicator includes customizable parameters to adapt to various trading strategies:· PivotPeriod: Number of candles used to detect pivot points
· Lines: Maximum number of trendlines displayed
· ShiftLastPivot: Horizontal shift applied to the most recent pivot
· HistoryLimit: Number of historical candles analyzed
· ExtendLines: Enables trendline extension across the chart
· ShowArrows: Displays signal arrows on the chart
· UpTrendColor: Color of bullish (ascending) trendlines
· DownTrendColor: Color of bearish (descending) trendlines
· TrendlineWidth: Thickness of the trendlines
· ShowAlerts: Enables on-chart alerts
· EmailAlert: Sends alerts via email
· Notification: Push notifications to device or platform
· Message_Timeout: Duration the alert message remains visible
· Message_Subject: Title of alert or notification message
Conclusion
The Auto TrendLines Indicator is an intelligent solution for automatically identifying and plotting trendlines based on pivot-point analysis. By clearly defining support and resistance levels, it simplifies market structure analysis and eliminates manual chart drawing.With built-in breakout and retracement signals, the indicator helps traders spot high-probability buy and sell opportunities while maintaining alignment with the overall market trend.