This is my typical trading strategy, using Tom Demark Trend Line and 25 EMA .
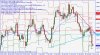
Step 1 Draw your up and down trend lines on the 4 Hr chart. Plot a 25 EMA on same chart. You may learn how to draw trend lines from many free online articles on this subject. But it is best to get a Trend Line drawing software and install into your MT4 Platform.
Step 2 Look out for a break of the trend line or EMA on the 4 HR chart to signal trend direction
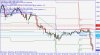
Step 3 Switch over to the 1HR chart and draw up and down trend lines and also plot the 25 EMA. If you are using trend line drawing software ,the trend lines are always drawn automatically by your computer.See attached charts on eurusd.
From the above explanations , you can easily see the entry points to short eurusd on the 1 Hr chart.
Step 4 Look out for entry signal on the 1 Hr chart thus: sell on break of the down trendline /EMA and buy on break of up trendline/EMA. From Experience ,Stop loss level is usually between 30-60 pips on most major pairs using this strategy. Take profit between 40 to 150 pips, or when you notice any reversal signs. Do not hold on to open positionS for more than 2 hours.
This system is very easy to trade if you use a Trend line drawing software. All you need do is to check out your 4 HR and 1 HR charts and see which of the pairs have met the above conditions to place your trade.
This strategy has above 80% success rate.The only challenge is your ability to overcome the temptation of deviating from the rules.
You may contact me by email or chat on yahoo messenger for further assistance. My yahoo ID: emmajabah2@yahoo.com
Step 1 Draw your up and down trend lines on the 4 Hr chart. Plot a 25 EMA on same chart. You may learn how to draw trend lines from many free online articles on this subject. But it is best to get a Trend Line drawing software and install into your MT4 Platform.
Step 2 Look out for a break of the trend line or EMA on the 4 HR chart to signal trend direction
Step 3 Switch over to the 1HR chart and draw up and down trend lines and also plot the 25 EMA. If you are using trend line drawing software ,the trend lines are always drawn automatically by your computer.See attached charts on eurusd.
From the above explanations , you can easily see the entry points to short eurusd on the 1 Hr chart.
Step 4 Look out for entry signal on the 1 Hr chart thus: sell on break of the down trendline /EMA and buy on break of up trendline/EMA. From Experience ,Stop loss level is usually between 30-60 pips on most major pairs using this strategy. Take profit between 40 to 150 pips, or when you notice any reversal signs. Do not hold on to open positionS for more than 2 hours.
This system is very easy to trade if you use a Trend line drawing software. All you need do is to check out your 4 HR and 1 HR charts and see which of the pairs have met the above conditions to place your trade.
This strategy has above 80% success rate.The only challenge is your ability to overcome the temptation of deviating from the rules.
You may contact me by email or chat on yahoo messenger for further assistance. My yahoo ID: emmajabah2@yahoo.com