12 September 2023
Tuesday
The UK is set to release its Claimant Count Change on Tuesday, September the 12th, which is expected to exert a significant influence on the currency markets.
GBP – Claimant Count Change
While the unemployment rate is typically considered a lagging indicator, traders are closely monitoring this report due to its pivotal role in gauging the overall economic health. This significance arises from the robust correlation between consumer spending and the state of the labor market. Furthermore, unemployment levels exert a substantial influence on the decisions regarding the nation's monetary policy.
In the month of July 2023, the number of individuals seeking unemployment benefits in the United Kingdom experienced a notable increase, rising by 29,000. This followed a previously reported decrease of 16,200 in the month of June.
The forthcoming Claimant Count Change is scheduled for release on Tuesday, September 12, 2023, at 07:00 AM GMT+1.
Forecast for the UK Claimant Count Change is reading a decreased unemployment claims of 17,000.
13 September 2023
Wednesday
On Wednesday the 13th, significant economic news is anticipated, with the UK releasing its GDP month-over-month data, while the United States is set to publish its Core Consumer Price Index month-over-month, Consumer Price Index month-over-month, and Consumer Price Index year-over-year figures.
GBP – GDP m/m
Traders are keenly interested in this data as it represents the most comprehensive assessment of economic activity and serves as the principal indicator of the economy's overall health.
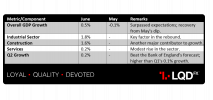
UK GDP data revealed a 0.5% growth in June, surpassing expectations following a 0.1% dip in May. Leading the rebound were 1.8% gains in the industrial sector and 1.6% in construction, while services experienced a modest 0.2% rise. The recovery was attributed to the impact of a coronation holiday in May and a reduction in strike days. Modest underlying output growth was evident. The question at that time was whether this trend would continue in H2 2023. Q2 growth at 0.2% slightly beat the Bank of England's forecast, up from Q1's 0.1%.
The next GDP month-over-month release is scheduled for Wednesday, September 13, 2023, at 07:00 AM GMT+1.
Forecast for the UK’s GDP m/m is reading a decrease of 0.3%.
TL;DR
USD – Core CPI m/m, CPI m/m & CPI y/y
Traders are attentive to this matter as consumer prices play a pivotal role in determining overall inflation. The significance lies in the connection between inflation and currency valuation, as a price surge prompts the central bank to consider raising interest rates in adherence to their mandate of containing inflation.
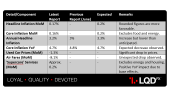
The latest US consumer price inflation report revealed a 0.2% month-on-month increase in both headline and core (excluding food and energy) levels, in line with expectations. Rounding to two decimal places, the figures were even more favorable at 0.17% and 0.16%, respectively, resulting in an annual headline inflation rate of 3.2%, slightly below the expected 3.3% (compared to 3% in June). Core inflation eased from 4.8% to 4.7% as projected. Notable factors included a substantial drop in used car prices (-1.3% MoM) and an unexpected consecutive decline in airfares (-8.1%). While various sectors like medical care, recreation, education, and other goods and services showed subdued changes, the Federal Reserve is likely to view these figures positively. A 'supercore' services category, excluding energy and housing, appeared to rise by around 0.2% MoM, with some impact on the year-on-year rate due to base effects.
The next scheduled releases for Core CPI month-over-month (m/m), CPI month-over-month (m/m), and CPI year-over-year (y/y) are set for September 13, 2023, at 1:30 PM GMT+1.
The forecast for the US Core CPI m/m is reading the same as the previous announcement at 0.2%.
The forecast for the US CPI m/m is reading an increase of 0.2%.
The forecast for the US CPI y/y is reading an increased 3.4%.
TL;DR
14 September 2023
Thursday
On Thursday the 14th, Ten high-impact announcements are scheduled that will significantly affect currency markets.
- AUD – Employment Change
- AUD – Unemployment Rate
- EUR – Main Refinancing Rate
- EUR – Monetary Policy Statement
- USD - Core PPI m/m
- USD - Core Retail Sales m/m
- USD - PPI m/m
- USD - Retail Sales m/m
- USD – Unemployment Claims
- EUR – ECB Press Conference
AUD - Employment Change
Traders show interest because job creation serves as a critical leading indicator for consumer spending, which constitutes a substantial portion of the overall economic activity.
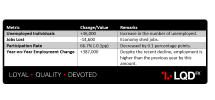
As per data from the Australian Bureau of Statistics (ABS), the number of unemployed individuals increased by 36,000, while the economy shed 14,600 jobs. The participation rate, which represents the percentage of people aged 15 or older either in work or looking for it, decreased by 0.1 percentage points to 66.7 percent. ABS's former head of labor statistics, Bjorn Jarvis, mentioned that despite the decline in the number of people with jobs, employment was still around 387,000 people higher than a year ago.
The forthcoming release of employment change data is set for September 14, 2023, at 02:30 AM GMT+1.
Forecast for Australian Employment Change is reading an increase of employment by 24,300.
TL;DR
AUD – Unemployment Rate
Traders express interest in the unemployment rate despite it being typically considered a lagging indicator. This is because it serves as a significant signal of the broader economic health due to its strong correlation with labor-market conditions, particularly its impact on consumer spending.
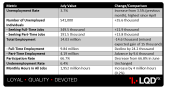
In July, Australia's seasonally adjusted unemployment rate increased to 3.7% from the previous month's 3.5%, exceeding market expectations of 3.6% and marking the highest level since April. The number of unemployed individuals rose by 35.6 thousand to 541 thousand, with people seeking full-time jobs climbing by 21.9 thousand to 349.5 thousand, and those looking for part-time jobs increasing by 13.8 thousand to 191.5 thousand. However, employment unexpectedly decreased by 14.6 thousand to 14.03 million, missing market forecasts of a 15 thousand gain, reversing the 31.6 thousand jump seen in June. Full-time employment declined by 24.2 thousand to 9.84 million, while part-time employment advanced by 9.6 thousand to 4.19 million. The participation rate edged down to 66.7% from 66.8% in June, falling below the market consensus of 66.8%. Meanwhile, the underemployment rate remained unchanged at 6.4%. Additionally, monthly hours in all jobs increased by 4 million, or 0.2 percent, to 1,952 million.
At 2:30 AM GMT+1 on September 14, 2023, the future unemployment rate will be announced.
Forecast for Australian Unemployment Rate is reading a decrease to 3.6%.
TL;DR
EUR – Main Refinancing Rate
Traders place significant importance on short-term interest rates because they are the primary driver of currency valuation. Most other economic indicators are closely analyzed by traders primarily to gain insights into potential future changes in these interest rates.
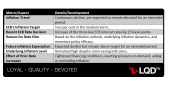
Inflation had been on a continuous decline but was still expected to persist at elevated levels for an extended period. The ECB was resolute in its commitment to ensuring that inflation returned to its two per cent medium-term target in a timely manner. In the prior ECB announcement, the Governing Council had opted to increase the three key ECB interest rates by 25 basis points. This rate hike, at that particular juncture, reflected the ECB's evaluation of the inflation outlook, the dynamics of underlying inflation, and the effectiveness of monetary policy transmission. Subsequent developments following the previous meeting had reaffirmed the ECB's anticipation of a further decrease in inflation throughout the remainder of the year, yet it was expected to remain above target for an extended duration. Despite some indicators showing signs of easing, the overall level of underlying inflation had remained high. The ECB's prior rate increases had continued to have a substantial impact: financing conditions had once again tightened, exerting increasing pressure on demand, which played a pivotal role in steering inflation back towards the target.
The forthcoming release of the Main Refinancing Rate is scheduled for September 14, 2023, at 1:15 PM GMT+1.
Forecast for the ECB Interest Rate is reading a steady 4.25%, the same as the last announcement.
TL;DR
EUR – Monetary Policy Statement
Traders attach significance to the ECB's monetary policy statement because it serves as the ECB's primary means of communicating with investors regarding its monetary policy stance. This statement encompasses the outcome of their interest rate decision and provides commentary on the economic factors that guided their choice. Most notably, it delves into the economic outlook and provides hints regarding potential future policy decisions.
The European Monetary Policy Statement (EMP) expected on September 14, 2023, is likely to cover several key topics, including the ECB's potential decision to raise interest rates by 25 basis points, its commitment to bringing inflation back to its 2% target, the anticipated downgrade of the ECB's economic outlook due to the Ukraine conflict and global growth slowdown, the ECB's plans to reduce its balance sheet as a means of withdrawing stimulus, its assessment of risks posed by various factors including the war in Ukraine and rising energy costs, and its communication strategy for conveying monetary policy decisions to the public.
The upcoming announcement of the Monetary Policy Statement is set for September 14, 2023, at 1:15 PM GMT+1.
USD - Core PPI m/m
Traders closely monitor Core PPI m/m because it serves as a gauge of producer-level inflation. This economic indicator, released monthly by the Bureau of Labor Statistics (BLS), tracks the price fluctuations of goods and services sold by producers, excluding food and energy components.
In July 2023, core producer prices in the United States increased by 0.3% from the previous month, exceeding the expected 0.2% gain. This represented the largest increase since November 2022, which raised concerns about the robust economy potentially reversing its deflationary trend. On an annual basis, core consumer prices remained stable at 2.4%, slightly higher than the anticipated 2.3% increase.
The forthcoming announcement for Core PPI m/m is scheduled for September 14, 2023, at 1:30 PM GMT+1.
Forecast for the US PPI m/m is reading a slight decrease of 0.2%.
Core Retail Sales m/m
Core Retail Sales m/m is of significant interest to traders due to its role as an indicator of consumer spending, a pivotal driver of economic growth. Published monthly by the US Census Bureau, this metric tracks fluctuations in sales at retail establishments, excluding food and gasoline sales.
Excluding auto sales, retail sales in the United States increased by 1% month-over-month in July 2023, exceeding the anticipated 0.4% rise, and continuing the trend from the 0.2% increase recorded in June.
The forthcoming announcement for Core Retail Sales is scheduled for September 14, 2023, at 1:30 PM GMT+1.
Forecast for the US Retail Sales is reading a decrease of 0.5%.
USD - PPI m/m
Traders are interested in core PPI m/m because it is a leading indicator of consumer inflation. As producers pass on higher costs to consumers, this can have a significant impact on long-term inflation trends.
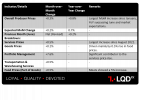
In July 2023, producer prices in the US exhibited a noteworthy increase of 0.3% month-over-month, marking the most substantial rise since January and surpassing market expectations of 0.2%. This positive trend followed a revised flat reading in June. Particularly striking was the surge in services prices, which saw a 0.5% uptick, the most significant since August 2022, rebounding from a 0.1% decline in June. Notable contributors to this rise included portfolio management (7.6%) and transportation and warehousing services (0.5%). Furthermore, price increases were observed across various sectors, including machinery and vehicle wholesaling, outpatient care (partial), chemicals and allied products wholesaling, securities brokerage, dealing, investment advice, and related services, as well as transportation of passengers (partial). Conversely, goods prices saw a more modest increase of 0.1%, mainly driven by a 0.5% rise in food prices, particularly meats (5%). Additionally, various indexes, including gas fuels, hay, hayseeds, and oilseeds, utility natural gas, and motor vehicles, showed upward movement. In a year-on-year comparison, the Producer Price Index (PPI) exhibited a 0.8% increase, surpassing the 0.2% reported in June and market expectations of 0.7%, primarily attributed to base effects. It's noteworthy that in July 2022, prices began to slow down.
The forthcoming announcement for PPI m/m is scheduled for September 14, 2023, at 1:30 PM GMT+1.
Forecast for the US PPI m/m is reading an increase of 0.4%.
TL;DR
USD - Retail Sales m/m
Traders find Retail Sales m/m significant as it serves as the primary indicator of consumer spending, which constitutes the largest share of overall economic activity.
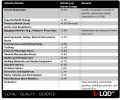
In July 2023, retail sales in the United States experienced a robust increase of 0.7% month-over-month, surpassing market expectations of a 0.4% rise. This marked the fourth consecutive month of growth, indicating the resilience of consumer spending despite elevated prices and borrowing costs. June's figures were also revised upwards to show a 0.3% gain. The surge in sales during July was likely bolstered by Amazon's Prime Day event. Notable increases in sales were observed in various sectors, with nonstore retailers leading the way with a substantial 1.9% growth. Other sectors that experienced notable gains included sporting goods, hobby, musical instruments, and books (1.5%); food services and drinking places (1.4%); clothing (1%); food and beverage stores (0.8%); general merchandise stores (0.8%); health and personal care (0.7%); and building materials and garden equipment (0.7%). Even gasoline stations saw a modest uptick of 0.4% in sales. Conversely, certain sectors experienced declines in sales, including furniture stores (-1.8%); electronics and appliances (-1.3%); motor vehicles and parts dealers (-0.3%); and miscellaneous store retailers (-0.3%). Excluding automobile sales, gasoline, building materials, and food services, retail sales showed a particularly strong surge of 1% during the period.
The upcoming announcement for Retail Sales month-over-month (m/m) is scheduled for September 14, 2023, at 1:30 PM GMT+1.
Forecast for the US Retail Sales is reading a decrease of 0.4%.
TL;DR
USD - Unemployment Claims
Traders closely monitor unemployment claims as they serve as a leading indicator for the economy's health. A surge in claims signals an economic slowdown, indicating reduced demand for goods and services due to job losses, potentially leading to a recession. Conversely, a decline in claims points to economic growth with increased demand. Unemployment claims exhibit volatility week-to-week, making short-term predictions challenging, but tracking them over time helps traders discern the broader economic trend.
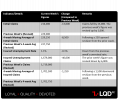
In the week ending September 2, the seasonally adjusted initial claims fell by 13,000 to 216,000, with the previous week's figure revised up by 1,000 to 229,000. The 4-week moving average also decreased by 8,500 to 229,250, following a 250 upward revision from the prior week to 237,750. The insured unemployment rate for the week ending August 26 was 1.1%, down 0.1% from the unrevised rate in the previous week. Seasonally adjusted insured unemployment claims decreased by 40,000 to 1,679,000, with the prior week's figure revised down by 6,000 to 1,719,000. The 4-week moving average decreased by 1,250 to 1,701,500, following a 1,500 downward revision from the previous week to 1,702,750.
The next round of the US unemployment claims is scheduled for September 14, 2023, at 1:30 PM GMT+1.
Forecast for the US Unemployment Claims is reading an increase to 221,000.
TL;DR
EUR – ECB Press Conference
Traders are keenly interested in it because it serves as the ECB's primary channel for communicating monetary policy details to investors, encompassing recent interest rate decisions, economic outlook, inflation factors, and, critically, offering insights into future policy direction.
The ECB Press Conference is scheduled for September 14, 2023, at 1:45 PM GMT+1.
15 September 2023
Friday
On Friday the 15th, three high-impact news events are scheduled:
- CNY – Industrial Production y/y
- USD - Empire State Manufacturing Index
- USD - Prelim UoM Consumer Sentiment
CNY – Industrial Production y/y
The year-over-year Industrial Production figure holds significant importance as it serves as a leading indicator of economic well-being, given that production plays a pivotal role in driving the economy and swiftly responds to fluctuations within the business cycle.
In July 2023, China's industrial production grew by 3.7% year-on-year, lower than the 4.4% increase seen in June and below the 4.4% forecast. The slowdown was attributed to softer growth in manufacturing activity (3.9%) and mining output (1.3%). Among specific industries, various sectors experienced a moderation in output growth, including non-ferrous metals' smelting and pressing (8.9%), chemicals (9.8%), electrical machinery and apparatus (10.6%), metals (1.4%), computers and communication equipment (0.7%), and mining and washing of coal (0.4%). Conversely, production accelerated for the extraction of petroleum and natural gas (4.2%), ferrous metals' smelting and pressing (15.6%), rubber and plastics articles (3.6%), and food processing (3.0%). Cumulatively, industrial output for the first seven months of the year achieved a growth rate of 3.8%.
The forthcoming year-on-year Industrial Production data is scheduled for release on September 15, 2023, at 03:00 AM GMT+1.
Forecast for Chinese Industrial Production y/y is reading a slight decrease of 3.5%.
TL;DR

USD - Empire State Manufacturing Index
Traders are attentive to this data because it serves as a leading indicator of economic well-being. Businesses are highly responsive to market dynamics, and shifts in their sentiment can provide an early indication of forthcoming economic activities such as spending, hiring, and investment.
In August 2023, business activity in New York State declined according to the Empire State Manufacturing Survey. The business conditions index dropped to -19.0, with decreased orders and shipments. However, employment held steady and prices increased. Firms also felt more positive about the six-month outlook.
In summary, business activity in New York State declined in August 2023, but there were some positive signs, such as rising prices and increased optimism about the future.
The upcoming release of the Empire State Manufacturing Index is scheduled for September 15, 2023, at 1:30 PM GMT+1.
Forecast for the US Empire State Manufacturing Index is reading -8 points.
USD - Prelim UoM Consumer Sentiment
Traders pay close attention to financial confidence because it is a strong predictor of consumer spending, which accounts for a sizable share of overall economic activity.
The University of Michigan survey from August indicated a slight decline in American consumer confidence, which exceeded expectations. The Michigan Consumer Sentiment Index had dropped from July's 71.6 to 71.2, surpassing the anticipated 71. This value had remained significantly elevated by 22% compared to the previous year. According to Joanne Hsu, who was the Director of Surveys of Consumers at the time, consumers had noted few tangible shifts from the previous month but had observed substantial improvements compared to three months earlier.
The Preliminary UoM Consumer Sentiment report is set to be released on September 15, 2023, at 3:00 PM GMT+1.
Forecast for Preliminary UoM Consumer Sentiment report is reading an increased 70 points.
Disclaimer: The market news provided herein is for informational purposes only and should not be considered as trading advice.

