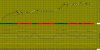
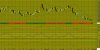
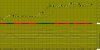
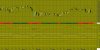
USD/JPY DAILY as of Thursday, 12 November, 2015
*** Intra-Daily Trading Strategy:SELL US Dollar / Japanese Yen
Sell Target: 122.6240
Enter New SELL on OPEN and exit SELL positions at Target price or at Stop price.
(NOTE: Adjust Stop Loss Price according to your trading risk.)
Do not reverse after exiting. This is a recommendation for INTRA-DAY TRADING only!!!!!
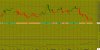
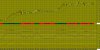
A black body has formed as prices closed lower than open.
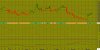
The previous 10 candlestick bars, there are 7 white candles versus 3 black candles with a net of 4 white candles.
The previous 50 candlestick bars, there are 28 white candles versus 22 black candles with a net of 6 white candles.
A engulfing bearish line has formed where a black candle's real body completely contains the previous white candle's real body. The engulfing bearish pattern is bearish during an uptrend (which is the case with US Dollar / Japanese Yen). It signifies that the momentum may be shifting from the bulls to the bears.
If the engulfing bearish pattern occurs during a downtrend, it may be a last engulfing bottom which indicates a bullish reversal. The test to see if this is the case is if the next candle closes above the bottom the current (black) candle's real body.MACD is BULLISH as the MACD is above the signal line.
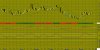
The MACD crossed above the signal line 16 day(s) ago. Since the MACD crossed the MACD moving average, US Dollar / Japanese Yen's price has increased 2.47%, and has been fluctuating from a high of 123.601 to a low of 119.408.
The MACD is currently not in an Overbought/Oversold range.
There have been no divergence signals during the last 5 periods.
The Stochastic Oscillator is currently above 80. This is an indication of the security being in an "overbought" condition.No Stochastic Buy or Sell signals generated today. The last signal was a Buy89 Day(s) Ago.
The RSI is not currently in a topping (above 70) or bottoming (below 30) range.The RSI just crossed below 70 from a topping formation. This is a BEARISH sign. A buy or sell signal generated when the RSI moves out of an overbought/oversold area. The last signal was a Sell 0 day(s) ago.
Currently the RSI does not show any Failure Swings. The RSI and price of US Dollar / Japanese Yen are not diverging.
Currently, the Momentum Oscillator does not show an overbought or oversold condition.
The last Directional Movement Indicators (DMI) signal was a BUY 6 day(s) ago.
There were no SAR signals generated today. The last SAR signal was a Buy14 day(s) Ago.
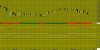
The close is currently
ABOVE its 200 daily moving average
ABOVE its 50 daily moving average
ABOVE its 20 daily moving average
The current market condition for US Dollar / Japanese Yen is Very Bullish
US Dollar / Japanese Yen closed below the upper Bollinger Band by 13.9%. Bollinger Bands are 43.23% wider than normal.
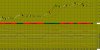
*** Intra-Daily Trading Strategy:SELL US Dollar / Japanese Yen
Sell Target: 122.6240
Enter New SELL on OPEN and exit SELL positions at Target price or at Stop price.
(NOTE: Adjust Stop Loss Price according to your trading risk.)
Do not reverse after exiting. This is a recommendation for INTRA-DAY TRADING only!!!!!
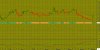
A black body has formed as prices closed lower than open.
The previous 10 candlestick bars, there are 7 white candles versus 3 black candles with a net of 4 white candles.
The previous 50 candlestick bars, there are 28 white candles versus 22 black candles with a net of 6 white candles.
A engulfing bearish line has formed where a black candle's real body completely contains the previous white candle's real body. The engulfing bearish pattern is bearish during an uptrend (which is the case with US Dollar / Japanese Yen). It signifies that the momentum may be shifting from the bulls to the bears.
If the engulfing bearish pattern occurs during a downtrend, it may be a last engulfing bottom which indicates a bullish reversal. The test to see if this is the case is if the next candle closes above the bottom the current (black) candle's real body.MACD is BULLISH as the MACD is above the signal line.
The MACD crossed above the signal line 16 day(s) ago. Since the MACD crossed the MACD moving average, US Dollar / Japanese Yen's price has increased 2.47%, and has been fluctuating from a high of 123.601 to a low of 119.408.
The MACD is currently not in an Overbought/Oversold range.
There have been no divergence signals during the last 5 periods.
The Stochastic Oscillator is currently above 80. This is an indication of the security being in an "overbought" condition.No Stochastic Buy or Sell signals generated today. The last signal was a Buy89 Day(s) Ago.
The RSI is not currently in a topping (above 70) or bottoming (below 30) range.The RSI just crossed below 70 from a topping formation. This is a BEARISH sign. A buy or sell signal generated when the RSI moves out of an overbought/oversold area. The last signal was a Sell 0 day(s) ago.
Currently the RSI does not show any Failure Swings. The RSI and price of US Dollar / Japanese Yen are not diverging.
Currently, the Momentum Oscillator does not show an overbought or oversold condition.
The last Directional Movement Indicators (DMI) signal was a BUY 6 day(s) ago.
There were no SAR signals generated today. The last SAR signal was a Buy14 day(s) Ago.
The close is currently
ABOVE its 200 daily moving average
ABOVE its 50 daily moving average
ABOVE its 20 daily moving average
The current market condition for US Dollar / Japanese Yen is Very Bullish
US Dollar / Japanese Yen closed below the upper Bollinger Band by 13.9%. Bollinger Bands are 43.23% wider than normal.