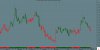
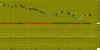
Euro Dollar / US Dollar-EURUSD As of 15/02/16
*** Intra-Daily Trading Strategy:SELL Euro Dollar / US Dollar
Sell Target: 1.1176
Enter New SELL on OPEN and exit SELL positions at Target price or at Stop price.
(NOTE: Adjust Stop Loss Price according to your trading risk.)
Do not reverse after exiting. This is a recommendation for INTRA-DAY TRADING only!!!!!
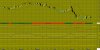
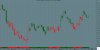
A white body has formed as prices closed higher than open.
The previous 10 candlestick bars, there are 7 white candles versus 3 black candles with a net of 4 white candles.
The previous 50 candlestick bars, there are 28 white candles versus 22 black candles with a net of 6 white candles.
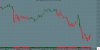
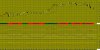
A doji star has formed where a doji gaps above or below the previous candle. This often signals a reversal with confirmation occurring on the next bar.A falling window has formed where the bottom of the previous shadow is above the top of the current shadow. This usually implies a continuation of a bearish trend.MACD is BULLISH as the MACD is above the signal line.
The MACD crossed above the signal line 12 day(s) ago. Since the MACD crossed the MACD moving average, Euro Dollar / US Dollar's price has increased 2.18%, and has been fluctuating from a high of 1.138 to a low of 1.081.
The MACD is currently not in an Overbought/Oversold range.
There have been no divergence signals during the last 5 periods.
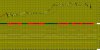
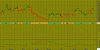
No Stochastic Buy or Sell signals generated today. The last signal was a Sell 43 Day(s) Ago.
The RSI is not currently in a topping (above 70) or bottoming (below 30) range. A buy or sell signal generated when the RSI moves out of an overbought/oversold area. The last signal was a Sell 1 day(s) ago.
Currently the RSI does not show any Failure Swings. The RSI and price of Euro Dollar / US Dollar are not diverging.
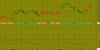
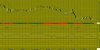
Currently, the Momentum Oscillator does not show an overbought or oversold condition.
The Directional Movement Indicators (DMI) currently is not indicating a specific price direction. Because this is a trend following system, it should not use to initiate any trades right now. The last Directional Movement Indicators (DMI) signal was a SELL31 day(s) ago.
There were no SAR signals generated today. The last SAR signal was a Buy22 day(s) Ago.
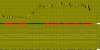
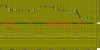
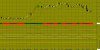
The close is currently
ABOVE its 200 daily moving average
ABOVE its 50 daily moving average
ABOVE its 20 daily moving average
The current market condition for Euro Dollar / US Dollar is Very Bullish
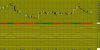
Euro Dollar / US Dollar closed below the upper Bollinger Band by 29.1%. Bollinger Bands are 49.22% wider than normal.
*** Intra-Daily Trading Strategy:SELL Euro Dollar / US Dollar
Sell Target: 1.1176
Enter New SELL on OPEN and exit SELL positions at Target price or at Stop price.
(NOTE: Adjust Stop Loss Price according to your trading risk.)
Do not reverse after exiting. This is a recommendation for INTRA-DAY TRADING only!!!!!
A white body has formed as prices closed higher than open.
The previous 10 candlestick bars, there are 7 white candles versus 3 black candles with a net of 4 white candles.
The previous 50 candlestick bars, there are 28 white candles versus 22 black candles with a net of 6 white candles.
A doji star has formed where a doji gaps above or below the previous candle. This often signals a reversal with confirmation occurring on the next bar.A falling window has formed where the bottom of the previous shadow is above the top of the current shadow. This usually implies a continuation of a bearish trend.MACD is BULLISH as the MACD is above the signal line.
The MACD crossed above the signal line 12 day(s) ago. Since the MACD crossed the MACD moving average, Euro Dollar / US Dollar's price has increased 2.18%, and has been fluctuating from a high of 1.138 to a low of 1.081.
The MACD is currently not in an Overbought/Oversold range.
There have been no divergence signals during the last 5 periods.
No Stochastic Buy or Sell signals generated today. The last signal was a Sell 43 Day(s) Ago.
The RSI is not currently in a topping (above 70) or bottoming (below 30) range. A buy or sell signal generated when the RSI moves out of an overbought/oversold area. The last signal was a Sell 1 day(s) ago.
Currently the RSI does not show any Failure Swings. The RSI and price of Euro Dollar / US Dollar are not diverging.
Currently, the Momentum Oscillator does not show an overbought or oversold condition.
The Directional Movement Indicators (DMI) currently is not indicating a specific price direction. Because this is a trend following system, it should not use to initiate any trades right now. The last Directional Movement Indicators (DMI) signal was a SELL31 day(s) ago.
There were no SAR signals generated today. The last SAR signal was a Buy22 day(s) Ago.
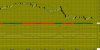
The close is currently
ABOVE its 200 daily moving average
ABOVE its 50 daily moving average
ABOVE its 20 daily moving average
The current market condition for Euro Dollar / US Dollar is Very Bullish
Euro Dollar / US Dollar closed below the upper Bollinger Band by 29.1%. Bollinger Bands are 49.22% wider than normal.