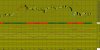
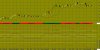
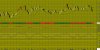
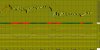
US Dollar / Japanese Yen-USDJPY
As of 23/09/15
*** Intra-Daily Trading Strategy: SELL US Dollar / Japanese Yen
Sell Target: 119.7190
Sell Stop: 121.0460
Enter New SELL on OPEN and exit SELL positions at Target price or at Stop price.
(NOTE: Adjust Stop Loss Price according to your trading risk.)
Do not reverse after exiting. This is a recommendation for INTRA-DAY TRADING only!!!!!
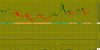
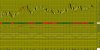
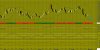
A white body has formed as prices closed higher than open.
The previous 10 candlestick bars, there are 5 white candles versus 5 black candles.
The previous 50 candlestick bars, there are 24 white candles versus 26 black candles with a net of 2 black candles.
A spinning top has formed which is a candle with a small real body. Spinning tops identify a session in which there is little price action as defined by the difference between the open and the close. During a rally or near new highs, a spinning top can be a sign that prices are losing momentum and the bulls may be in trouble.MACD is BULLISH as the MACD is above the signal line.
The MACD crossed above the signal line 9 period(s) ago. Since the MACD crossed the MACD moving average, US Dollar / Japanese Yen's price has decreased 0.29%, and has been fluctuating from a high of 121.314 to a low of 119.055.
The MACD is currently not in an Overbought/Oversold range.
There have been no divergence signals during the last 5 periods.
No Stochastic Buy or Sell signals generated today. The last signal was a Buy 54 Period(s) Ago.
The RSI is not currently in a topping (above 70) or bottoming (below 30) range. A buy or sell signal generated when the RSI moves out of an overbought/oversold area. The last signal was a Buy 20 period(s) ago.
Currently the RSI does not show any Failure Swings. The RSI and price of US Dollar / Japanese Yen are not diverging.
Currently, the Momentum Oscillator does not show an overbought or oversold condition.
The last Directional Movement Indicators (DMI) signal was a SELL 57 period(s) ago.
There were no SAR signals generated today. The last SAR signal was a Buy 10 period(s) Ago.
The close is currently
ABOVE its 200 daily moving average
BELOW its 50 daily moving average
BELOW its 20 daily moving average
The current market condition for US Dollar / Japanese Yen is Mildly Bullish
US Dollar / Japanese Yen closed above the lower Bollinger Band by 45.8%. Bollinger Bands are 38.15% narrower than normal. The current width of the Bollinger Bands (alone) does not suggest anything conclusive about the future volatility or movement of prices.
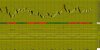
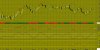
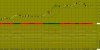
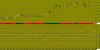
As of 23/09/15
*** Intra-Daily Trading Strategy: SELL US Dollar / Japanese Yen
Sell Target: 119.7190
Sell Stop: 121.0460
Enter New SELL on OPEN and exit SELL positions at Target price or at Stop price.
(NOTE: Adjust Stop Loss Price according to your trading risk.)
Do not reverse after exiting. This is a recommendation for INTRA-DAY TRADING only!!!!!
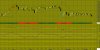
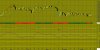
A white body has formed as prices closed higher than open.
The previous 10 candlestick bars, there are 5 white candles versus 5 black candles.
The previous 50 candlestick bars, there are 24 white candles versus 26 black candles with a net of 2 black candles.
A spinning top has formed which is a candle with a small real body. Spinning tops identify a session in which there is little price action as defined by the difference between the open and the close. During a rally or near new highs, a spinning top can be a sign that prices are losing momentum and the bulls may be in trouble.MACD is BULLISH as the MACD is above the signal line.
The MACD crossed above the signal line 9 period(s) ago. Since the MACD crossed the MACD moving average, US Dollar / Japanese Yen's price has decreased 0.29%, and has been fluctuating from a high of 121.314 to a low of 119.055.
The MACD is currently not in an Overbought/Oversold range.
There have been no divergence signals during the last 5 periods.
No Stochastic Buy or Sell signals generated today. The last signal was a Buy 54 Period(s) Ago.
The RSI is not currently in a topping (above 70) or bottoming (below 30) range. A buy or sell signal generated when the RSI moves out of an overbought/oversold area. The last signal was a Buy 20 period(s) ago.
Currently the RSI does not show any Failure Swings. The RSI and price of US Dollar / Japanese Yen are not diverging.
Currently, the Momentum Oscillator does not show an overbought or oversold condition.
The last Directional Movement Indicators (DMI) signal was a SELL 57 period(s) ago.
There were no SAR signals generated today. The last SAR signal was a Buy 10 period(s) Ago.
The close is currently
ABOVE its 200 daily moving average
BELOW its 50 daily moving average
BELOW its 20 daily moving average
The current market condition for US Dollar / Japanese Yen is Mildly Bullish
US Dollar / Japanese Yen closed above the lower Bollinger Band by 45.8%. Bollinger Bands are 38.15% narrower than normal. The current width of the Bollinger Bands (alone) does not suggest anything conclusive about the future volatility or movement of prices.