
You spot a strong bullish price action signal and prepare to buy. A momentum candle forms, price bounces convincingly off a key level, and the setup appears to favor further upside. Instead, the market reverses and price begins to fall. Why did the trade idea fail when the signal looked so convincing? The answer may lie not in the candle itself, but in the broader market context. A prevailing downtrend, a sequence of lower highs, or strong resistance overhead can undermine even a promising bullish signal and leave buyers caught on the wrong side of the market.
This raises another question: if the same entry signal can succeed in one situation and fail in another, how do you know when to trust it? The answer lies in analyzing not only individual swings but also the broader patterns that shape market structure. These patterns reveal aspects of the market that individual candles alone cannot show.
This is where market structure comes in. in Forex, price action shows how the market is behaving at a given moment, while market structure places the current move within the broader market context. Price action helps identify potential entry triggers; market structure helps assess their significance in light of the overall market conditions.
In this FX guide, you will learn how to use market structure to filter price action signals, identify potential entries, evaluate the likelihood of trend continuation, and recognize false breakouts. You will also see why even a convincing pattern can fail to deliver the expected result and how its position within the broader market structure influences trading decisions. Although combining these approaches does not guarantee profits, it can help you avoid trades with weaker prospects.
Market context vs. price behavior
Market structure and price action describe different aspects of market behavior. Market structure reveals the broader direction and organization of price movement, while price action focuses on how price responds at specific moments and levels. Understanding this distinction helps traders interpret individual signals within the broader market context.

What defines market structure?
Market structure is defined by a sequence of swing highs and lows that reveal the prevailing price direction and the balance of power between buyers and sellers.
Higher highs and higher lows indicate an uptrend, while lower highs and lower lows signal a downtrend. When highs and lows fluctuate around similar levels, the market forms a range without sustained directional control.
A potential reversal is signaled by a change of character (CHoCH), which occurs when price breaks a significant structural level against the prevailing trend. In a bullish trend, a break below the previous swing low may indicate weakening buyers. However, CHoCH alone does not confirm a reversal. Stronger confirmation comes when price forms a lower high and breaks the previous low, suggesting a shift toward a bearish structure without guaranteeing further decline.
Market structure provides context for interpreting the market and assessing changes in buyer-seller dynamics. It supports price action analysis but does not define precise entry points.
What defines price action?
Price action describes current price behavior. By analyzing candle size, wicks, and closing prices, traders assess the balance of power between buyers and sellers. Impulses, engulfing patterns, pin bars, and bounces off levels help identify participant activity.
However, even a convincing price move does not guarantee trend continuation. For example, a bullish impulse may signal the start of an uptrend, or it may prove to be a brief upward spike within a broader downtrend.
Market structure provides the context needed to interpret such situations. This helps relate local price movements to the broader market direction and assess whether a potential trade is justified.
Why the distinction matters
Imagine that you trade exclusively based on price action. You spot a familiar pattern, see a sharp bounce, and open a trade. However, market structure points to a downtrend, and price is near resistance. The local signal looks convincing, but the broader context makes the entry risky.
The opposite situation is also possible. You see a clear structure and wait for a perfect setup, but it never appears. As a result, you miss a strong move or enter too late.
Separating these approaches helps you assign their roles correctly. Market structure defines the overall context and price location, while price action helps identify entry timing. Together, they allow traders to determine whether a signal aligns with the prevailing market conditions, where price is trading relative to key structural levels, and whether a breakout beyond one of these levels is holding or showing signs of failure. For example, a move above resistance may indicate a genuine breakout if price sustains the break, while a quick return below the level may suggest a false breakout.
This approach helps curb impulsive decisions. Instead of searching for the "best method," you use each tool for its intended purpose. This does not guarantee profit, but it reduced how often you open trades without sufficient justification.
In addition, you can justify every decision: why you entered the market, where you made a mistake, and which factor you failed to account for. Without such analysis, trading risks turning into guesswork. With it, you gradually build a consistent system instead of a set of disconnected signals.
Market structure as a framework for trade selection
Market structure helps traders look beyond individual price action signals and evaluate the broader conditions in which they form. By identifying significant swings, classifying the market environment, and assessing where price is trading, traders can make more informed decisions about which setups to consider.
Identifying meaningful market swings
When doing technical analysis, it is important to remember that not every high or low matters. There can be dozens of swings on the chart, but market structure is defined by key swings that are confirmed by the subsequent price reaction. How do you recognize them? Focus on the strength and character of the move: a significant swing is often accompanied by a confident bounce and an impulse that leads to a break of the previous structural level or the formation of a CHoCH.
If price briefly breaks a level and then returns, do not rush to treat it as a structural change. Look for swings after which a directional move develops and price holds beyond the broken level. Such points help determine the current structure. At the same time, you do not need to mark every bar: the goal of analysis isn't perfect labeling, but creating a workable foundation for decision-making.
Start with higher timeframes, where key swings usually reflect the overall picture better. Then move to lower timeframes and check whether local moves align with the higher-timeframe structure. Pay attention to the levels from which price bounces confidently or which it breaks with an impulse move. They help evaluate price action signals in the context of the market.
Your task is not to mark every swing, but to identify the reference points that genuinely influence the interpretation of the market situation.
Recognizing trends, ranges, and structural transitions
After identifying significant swings, use them to establish the overall market structure. An uptrend forms a sequence of Higher Highs and Higher Lows, with each new high exceeding the previous one and each low forming above its predecessor. A downtrend, by contrast, is marked by Lower Highs and Lower Lows, indicating seller dominance.
In a range, price fluctuates between the upper and lower boundaries without establishing a sustained sequence of new extremes. Neither buyers nor sellers have enough control to drive the market into a clear directional trend.
However, market structure is dynamic. A break of a key swing level in the direction of the prevailing trend can confirm continuation, while a CHoCH signals a potential shift in direction. For example, in an uptrend, a break below the last significant Higher Low may indicate weakening bullish structure. Rather than focusing on the break alone, assess whether price remains below the level and whether bearish momentum follows.
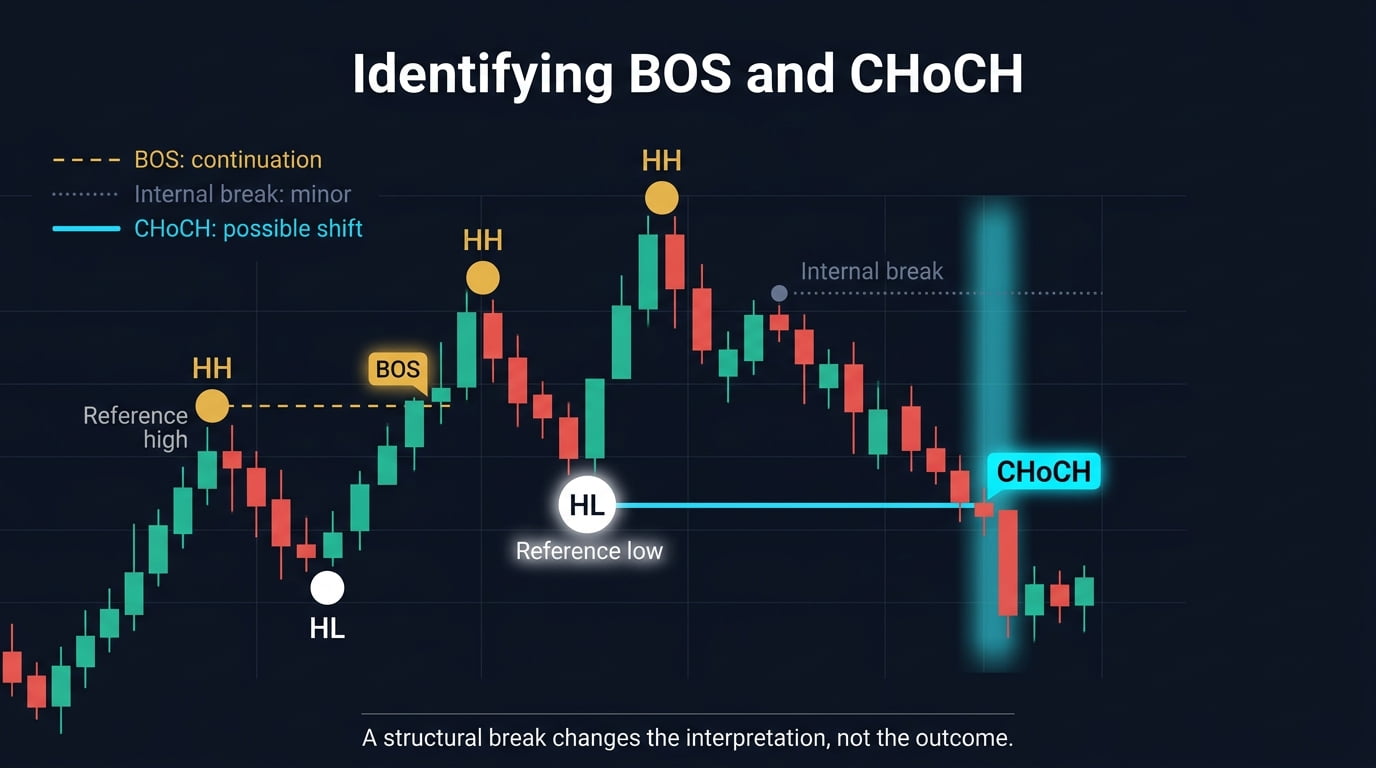
Regularly reassess the market context to determine whether the trend remains intact, the range holds, or a new phase is emerging. If price breaks a swing level but quickly returns, the breakout may be false. Candle closes beyond the level and follow-through help determine whether the market structure has genuinely changed.
When the market context changes, reassess your trading plan. Rather than pursuing buying opportunities based on the previous bullish scenario, consider whether conditions now favor short positions or the market has entered a range. You do not need to predict every reversal; you need to recognize structural changes and adapt your decisions accordingly.
Thus, market structure defines the broader market context, while price action helps identify entry points. This approach does not guarantee profits, but it helps you select trades based on current market conditions rather than react to every price movement.
Understanding location and key structural areas
Where is the price located? This is the question worth asking before even looking for price action signals. Their meaning largely depends on market context. For example, the same pin bar can have different implications at resistance in a downtrend and at support in an uptrend.
Key structural areas include previous swing highs and lows, broken levels, and range boundaries. Prioritize zones where price has reacted strongly, triggered a structural shift, or initiated an impulsive move.
Next, assess the price's position relative to these reference points. At a key level, wait for price action confirmation and evaluate the potential reaction. In the middle of a range, exercise caution, as signals may lack clear structural context. However, no level guarantees a bounce or ensures that support or resistance will hold.
This analysis helps you select trades based not only on the signal itself but also on the market conditions in which it appears. Assess whether price has room to move further and whether its behavior supports the anticipated scenario. When the price location aligns with the price action signal, the trade has a stronger rationale.
Remember that market structure is a guide, not a rigid rule. The goal is not to trade every formation, but to identify situations where price location and behavior provide a sound basis for entry.
How structural context filters price action setups
Market structure acts as a filter for price action setups. A pattern may look promising on its own, but the broader market context helps determine whether it is worth trading. Consider a bullish pin bar. Near support in an uptrend, it may present a promising buying opportunity. The same pattern near resistance in a downtrend offers a weaker basis for a long entry.

Market structure helps answer three key questions:
- Where is price trading?
- Which way is the market moving?
- Is there enough room for further price movement?
When a signal goes against the prevailing trend, stronger confirmation may be necessary. When it aligns with the trend, the setup may warrant greater confidence, provided that swing structure and key levels support the scenario.
Location matters, too. A signal near a broken level in the direction of the prevailing trend may carry more weight than one appearing in the middle of a range, where directional context is less clear. Rather than dismissing price action, use market structure to interpret the signal. Ask whether the broader structure supports the setup or raises doubts about it.
This filtering process helps prioritize setups that fit the prevailing market conditions. If the context contradicts the trading idea, it may be better to pass on the trade. If the signal is supported by the structure and aligns with your trading plan, you can proceed to evaluate the entry and manage the associated risk.
Market structure and price action serve distinct but complementary purposes. Market structure defines the broader context, while price action helps identify potential entry points. This creates a clear analytical sequence: examine the market environment first, then evaluate the signal. Individual candlestick patterns can then be interpreted within a broader trading scenario rather than treated as standalone reasons to enter a trade.
Price action as an execution trigger
Price action helps traders identify potential entries by interpreting how price reacts to key levels. However, a signal becomes actionable only when it aligns with the broader market context and meets predefined entry criteria.
What makes a price action signal actionable?
A trading signal should be considered a basis for entry only when you can clearly answer three questions:
- What exactly are you observing?
- Where is the signal forming?
- What confirms the possibility of entry?
A candlestick pattern alone is not enough to justify a trade. You need a specific trigger, such as a breakout of a key level, a candle close beyond it, or a bounce followed by a confirming price reaction. Next, assess where the signal occurs. A reaction at a key structural area can strengthen the setup, while a signal in the middle of a range may have less compelling justification.
Finally, consider the broader market context. Does market structure support the intended trade direction?
If the structure contradicts the signal, look for stronger confirmation before entering. If the two align, the setup may warrant closer consideration. In either case, define your trading plan in advance, including the entry point, stop-loss level, and profit target. This gives you clear criteria for executing and managing the trade rather than forcing you to make decisions on the fly as price moves.
Turning visual observations into explicit rules
Have you noticed that you interpret trading signals differently each time? A setup may look convincing today but less reliable tomorrow. This inconsistency makes it harder to evaluate performance and make sound decisions. To address it, turn your observations into clear trading rules.
Start by defining the signal. What conditions make it tradable? These might include a candle close beyond a level, a minimum body size, or a specific body-to-wick ratio. Make the criteria objective and verifiable.
Next, establish filters for market context. Should the signal form at a key structural area or in the middle of a range? Mark important reference points, including previous swings and broken levels. Then define your entry, stop-loss, and profit target. Specify whether entry follows a candle close or a breakout, where the stop goes, and where to take profit.
Each rule must be specific and free from subjective judgments like "looks strong enough." Another trader should be able to understand how to identify the signal and act on it. Test the rules against historical data. If criteria leave room for interpretation, refine them and test again.
Clear rules help prevent impulsive decisions. Applying them consistently turns price observations into a structured process for evaluating setups and making trading decisions.
Rejection, displacement, and failed breakouts
When price approaches a key area and sharply reverses, this may indicate rejection. The candle often has a long wick, a small body, and a close well away from the area. This behavior may suggest that buyers or sellers are defending the zone. However, rejection alone is not enough to justify an entry. Context matters: rejection in the direction of the prevailing trend generally carries more weight than a similar signal in the middle of a range.
Displacement looks different. Price moves rapidly away from a level, forming a sequence of directional candles. Candle closes beyond a significant boundary, combined with an acceleration in price movement, may indicate that one side of the market is gaining strength. Before considering an entry, however, assess the market direction and whether there is sufficient room for further movement.
A strong impulse without structural confirmation may prove misleading. One possible example is a failed breakout: price moves beyond a key level but fails to hold beyond it and returns to the previous range. This suggests that the breakout lacks follow-through. It may create an opportunity to trade in the opposite direction, provided that market structure supports the reversal.
Rejection, displacement, and failed breakouts help explain how price reacts to significant areas. However, each price movement must be evaluated in the context of the overall market structure. Your task is not to predict the next move from a single candle, but to assess whether price behavior supports your trading scenario. This shifts the focus from recognizing individual patterns to identifying well-founded entry opportunities.
Separating the setup from the trigger
Many novice traders confuse a trading setup with an entry trigger. A setup describes the market conditions that make a trade worth considering, while a trigger identifies the specific point at which to enter.
Imagine that market structure indicates an uptrend and price pulls back to a support level. This forms a setup: it defines where to look for a trade and provides the market context, but it does not signal an entry on its own. For that, you need to wait for a trigger, such as a bullish engulfing pattern or a breakout followed by a candle close above the level.
Without a setup, an entry signal lacks context; without confirmation, a setup remains a potential trade. Assess the market conditions first, then identify a specific entry condition. This sequence helps prevent impulsive decisions: you enter not just because a candle looks convincing, but because the setup and entry criteria align with your trading plan.
To reinforce this principle, define the setup and entry trigger separately in your trading plan. The setup answers "where and why to look for a trade," while the trigger answers "when to enter." Keeping these roles distinct helps you move systematically from market analysis to trade execution.
Does market structure improve price action decisions?
The limitations of signals without context
You spot a trading signal and feel ready to act. The candlestick pattern looks convincing, the bounce seems clear, and you are tempted to enter the trade. But without market context, you miss the key question: where is price trading — at a key support level or in the middle of a range? Does market structure support the signal or contradict it? Until you answer these questions, you lack sufficient justification for an entry and you risk trading every pin bar and engulfing pattern without considering the market conditions in which they form.
A signal without context can create false confidence. You recognize a familiar pattern but overlook the preceding price action, its position relative to key levels, and the potential for further price development. As a result, you may enter trades too frequently and without a clear plan, making it difficult to explain why some trading ideas work while others fail.
The problem is not necessarily with the signal itself. It reflects local price action but does not show whether that reaction aligns with the broader market context. Market structure provides this context and helps filter out setups that lack sufficient confirmation. Therefore, start by identifying current market conditions, then decide whether the signal deserves your attention.
What structural context can contribute
Market context provides what an individual signal cannot: an understanding of where price is trading and how the current situation fits into the broader market structure. The same pattern can carry different weight depending on where it appears on the chart. For example, a signal near a key level may be more significant than a similar formation in the middle of a range. Context also helps identify the prevailing market direction and highlight important reference points, including previous swing highs and lows, broken consolidation zones, and trading range boundaries.
These levels help you determine whether a signal is supported by the broader market structure. They also help distinguish a false breakout from a move in which price sustains a break beyond a significant level. Rather than reacting to every pattern, you can focus on setups that align with the broader market context. Changes in swing structure may also signal a potential shift in market direction.
Market context also informs risk management. A nearby structural level can provide a reference for stop-loss placement, while an entry in the middle of a range may offer a less favorable risk-to-reward profile. Depending on the setup, it may be better to skip the trade or adjust position size.
The trade-offs of adding structural filters
Using market structure as a filter can improve trading decisions, but it comes at a cost. You will inevitably miss some potentially profitable trades, because any filter excludes not only weak setups but also opportunities that might have worked out.
In addition, analyzing market structure takes time. You need to evaluate not only the setup itself but also the price's position relative to key levels, swing points, and the broader market context. This can slow down decision-making, causing you to miss an entry while you check the situation.
Another problem arises when you use too many filters. Waiting for every condition to align perfectly can lead to analysis paralysis: you keep seeking additional confirmation and end up taking no trades at all. To avoid this, establish clear priorities and focus on the criteria that matter most to your trading system. Market structure should support your decision-making, not become a rigid set of rules that prevents you from acting.
Excessive filtering can also undermine your confidence. When you start questioning every signal, it becomes harder to follow your trading plan consistently. Confidence should come from a well-defined process rather than subjective feelings about individual setups. Applying structural filters requires discipline: you need to follow your established criteria even when a signal looks particularly compelling.
Ultimately, using market structure as a filter means taking fewer trades while prioritizing higher-quality trading opportunities. This does not guarantee better results, but it helps you evaluate opportunities consistently and make more deliberate decisions. Filters must also suit your trading system. If the analysis becomes too complex or takes more time than it is worth, review your criteria and simplify the process. The goal is not perfect analysis, but a practical and consistent trading system.
Comparing different decision frameworks
Traders can approach price action and market structure in three different ways. The first approach relies solely on price action: you analyze candlestick patterns and respond to signals as they appear. This allows for faster entries, but without market context, it is harder to determine whether a setup offers a favorable trading opportunity.
The second approach focuses on market structure. You wait for a clear scenario to develop and observe how price behaves around key levels, including whether it breaks through them or holds within a defined range. This helps filter trading opportunities, but waiting for confirmation can mean missing fast-moving opportunities.
The third approach combines both methods. You first assess market structure to establish the broader context, then look for an entry trigger. This takes more time but helps you determine whether a signal aligns with the prevailing market conditions. The principle is simple: context first, entry second. This sequence can reduce impulsive trades, although it does not guarantee profitability.
The choice depends on your trading strategy and the results of your testing. If speed is a priority, price action can serve as the foundation of your analysis. If market context matters more, use market structure to identify suitable trading scenarios. The combined approach brings both methods together but requires clear rules.
Do not rely solely on theoretical advantages when choosing a trading strategy. Test different methods on historical data and compare trade frequency, risk exposure, and overall performance. Your goal is not to develop an ideal theory but to build a consistent trading system that suits your needs.
Applying market structure to practical price action setups
Combining market structure with price action requires a consistent process that links market context to entry signals and trade execution. The following framework outlines how to identify setups, establish entry criteria, manage risk, and recognize when to stay out of the market.
A three-tier multi-timeframe framework
Use three timeframes. The higher timeframe establishes the market context, helping you identify the prevailing direction, a trading range, or a potential trend reversal. The middle timeframe refines this view by highlighting key areas and significant swings. The lower timeframe is used to time entries, with a specific price action condition serving as the entry trigger.
This sequence takes you from the general picture to the entry decision: context first, then the area of interest, and finally the trigger. Do not enter a trade simply because a particular candle pattern appears on the lower timeframe. Instead, check whether the signal aligns with the higher-timeframe structure and meets your entry criteria. If these conditions are not met, skip the trade.
This approach requires discipline and additional analysis, but it helps filter out poorly justified trades. You gain a clearer picture of where price is trading, which levels matter, and whether there is room for further movement. Rather than relying on guesswork, you follow a structured plan.
Playbook A — Trend continuation
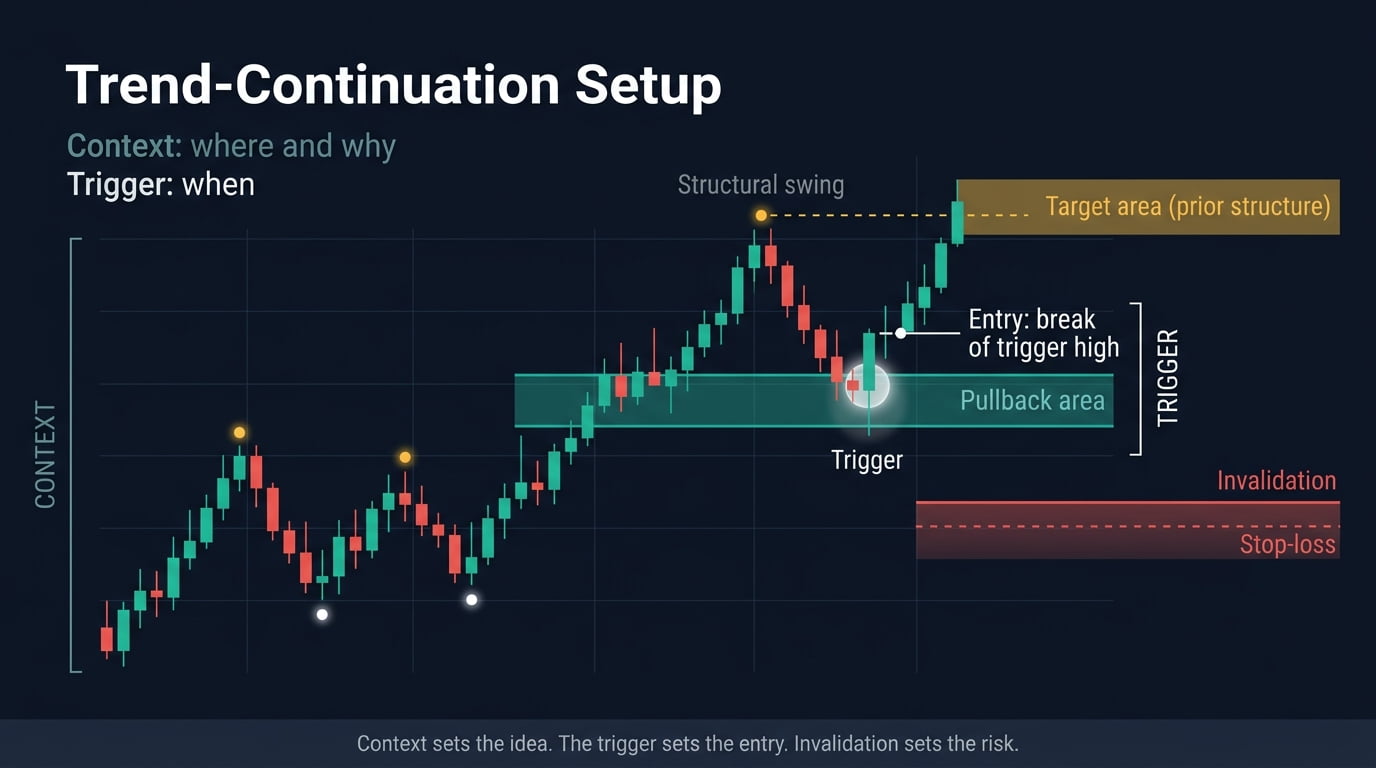
A trend-continuation setup combines directional market structure with a price action trigger. The aim is to identify a pullback that may offer an entry in the prevailing trend, then define entry, invalidation, and exit criteria before placing the trade.
Step 1. Establish the directional context
Start your analysis with the higher timeframe to establish the market direction. In an uptrend, highs and lows form a rising sequence; in a downtrend, they form a falling sequence. If the broader market does not show a clear trend, avoid forcing a trend-following trade. Wait for a more defined directional pattern to emerge.
Step 2. Identify a relevant pullback area
In an uptrend, look for an area where price has previously reacted or broken through resistance. This could be a former resistance level, a previous swing low, or a support zone. In a downtrend, apply the same principle but focus on resistance zones and significant swing highs. Choose an area that aligns with the broader market structure rather than an arbitrary level. Wait for the price to reach it before considering an entry. The sequence is simple: identify the area of interest, then wait for a signal.
Step 3. Wait for a price action trigger
Do not enter a trade simply because price has reached the area of interest. Wait for a trigger that confirms a reaction, such as a bounce, an engulfing pattern, or a breakout confirmed by a candle close beyond the level. The signal should suggest that buyers or sellers are stepping in. Without confirmation, an entry is speculative; clear confirmation helps you follow your trading plan.
Step 4. Define entry and invalidation
Once the market direction and price action signal have been identified, the next step is to define the entry point and stop-loss level. Enter the trade when your preselected trigger occurs, such as the close of the signal candle or a breakout beyond a key level. Avoid delaying entry in pursuit of a better price once the signal has formed.
Place the stop-loss beyond the nearest significant swing or the area from which the signal originated. If price reaches the point where the original scenario is invalidated, exit according to your trading plan. Set both the entry and stop-loss in advance to avoid impulsive decisions. These levels should be grounded in the identified market structure; otherwise, the trade becomes a guess rather than the result of a consistent process.
Step 5. Identify a potential exit area
Determine a potential exit area in advance. When you are trading with the trend, a logical target is the next significant level, such as a previous swing high or low, a resistance zone, or a support zone. Avoid setting take-profit levels arbitrarily. As price approaches the planned area, you can take partial profits or move your stop-loss to breakeven. These adjustments can help manage risk and reduce the likelihood of giving back profits.
Playbook B — Failed breakout and range reversal
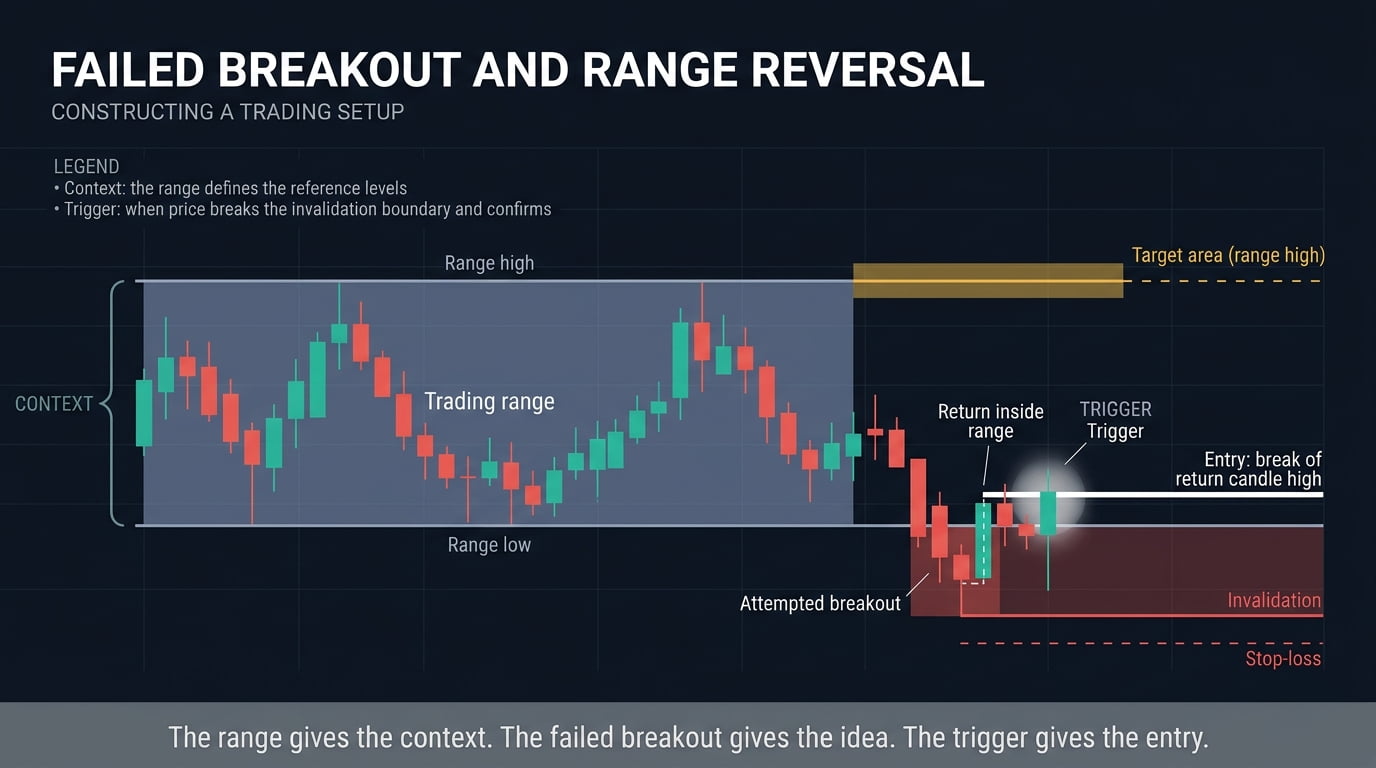
Trading a failed breakout requires more than spotting a move beyond a range boundary. Define the trading range, observe the breakout attempt, look for evidence of failure, set the trade conditions, and determine when the setup is no longer valid.
Step 1. Define the range
Identifying a trading range starts with marking its upper and lower limits. Look for recent significant swing highs and lows that price has repeatedly failed to break. The upper limit represents resistance, while the lower limit represents support. Confirm that price has reacted to both areas multiple times. Clearly defined levels make it easier to plan trades within the range and evaluate potential breakouts. If the range is too vague to define reliably, it is better to skip the trade.
Step 2. Observe the attempted breakout
When price approaches the edge of a trading range, avoid jumping to conclusions. Watch how it tests the level: does the candle close beyond it, or does price form only a long wick? A candle close beyond the range, especially when followed by continued movement in the same direction, provides stronger evidence of a breakout. If price quickly moves back inside the range, this may signal a failed breakout. Wait for confirmation before entering a trade.
Step 3. Look for evidence of failure
A failed breakout may be indicated by a candle closing beyond a level, followed by a quick move back inside the range. Candles with long wicks and small bodies near the range boundary may signal price rejection in that area.
A lack of follow-through in the breakout direction provides further evidence of weakness. When price fails to hold beyond the level and returns inside the range, it may signal a potential reversal. A candle close back inside the range adds confirmation. Wait for clear evidence of the failed breakout before entering a trade.
Step 4. Define the trade conditions
Define the trade conditions in advance. Once price has clearly returned inside the range, enter on the close of the signal candle or on a break of an internal level. Place the stop-loss beyond the extreme of the failed breakout and set the take-profit near the opposite side of the range.
Specify all three parameters before entering the trade to avoid improvising during execution. The conditions should be clear and testable against historical data. If the return is not confirmed, skip the trade. If the setup meets your criteria, follow the plan. Avoid adding filters that have not been tested.
Step 5. Recognize when the setup is invalid
The failed breakout setup is invalidated if price does not return to the range but instead holds beyond its boundaries and continues moving. In this case, the breakout may be genuine rather than false. Consecutive candles closes beyond the level and a lack of rejection back into the range suggest that the breakout is holding. The reversal scenario is no longer valid under these conditions.
Do not trade against the move if the setup criteria are not met. Skip the trade. If you already have a position open, follow your stop-loss plan and do not widen the stop in the hope of a reversal.
Trade execution and order mechanics
Once the setup and trigger are defined, focus on execution. Do not chase price: a market order allows for immediate entry, but high volatility can lead to slippage and a worse fill price. A limit order placed near a key area gives you more control over the entry price but may not be filled. A stop order placed beyond the confirmation level can trigger an entry if price continues in that direction. Choose the order type based on the setup and your planned entry conditions.
Calculate position size based on the distance to the stop-loss and your acceptable risk, not your desired profit. The farther the invalidation level is from the entry, the smaller the position should be for the same level of risk. Place the stop-loss when opening the trade. Set your profit target in advance using market structure, such as the next significant swing or the opposite side of the range. As price approaches the target, you can take partial profits or move the stop to breakeven if this fits your plan. Do not add to a losing position (average down) unless this is part of a tested strategy.
Follow your plan rather than making decisions based on emotion. Practice placing orders in advance so that when a signal appears, you can focus on market context instead of operating the platform. Test order execution using historical data, where supported, and on a demo account. Check that stop-loss and take-profit orders behave as expected under your platform's execution rules. This preparation may seem routine, but execution errors can cause losses even when the setup is sound. Trade execution therefore requires the same discipline as market analysis.
No-trade filters
You already know how to identify setups and entry triggers, but it is equally important to recognize when to skip a trade. Filters help maintain discipline and avoid unfavorable market conditions:
- The first filter is market structure. If the higher timeframe does not provide a clear picture of the market, it may be better to stay out. Uncertainty alone is not a signal.
- The second is the price location. In the middle of a range, price action signals are generally less informative than those near key levels. Wait for the price to reach a significant area.
- The third is volatility. During periods of low activity or ahead of major news events, price movements may be less predictable. If market conditions do not suit your strategy, skip the trade.
- The fourth is timeframe alignment. If the lower timeframe conflicts with the higher-timeframe context, first determine what is causing the discrepancy. The lower-timeframe move may represent a temporary pullback within the prevailing trend, an early sign of a potential reversal, or simply short-term noise. Avoid entering until the price action becomes consistent with your trading plan. If the conflict remains unresolved or the lower-timeframe signal contradicts the broader structure, skip the trade.
- The fifth is the reward-to-risk ratio. If the potential profit does not meet your minimum requirement relative to the risk, pass on the trade.
- The sixth is your own state of mind. Fatigue, irritation, or the urge to recover losses can impair objective judgment. If you cannot follow your plan, take a break.
Filters do not guarantee profits, but they can help reduce impulsive entries and keep you focused on setups that fit your strategy. Write down your rules in advance and test them against historical data. Make sure they filter out weak setups without excluding too many promising opportunities. Adjust them to your trading style.
Whenever a signal appears, go through your checklist. If any required condition is not met, skip the trade. This helps manage risk and avoid emotionally driven entries. Sometimes, the best decision is to skip the trade.
A five-step protocol from market analysis to execution
A structured trading process turns market analysis into consistent execution decisions. This five-step protocol links market context, price location, and entry signals with risk management to provide a clear framework for evaluating setups and executing trades.
Step 1. Classify the market environment
Start by examining the market context and current price location. On the higher timeframe, identify whether the market is trending or ranging. A sequence of higher highs and higher lows defines an uptrend, while lower highs and lower lows define a downtrend. If price moves within established boundaries without forming new swing highs or swing lows, the market is in a range.
Do not skip this step, as your trading strategy depends on the prevailing market conditions. In a trending market, look for continuation setups in the direction of the trend. In a range, focus on price reactions near the upper and lower boundaries. If market structure does not provide a clear directional bias or a well-defined trading environment, it is better to stay out of the market.
Step 2. Define the location
Identify where price is trading relative to key areas: a significant level, a previous swing, a broken level, a range boundary, or the middle of the range. This location affects the weight of a signal. The same trigger can carry different significance depending on where it appears. If price is in the middle of the range, wait for a better setup. Near a key area, watch for a price reaction and prepare for a potential entry.
Step 3. Wait for the trigger
You have identified market structure and price location, but you still need an entry trigger: a specific price action condition that defines when to enter. Wait for a clear reaction at the chosen area, such as a bounce, an engulfing pattern, or a breakout confirmed by a candle close beyond the level. Do not enter based on assumptions alone. Without a trigger, you are guessing; with one, you follow your trading plan. Remember, a signal is less meaningful without market context. Both location and timing matter.
Step 4. Define invalidation
Before entering a trade, define the level that invalidates your setup. This could be the nearest swing, a range boundary, or the area where the signal formed. The level should align with market structure and the setup's logic. Mark it in advance and set your stop-loss accordingly. Do not widen the stop in hopes of a reversal. If the setup is invalidated, follow your plan. A clear invalidation level helps prevent impulsive decisions and manage risk.
Step 5. Define the trade parameters
Before entering the trade, define the entry point, invalidation level, stop-loss, and profit target. The invalidation level should reflect the point at which the trading scenario is no longer valid, while the stop-loss determines where the position will be closed if price reaches that level.
Use market structure to identify a realistic profit target, such as the next significant swing high or low, a key resistance or support level, or the opposite boundary of a trading range. Make sure the target offers a reasonable reward relative to the risk. Calculate position size based on the distance to the stop-loss and your acceptable risk, not your desired profit. The farther the stop-loss is from the entry, the smaller the position should be for the same level of risk.
Once all parameters are defined, check that they align with your trading plan. If the potential reward does not justify the risk, or the entry, stop-loss, and target do not fit the market context, skip the trade.
This final check completes the protocol and helps you stay objective. Once in a trade, follow your predefined plan. If price reaches the stop-loss or another invalidation condition is met, follow your exit rules. Do not change the plan impulsively in response to short-term price fluctuations.
Conclusion
Market structure and price action address two different aspects of Forex technical analysis: market context and observable price behavior. For price action traders, market structure helps identify where a signal forms, distinguish potential trend continuation from counter-trend setups, and filter out trades that do not meet predefined criteria. Price action, in turn, helps establish specific entry conditions as market context alone does not guarantee a successful trade.
Evaluating performance requires an understanding of risk and the probabilistic nature of trading. Any setup can result in a loss, and a series of losing trades does not necessarily mean a strategy is ineffective. Consistent position sizing, predefined stop-loss rules, and analysis of a sufficiently large sample of trades help manage risk and distinguish normal outcome variability from evidence of a potentially sustainable trading edge.
Neither disciplined risk management nor the combination of market structure with price action guarantees profitability in the foreign exchange market. The value of this approach depends on clear rules and validation through actual trading results.


