Video | Market Technical | Solid ECN

SOLIDECN

Master Trader
Nov 16, 2021
3,116
22
54
39

EURUSD

21.12.2021


Welcome to Market insight by Solid ECN. Today we are looking at euro-dollar technical.

The euro/dollar continued the decline below the 150 moving average on both weekly and daily charts. The Level 61 of the Fibonacci retracement has slowed down the momentum, and as of today, the price is consolidating around 1.130 area.

We see the price action caused a Doji and a hammer candlestick on the weekly chart, justifying the consolidation, or perhaps, a trend reversal.

Zooming in to the daily chart. The pair is struggling around the Fibonacci 61 level, in the four-hour chart, we see the market is being compressed between 1.136, and 1.119, forming double tops and double bottoms.

As long as the market holds above 1.120, there is a chance for the euro to recover some of its loss in December, before the year ends. The first target could be hitting the 1.138 resistance, to aim 1.146 on the second go.

Solid ECN statistics show that bulls are targeting 1.15 with a risk of December low.​


Disclosure: Please note that foreign exchange and other leveraged trading involve a significant risk of loss. It is not fit for all investors and you should make sure you realize the risks involved, seeking independent advice if necessary.
 

SOLIDECN

Master Trader
Nov 16, 2021
3,116
22
54
39

GBPUSD​

21.12.2021​


banner-gbpusd.png

We are on the GBPUSD daily chart, where the pair is trading below the 1.35 key resistance. The next significant support lays far on September low at 1.267. The Fibonacci retracement kit draws the key support from March 2020 lower low to June 2021 higher high. The pair is trading in the declining channel supported with 38.2 Fibonacci retracements, suggesting a halt on the downtrend momentum.

Zooming in, the Level 38.2 of the Fibonacci retracement, and the declining trend line supports the buying bid, targeting the one point thirty five area. The bull's path to one point thirty five will be paved, If they can pass the minor resistance at one point thirty three.

On the other hand, 1.316 plays the support. The trend would continue declining if the last support fails to hold the bears from pushing down further.

Please note that foreign exchange and other leveraged trading involve a significant risk of loss. It is not fit for all investors and you should make sure you realize the risks involved, seeking independent advice if necessary.​
 

SOLIDECN

Master Trader
Nov 16, 2021
3,116
22
54
39

GOLD

22.12.2021​

GOLD BANNER.png

Today we will be reviewing the gold price versus the dollar.

The metal has been losing value against the dollar since June 21.

Zooming in, the June higher high formed a declining line with the March higher low. The yellow metal struggled to break through the $1880 level, but it was pulled down by bears, and it has been trading below the $1880 level ever since. At the bottom, we have the December and the July's low figured a double bottom pattern. Referring to the nature of the double bottom pattern, the buyers are optimistic about breaking the key resistance at $1880. This level has been capping the gold's price in the last few weeks.

If the market surpasses the sealing on $1880, the next target would be retesting the August high and the physiologic price at $2,000.

The key support is at $1670. The deck may magnet the price down. In this scenario, bears must beat the support at $1760 first. That will pave the road to retest the $1670 area.

For day-to-day trading, Solid ECN analytic shows that buyers are targeting $1860 with the risk of hitting the $1770, and sellers target $1670 with the risk of stopping at $1880.​


Disclosure: Please note that foreign exchange and other leveraged trading involve a significant risk of loss. It is not fit for all investors and you should make sure you realize the risks involved, seeking independent advice if necessary.
 

SOLIDECN

Master Trader
Nov 16, 2021
3,116
22
54
39

AUDUSD​

23.12.2021​


audusd-forum banner.png

Today we review the Australian dollar against the US dollar on MetaTrader 5 platform.

The pair downside movement from February higher high slowed down in December, and as of analyzing, the AUD USD is trading around 0.72 area. The bears went off-road in their latest push to race the bulls away from the ascending channel. The vital support at 0.699 successfully holds the selling pressure so the Bulls can start biding and drag the race away from the last support standing.

From a technical standpoint, the MACD indicator shows both the divergence and the crossover signals, forecasting a trend reversal or a sideways market. Considering the 0.699 is the key to halting the further decline, the Australian dollar may target 0.755 as its first checkpoint.

Zooming out to the AUD USD weekly chart. The 0.699 is the key support. With a break of this threshold, bears road to checkpoint 0.669 will be paved.

Solid ECN statistics show that the bulls are hoping for 0.755 with the risk at 0.695, and the bears are more optimistic by having their bids on 0.6673.

Please note that foreign exchange and other leveraged trading involve a significant risk of loss. It is not fit for all investors and you should make sure you realize the risks involved, seeking independent advice if necessary.
 

SOLIDECN

Master Trader
Nov 16, 2021
3,116
22
54
39

USDCAD

23.12.2021​


forum banner - usdcad.png

Welcome to Solid ECN Market Analysis, today we will be looking at USD-CAD pair on the weekly and daily chart on our MetaTrader 5 platform.

The pair is currently trading around the pivot of 0.918. The bull's pressure was capped by the ascending trendline, which is valid since April 2019. The ascending trendline showed strength five times already. The battle between bears and bulls from 0.875 has formed a triangle, and the market is being squeezed as this report is published.

Minor Support levels are:
0.908
0.901

The main support levels are:
0.892
0.875

The downside movement started from 0.937 would probably ease at 0.908. With the hold of this level, the USD would have another leg extending to the upper side of the wedge at 0.93, and then we should wait for market behavior after hitting the ascending trendline for the sixth time.

From a technical standpoint, the failure of the 0.9086 support, signals the resumption of the CAD powering against the USD. In this scenario, the bear's path to the checkpoints at 0.892 and 0.8757 will be paved.

The market may influence by hedge funders, and there is a possibility of erratic movement. Please consider this risk before entering a trade on the new year's holiday.
 

SOLIDECN

Master Trader
Nov 16, 2021
3,116
22
54
39

EURUSD | GBPUSD | USDJPY

27.12.2021​


usd ipy banner.png

Today we will be looking at euro dollar, GBP USD, and USD JPY weekly and daily charts.

The Euro Dollar downside momentum from 1.226 eased at the Fibonacci 61.8 level near 1.118. The candles formed a "bullish Doji star" and a "hammer" pattern forecasting an upcoming trend reversal. The pattern can be spotted in the daily chart. Indicator-wise, the MACD shows a divergence in the trend. So far the outcome of the MACD divergence was the trend decline slowing down around 1.118 and moving sideways. Minor resistance exists at 1.138. With a break of this fragile sealing, the instrument would probably target 1.15. On the other hand, we'll witness more decline in the pair if the support at 1.118 fails.

GBP USD bounced from the 38.2 retracement level of the Fibonacci, and it is trading close to the minor support at 1.341. With a breach in the said level, the pound sterling surge to 1.366 would probably be seen in the next few days. 38.2 Fibo at 1.3158 is the conservative support. If this level breaks, the next target would be level 50 of the Fibonacci retracement around 1.225.

If you find the content useful, please subscribe to the channel and hit the link button.

USDJPY
The bulls have an outstanding performance against the bears on the JPY USD pair. Buyers didn't cute their pressure on passing the resistance at 114.4, and the market is on its way to test the sealing for the fifth time in the last 10 days. Support is at 111.66. As long as this level holds, the market trend is bullish. Resistance is at 115.53, with a break of the level, the path of the bull to 118.66 will be paved.​


SOLIDECN

Master Trader
Nov 16, 2021
3,116
22
54
39

Gold

29.12.2021​


forum_banner.png

Today we are looking at the gold 4 hours chart.

The yellow metal breached the $1814 resistance yesterday, but the bulls couldn't hold the price above the said level. The instrument is trading near the 23.6 Fibonacci retracements. The upward trendline from December 22, and December 27 failed to keep the bullish sentiment.

Below the $1800 support is level 50 of the Fibonacci. If this minor support fails, the path to $1784 will be paved for the bears.

Trading Signal
The trend is bullish, and minor resistance will be seen from the bears here and there.
Solid ECN statistic shows that the buyers' target is $1830 and $1850 checkpoints with the risk of stopping at $1784.

On the other hand, the bears are targeting $1784 with risking the December higher high at $1820.​


SOLIDECN

Master Trader
Nov 16, 2021
3,116
22
54
39

AUD/USD

The potential for further growth may be limited


The AUD/USD pair has been showing upward trading dynamics since the beginning of this month and is currently testing the 0.7263 mark.

The strengthening of the position of the trading instrument was the result of rising commodity prices, as well as some easing of restrictions on Australian exports from China. In particular, Beijing adjusted quotes for the supply of wool from Australia by 5%, so next year producers will be able to increase the volume of production to 40K tons instead of the current 38K tons. This decision confirms the opinion of a number of Australian experts that China will not be able to completely abandon Australian raw materials, even in conditions of serious political tension.

Further strengthening of the Australian currency remains in question, as the country is experiencing a serious surge in the incidence of coronavirus caused by the Omicron strain. The number of infected citizens is increasing, and many of them have to be isolated, which creates problems for doing business. The authorities even had to weaken the testing criteria in order not to exclude a sufficiently large number of Australians from economic life. Thus, further deterioration of the epidemiological situation may well lead to new quarantine restrictions in early 2022.

As for the US currency, its position also does not look stable, since in the USA the incidence is growing at a record pace, which may lead to new economic restrictions. Today, investors are waiting for the publication of data from the labor market. In the event of a significant increase in the number of initial applications for unemployment benefits, the dollar may adjust downward, as it becomes clear that the Omicron strain has begun to put pressure on the American labor market.
Support and resistance

The key level for the "bulls" remains 0.7263 (Murray [3/8], Fibo retracement 50.0%), the breakout of which will give the prospect of further growth to 0.7325 (Murray [4/8], Fibo retracement 61.8%) and 0.7385 (Murray [5/8]). If the price is fixed below 0.7200 (Murray [2/8], Fibo retracement 38.2%), the decline will be able to resume in the area of 0.7140 (Murray [1/8]) and 0.7080 (Murray [0/8]). The indicators do not give a single signal: the Bollinger Bands are directed upwards, but the Stochastic leaves the overbought zone, forming a sell signal.

Resistance levels: 0.7263, 0.7325, 0.7385
Support levels: 0.7200, 0.7140, 0.7080​
 

Attachments

  • audusd_30122029.png
    audusd_30122029.png
    20 KB · Views: 0

SOLIDECN

Master Trader
Nov 16, 2021
3,116
22
54
39

EUR/USD​

Market uncertainty persists​


The EUR/USD pair has been trading in the sideways range of 1.1350-1.1230 (Murray [2/8]-[0/8]) since the end of last month.

Investors remain less active on the eve of the New Year and monitor the dynamics of the incidence of coronavirus infection caused by the Omicron strain. At the moment, the authorities of the USA and European countries are trying to minimize restrictive measures, trying to prevent their impact on the national economy and not cause a new negative reaction among the population. Nevertheless, the update of daily anti-records against the background of an increase in the number of infected COVID-19 around the world makes experts sound the alarm. So, in the USA, the daily incidence has reached its highest during the entire pandemic, which levels the weakness of Omicron and increases the shortage of personnel at enterprises, limiting business activity.

Under these conditions, it is quite possible to expect that local authorities will go to tighten quarantine after the New Year holidays, since it is sanitary measures that will help significantly contain the spread of the virus. Today, data on initial applications for unemployment benefits will be published in the USA, which will illustrate the impact of the pandemic on the labor market. In case of an increase in the indicator, the US currency may be under pressure.

As for the euro, its position is also unstable, since the situation with morbidity in the eurozone countries is similar to the American one. The indicators are growing, which may cause the introduction of new quarantine measures. It should also be noted that recently there is an opinion among officials of the European Central Bank (ECB) that inflation in the eurozone may be higher than the regulator's forecasts. The negative dynamics should serve as a driver for an additional reduction in economic incentives, but concrete decisions in this direction from the ECB in the near future probably will not follow.

Support and resistance
In the near future, the price of EUR/USD is highly likely to remain in the range of 1.1350-1.1230. If the level of 1.1290 breaks down (Murray [1/8], the middle line of the Bollinger Bands), the decline of the trading instrument will continue to 1.1230, after which the growth may resume to the upper limit of the 1.1350 channel. The indicators do not give a single signal: the MACD histogram is decreasing in the negative zone, but the Stochastic has reversed down.

Resistance levels: 1.1350, 1.1413, 1.1475
Support levels: 1.1291, 1.1230, 1.1170, 1.1100​

eurusd_30122021.png
 

SOLIDECN

Master Trader
Nov 16, 2021
3,116
22
54
39

Crude Oil | Wave analysis​


The price is in a correction; a fall is possible.

On the daily chart, the upward wave C forms, within which the first wave 1 of (1) of C developed. Now, a downward correction has started to develop as the wave 2 of (1), within which the wave a of 2 is formed. If the assumption is correct, the price will fall to the levels of 54.10–44.25. In this scenario, critical stop loss level is 77.56.​

WTI Crude Oil_wave analysis_1.pngWTI Crude Oil_wave analysis_2.png
 

SOLIDECN

Master Trader
Nov 16, 2021
3,116
22
54
39

EURUSD​

The euro is in a state of uncertainly​


Current trend
Since the end of November last year, this trading instrument has been moving within the sideways range of 1.1350–1.1230. Last week, the quotes made an unsuccessful attempt to consolidate above its upper border.

The December Manufacturing PMI exerted pressure on the positions of the European currency. The indicator for the EU countries decreased from 58.4 to 58.0 points, and for Germany, it was at the previous level of 57.4 points, instead of the growth expected by analysts to 57.9 points. In general, Manufacturing PMI remains significant, but the introduction of additional restrictive measures may pose a serious threat to further positive dynamics if the European authorities decide to take them.

The positions of the US dollar also do not look stable. The increase in the incidence of coronavirus infection in the United States did not cause an increase in quarantine but seriously impedes business conduct due to an acute shortage of personnel. Yesterday, the White House medical adviser Anthony Fauci once again warned citizens against a frivolous attitude towards the Omicron virus since its weakness is compensated by the scale of infections, leading to a surge in hospitalizations. Today in the US, December Markit Manufacturing PMI will be released. The indicator may decline from 58.3 to 57.8 points, putting pressure on the US currency.

Support and resistance
If the price consolidates below 1.1350, the instrument will return to the sideways channel and continue to decline to the area of 1.1290 (Murrey [1/8]) and 1.1230 (Murrey [0/8]). Otherwise, the growth of quotations will continue to the levels of 1.1475 (Murrey [4/8]) and 1.1535 (Murrey [5/8]). The indicators do not give a single signal: Bollinger bands and Stochastic are horizontal, the MACD histogram narrows in the negative zone.

Resistance levels: 1.1350, 1.1475, 1.1535
Support levels: 1.1290, 1.1230​

eurusd_trade uncertainly.png
 

SOLIDECN

Master Trader
Nov 16, 2021
3,116
22
54
39

Gold

Under Pressure from USD​


Current trend
In the first days of the new year, gold quotes are highly dependent on USD dynamics, and at yesterday's trading session, they again dropped to $1800 per ounce, near which they spent the entire second half of last year. Currently, the XAU/USD pair is correcting within a downtrend around 1805.0.

Now, when the bulk of investor capital is out of the market, metal quotes can react sharply to any changes in the information background. So, today's data on Chinese Manufacturing PMI, which rose to 50.9 points from 49.9 points a month earlier, allowed the trading instrument to start the session with growth. At the beginning of last year, after the publication of corresponding statistics, the precious metal quotes actively changed the dynamics of movement, but by the end of the year, this dependence had weakened. When the market liquidity is low, the asset reacts to almost any changes in the macroeconomic background.

As for the number of positions in gold, according to the US Commodity Futures Trading Commission (CFTC), they slightly increased to 205.8K from 202.2K a week earlier. As for the distribution of the "bulls" and the "bears" by positions, a significant advantage in favor of buyers remains. Over the past week, the number of their positions increased by 2.044K, reaching 174.261K, while for sellers, this indicator increased by 4.883K to 45.189K.

Support and resistance
On the daily chart, the price moves within the global sideways channel reversed at the upper border. Technical indicators give a weakening buy signal: indicator Alligator's EMA fluctuations range narrows, and the AO oscillator histogram forms upward bars near the transition level.

Support levels: 1786 and 1725
Resistance levels: 1830 and 1870​

xauusd_daily analysis.png
 

SOLIDECN

Master Trader
Nov 16, 2021
3,116
22
54
39

NZD/USD
Technical Forecast​


NZD USD is trading just above a fresh low for the month after prices fell sharply overnight. Prices continue to trade within the December range, with the 23.6% Fibonacci retracement providing a level of support.

A break below that would expose the December low at 0.670. If that level breaks, prices may resume the downward trend seen back in November. Alternatively, a rebound will have bulls looking to overtake the falling 26-day Exponential Moving Average.


nzdusd_forecast_712022.png
 

SOLIDECN

Master Trader
Nov 16, 2021
3,116
22
54
39

Gold​

Wave Analysis​


On the daily chart, the fifth wave of the higher level (5) develops, within which the first entry wave 1 of (5) formed, a correctional wave 2 of (5) developed, and the wave 3 of (5) formed. Now, the first wave of the lower level i of 3 is developing, within which a local correction has ended as the wave (iv) of i. If the assumption is correct, the pair will grow within the wave (v) of i to the levels of 1919.90–2067.60. In this scenario, critical stop loss level is 1752.82.

gold_1.pnggold_2.png
 

SOLIDECN

Master Trader
Nov 16, 2021
3,116
22
54
39

USDCAD​

Technical Analysis


Current trend
The USD/CAD pair continues to trade within a wide ascending channel. In the middle of last month, the price reached the area of 1.2939, but could not break through higher and began to decline.

Currently, the instrument is testing 1.2695, (Fibo retracement 23.6%), the breakdown of which will allow the quotes to decline to the levels of 1.2575 (Fibo retracement 38.2%) and 1.2480 (the lower limit of the ascending channel, Fibo retracement 50.0%). The level of 1.2939 is still the key one for the "bulls". In case of its breakout, the growth will be able to continue to the levels of 1.3062 and 1.3184 (the upper line of the ascending channel).

In general, the mid-term uptrend in the asset remains, but technical indicators do not exclude a correction within its framework: Stochastic is trying to reverse down, the MACD histogram is preparing to move into the negative zone and form a sell signal.

Support and resistance
Resistance levels: 1.2939, 1.3062, 1.3184.
Support levels: 1.2695, 1.2575, 1.2480.​

usdcad_technical analysis_712022.png
 

SOLIDECN

Master Trader
Nov 16, 2021
3,116
22
54
39
Monday Morning Market Review

morning market review_forum banner.png

EUR/USD
The European currency shows a moderate decline against the US dollar during the Asian session, correcting after a significant increase last Friday, when investors were actively buying the single currency amid the publication of upbeat macroeconomic statistics from Europe. The Consumer Price Index in the euro area in December rose by 5% after increasing by 4.9% a month earlier. Analysts had expected the dynamics to slow down to 4.7%. At the same time, the Core Consumer Price Index retained the same dynamics at 2.6%, which also turned out to be slightly better than the market forecasts of a slowdown to 2.5%. Retail Sales in November showed a record growth of 7.8% after increasing by 1.7% a month earlier. Market expectations assumed the growth of the indicator by 5.6%. In turn, the American currency came under pressure after the release of the controversial report on the US labor market for December. In particular, Nonfarm Payrolls in December 2021 amounted to only 199K, having fallen from 249K in November. Forecasts suggested an increase of 400K.

GBP/USD
The British pound is trading near zero against the US currency during the morning session, consolidating around 1.3580 and local highs from November 9. At the end of the last trading week, the pound managed to demonstrate a fairly confident growth, which was the market's reaction to the emergence of not the strongest macroeconomic statistics from the United States. Investors were disappointed by the weak growth in Nonfarm Payrolls in December. The real dynamics turned out to be twice as bad as the market forecasts at the level of 400K, while the other parameters of the report turned out to be quite optimistic. The Unemployment Rate in December continued to decline and reached 3.9% after 4.2% in November. Statistics from the UK also did not help to clarify the situation on the market. Markit Construction PMI in December fell from 55.5 to 54.3 points, which turned out to be slightly better than the market forecasts of a decline to 54 points. Halifax House Prices in December remained unchanged at 1.1%, while investors expected it to decline to 0.7%.

NZD/USD
The New Zealand dollar has seen a slight decline against the US currency during the Asian session, correcting after Friday's gains that interrupted a two-day "bearish" rally. Following the decline in the middle of last week, the New Zealand dollar renewed its local lows from December 21. The development of the downtrends was facilitated by the statements of the representatives of the US Fed, who signaled an imminent tightening of monetary policy in the country against the background of the continuing growth of inflation and stabilization in the labor market. In turn, Friday's report on the US labor market for December 2021 somewhat cooled the fervor of investors. Nonfarm Payrolls grew by only 199K in December, which turned out to be worse than not only the forecasts of 400K, but also the previous value of 249K. Trading activity today remains low due to the relatively empty macroeconomic calendar. Investors expect clarification of the situation with the prospects for tightening monetary policy by the US Federal Reserve, but the news will appear only on Tuesday, when the Chair of the regulator Jerome Powell will give a speech in the US Congress.
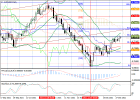
USD/JPY
The US dollar shows restrained gains against the Japanese yen in Asian trading, testing 115.80 for a breakout. The instrument is recovering from its local lows, which were updated due to the development of "bearish" sentiments at the end of the last trading week. At the same time, the pair continues to hold near record highs. The positions of the American currency strengthened again last week after the publication of the "hawkish" minutes of the US Federal Reserve meeting, which indicated the likelihood of a faster tightening of monetary policy by the American regulator in the near future. In particular, the US Fed may agree to the early completion of the quantitative easing (QE) program, which will entail a shift in the timing of the start of the cycle of raising interest rates. Statistics from Japan, released last Friday, leave much to be desired. Household Spending in November fell again by 1.3% after falling by 0.6% in October. Analysts had expected positive dynamics to appear at 1.6%. At the same time, Tokyo Consumer Price Index in December increased from 0.5% to 0.8%.

XAU/USD
Gold prices show a slight decline at the beginning of the new week, consolidating near 1800.00. Pressure on the instrument's position is exerted by the minutes of the US Federal Reserve meeting published last week, which indicated the "hawkish" position of the American regulator regarding the tightening of monetary policy. The US Fed notes high rates of growth in consumer inflation, as well as a tense situation in the labor market. At the same time, Friday's report on the US labor market showed weak growth in Nonfarm Payrolls. In December, only 199K jobs were created, while investors hoped to overcome 400K.​
 

SOLIDECN

Master Trader
Nov 16, 2021
3,116
22
54
39

AUD/USD​

Positive statistics support the instrument​


Current trend
The AUD/USD pair trades above the level of 0.7158, supported by the macroeconomic statistics.

Thus, the number of preliminary building permits in Australia rose by 3.6%, despite the forecast of 3.2%. The previous value was revised downward to –13.6%. Investors expect the November retail sales data to be released tomorrow at 02:30 (GMT+2). According to forecasts, it will amount to 3.9%. Positive economic data from Australia temporarily restrain the trading instrument from further decline, leaving a chance for the "bulls" to break through the level of 0.7265.

Additional support to the asset was provided by publishing data on the US labor market last Friday. December Nonfarm Payrolls amounted to 199K against the forecast of 400K, but the previous figure was corrected upward from 210K to 249K. Unemployment decreased again and amounted to 3.9%, although analysts had forecast a decline of 0.1% to 4.1%.

On the other hand, Australia is starting to vaccinate children aged 5–12 years after the number of infections increased significantly on New Year's holidays, exceeding 116K cases per day. The virus forces Queensland to postpone its annual school reopening by a month until early February. The epidemiological situation is worsening, although politicians cite positive scientific studies on the effect of the Omicron strain on mortality to maintain optimism. For a while, it may support buyers of the Australian dollar, but given the planned rate hikes by the US Federal Reserve in 2022, the pair's growth looks limited.

Support and resistance
The long-term trend is downwards. In December, the pair gained support at 0.6995, after which it started an upward correction, within which it tested the resistance level of 0.7265. If this level is held, the fall will continue with the target at the December low.

The medium-term trend is upwards towards the target zone 2 (0.7329–0.7313). Last week, the price corrected, approaching the key support for the trend around 0.7117–0.7101. After the test of key support, it is worth opening long positions.

Resistance levels: 0.7265, 0.7457, 0.7541.
Support levels: 0.7158, 0.6995, 0.6830.​

audusd_analysis_1.pngaudusd_analysis_2.png
 

SOLIDECN

Master Trader
Nov 16, 2021
3,116
22
54
39

BTC is losing ground amid events in Kazakhstan​


Current trend
Last week, the BTC/USD pair continued to decline and tested the level of 41000.00.

The instrument was pressured by two negative factors – the publication of the minutes of the last meeting of the US Federal Reserve, filled with the “hawkish” rhetoric, and the events in Kazakhstan. In the minutes of the American regulator, it was noted that it could start raising rates earlier than planned, as the factors of inflation growth in the country persist. Experts believe that the first increase may take place in March, and the December positive data on the US labor market only strengthens confidence in this. The prospect of an imminent tightening of monetary policy puts pressure on alternative assets, including digital ones.

Events in Kazakhstan, where more than 18% of the world's cryptocurrency mining is concentrated, led to a decrease in the activity of large mining pools and a decrease in the BTC hash rate by 12%. Currently, the situation is normalizing, however, the first cryptocurrency does not receive the necessary support to restore lost positions.

Support and resistance
The key “bearish” level is 41000.00. Its breakdown allows further decline to 37500.00 (Murrey [–2/8]). The breakout of 43750.00 (Murrey [–1/8]) allows growth to 46400.00 (middle line of Bollinger bands) and 50000.00 (Murrey [0/8]). The continuation of the decline seems more likely since the reversal of Bollinger bands downward and the increase in the MACD histogram in the negative zone indicate that the downtrend continues. Stochastic's exit from the oversold zone does not exclude an upward correction but its potential seems limited.

Resistance levels: 43750.00, 46400.00, 50000.00.
Support levels: 41000.00, 37500.00.​

btcusd_technical analysis.png
 

SOLIDECN

Master Trader
Nov 16, 2021
3,116
22
54
39

USD/JPY

US labor market report disappoints the market​


Current trend
The USD/JPY declines, trading around 115.81. Also to poor macroeconomic statistics, the asset is negatively affected by the introduction of new coronavirus restrictions in some prefectures of Japan.

The areas of Okinawa, Hiroshima, and Yamaguchi had the highest number of new cases of infection, and the authorities decided to restrict the operation of catering establishments and public events. The head of the Japanese Doctors' Association, Toshio Nakagawa, announced the sixth wave of the epidemic in the country. On Thursday, for the first time since mid-September, 4.475K infected people per day were detected. Also, the Household Expenditure Index declined by 1.3% YoY for November, with an expected growth of 1.6%, and declined by 1.2% MoM after rising by 3.4% for the previous period.

USD didn't take full advantage of the JPY weakness, as the report on the US labor market disappointed investors. Although the unemployment rate for December fell to 3.9% from 4.2% for November, Nonfarm Payrolls increased by only 199K, with an expected increase of 400K. Private Nonfarm Payrolls rose by 211K, below the projected 365K people, too. The number of jobs in the manufacturing industry also was worse than expected – 26K against 35K forecasted.

Support and resistance
The instrument is correcting upwards, trying to consolidate above the global high of the year. Technical indicators maintain a stable buy signal: indicator Alligator's EMA fluctuations range expands upwards, and the histogram of the AO oscillator forms new upward bars in the buy zone.

Resistance levels: 116.34, 118.00.
Support levels: 114.83, 112.70.​

usdjpy_technical analysis.png