
The Best Forex Patterns
- Thread starter contest
- Start date
- Watchers 1
-
- Tags
- best pattern pattern
You are using an out of date browser. It may not display this or other websites correctly.
You should upgrade or use an alternative browser.
You should upgrade or use an alternative browser.
The Best Forex Patterns
A buying opportunity in EURCAD currency pairs
The following chart is about EURCAD currency pairs in 1 hour time frame which according to the technical analyses and their indicators we can expect a good buying opportunity.
This buying opportunity appears several times in this chart.
A buying opportunity in EURCAD currency pairs
Harmonic pattern of AB=CD
The main technical pattern in this example is the harmonic pattern of AB=CD which has the ideal ratios of 127.2=78.6. This pattern is one of the strongest reversal patterns which mostly forms during the price corrections. Other important ratios of this pattern are 161.8=61.8 or 200=50 which they have golden ratios.
Candle stick patterns
In forming the D dot, the formation way of the candlestick patterns is very important. In this example, the formation way of the candles shows that a bottom price is formed and the falling of the prices is stopped. Among the formed candles, there is an inverted hammer candle stick pattern which shows the possibility of stopping of price falling as you can see in the picture.
Observing the fifth waves of Eliots’ waves pattern
Type of formed candlestick patterns with the important pattern of AB=CD is a very important warning about the rising of the price. At this time, another technical analysis, Eliots’ waves, reinforces this rising of the price. On the CD side of AB=CD pattern you see a movement of the fifth wave of Eliots’ wave which obeys all of the important rules of the Eliots’ waves and also issues the end the falling process. The combination of the Eliots’ waves and harmonic patterns provide a clear analysis of the market for the traders.

A buying opportunity in EURCAD currency pairs
The following chart is about EURCAD currency pairs in 1 hour time frame which according to the technical analyses and their indicators we can expect a good buying opportunity.
This buying opportunity appears several times in this chart.
A buying opportunity in EURCAD currency pairs
Harmonic pattern of AB=CD
The main technical pattern in this example is the harmonic pattern of AB=CD which has the ideal ratios of 127.2=78.6. This pattern is one of the strongest reversal patterns which mostly forms during the price corrections. Other important ratios of this pattern are 161.8=61.8 or 200=50 which they have golden ratios.
Candle stick patterns
In forming the D dot, the formation way of the candlestick patterns is very important. In this example, the formation way of the candles shows that a bottom price is formed and the falling of the prices is stopped. Among the formed candles, there is an inverted hammer candle stick pattern which shows the possibility of stopping of price falling as you can see in the picture.
Observing the fifth waves of Eliots’ waves pattern
Type of formed candlestick patterns with the important pattern of AB=CD is a very important warning about the rising of the price. At this time, another technical analysis, Eliots’ waves, reinforces this rising of the price. On the CD side of AB=CD pattern you see a movement of the fifth wave of Eliots’ wave which obeys all of the important rules of the Eliots’ waves and also issues the end the falling process. The combination of the Eliots’ waves and harmonic patterns provide a clear analysis of the market for the traders.
Attached File(s)

GBPCHF,H4
Harmonic patterns and Elliott waves.
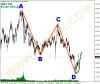
Elliott waves and harmonic patterns are two most important technical analyses in order to predict the currency and stocks’ market. Many traders are using these analyses to be more successful. Although, these technical analyses are separated and different from each other but in fact they cooperate very well in the market. For example, a Harmonic Gartley pattern, most of the times, forms in the second wave of an advanced wave which, in fact, is the correction of the first wave movement. This formation happens several times in charts and at the same time sends good signals to technical traders.The following chart is GPB/CHF currency pairs in 4h time frame which shows the above point perfectly. However, A harmonic pattern’s expert can easily determine and draw this pattern which consists of X,AB,C,D points. When the point D is forming, a movement in the fifth advanced wave is also forming (from D to E). This simultaneous formation duplicate the importance of Crab pattern. These 5 waves, which are in complete accord with the Eliot’s rules, are determined by the green color:
Another important point is the clarity state of fifth wave which confirms and issues the end of main fifth wave.
5 to 5
In studying Eliot’s wave, when we want to open a position unlike the current trend, it is logical to get a confirmation from the fifth wave. This confirmation is the internal counting of fifth advanced wave. When a trader counts the fifth wave correctly and according to the Eliot’s rules, he will have a successful trade.In this chart, the internal counting, which is according to the above rules, is determined by the blue color. Finally, it shows that the completion of these five waves is finished with a smaller ratio in the main fifth wave.

Harmonic patterns and Elliott waves.
Elliott waves and harmonic patterns are two most important technical analyses in order to predict the currency and stocks’ market. Many traders are using these analyses to be more successful. Although, these technical analyses are separated and different from each other but in fact they cooperate very well in the market. For example, a Harmonic Gartley pattern, most of the times, forms in the second wave of an advanced wave which, in fact, is the correction of the first wave movement. This formation happens several times in charts and at the same time sends good signals to technical traders.The following chart is GPB/CHF currency pairs in 4h time frame which shows the above point perfectly. However, A harmonic pattern’s expert can easily determine and draw this pattern which consists of X,AB,C,D points. When the point D is forming, a movement in the fifth advanced wave is also forming (from D to E). This simultaneous formation duplicate the importance of Crab pattern. These 5 waves, which are in complete accord with the Eliot’s rules, are determined by the green color:
- The third advanced wave is not the smallest wave.
- The fourth wave has an acceptable overlap with the first wave.
- The corrective wave of number 2 has a good reversal. (The second wave cannot start correction until the first one starts)
Another important point is the clarity state of fifth wave which confirms and issues the end of main fifth wave.
5 to 5
In studying Eliot’s wave, when we want to open a position unlike the current trend, it is logical to get a confirmation from the fifth wave. This confirmation is the internal counting of fifth advanced wave. When a trader counts the fifth wave correctly and according to the Eliot’s rules, he will have a successful trade.In this chart, the internal counting, which is according to the above rules, is determined by the blue color. Finally, it shows that the completion of these five waves is finished with a smaller ratio in the main fifth wave.
Attached File(s)

A good selling opportunity in the CAD/JPY currency pairs
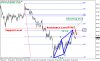
The following example is the analysis of CAD/JPY in daily time frame. By using this analysis, a trader can understand about the possibility of the price falling in the next days or weeks and also use this knowledge in his trading. In the chart, we specified 4 important technical reasons for starting of the price falling on 31st of October.
Formation of the third point of descending trend’s line
The price range on 31st of Oct is under the influence of descending trend’s line which consists of two price peaks number 1 and 2. The role of this line is preventingmore ascending in the price. When the price reaches this line, the first warning of ending of the ascending process will be issued.
Formation of long shadows in candles in the third point of descending trend’s line
As it is indicated in the picture (green area), when the price reaches the descending trend’s line, we see the formation of long shadows in the candles. This formation shows the importance of this line and also it shows that buyers should be careful about their trading. So, a professional trader prefers to make cash his buying trades and leaves the stage. More addition, the long shadows indicate the exit of the buyers and therefor the sellers become stronger more.
The ideal pattern of AB=CD
As the third point of the descending trend’s line is formed, the harmonic pattern of AB=CD with the ideal ratios of 50 to 200 will form too. Accompaniment of this pattern and descending trend line is a clear warning of more descending of the price for the sellers.
Third point standing in the Fibonacci’s corrective levels
The third point of descending trend’s line is located in the range of corrective ratios of Fibonacci with the percentages of 50 and 38.2. These ratios are drawn from price peaks, 1and 2, and will influence the third point.
Written by the analytic team of FXMIM Company

The following example is the analysis of CAD/JPY in daily time frame. By using this analysis, a trader can understand about the possibility of the price falling in the next days or weeks and also use this knowledge in his trading. In the chart, we specified 4 important technical reasons for starting of the price falling on 31st of October.
- Formation of the third point of descending trend’s line
- Formation of long shadows in candles in the third point of descending trend’s line
- The ideal pattern of AB=CD
- Third point standing in the Fibonacci’s corrective levels
Formation of the third point of descending trend’s line
The price range on 31st of Oct is under the influence of descending trend’s line which consists of two price peaks number 1 and 2. The role of this line is preventingmore ascending in the price. When the price reaches this line, the first warning of ending of the ascending process will be issued.
Formation of long shadows in candles in the third point of descending trend’s line
As it is indicated in the picture (green area), when the price reaches the descending trend’s line, we see the formation of long shadows in the candles. This formation shows the importance of this line and also it shows that buyers should be careful about their trading. So, a professional trader prefers to make cash his buying trades and leaves the stage. More addition, the long shadows indicate the exit of the buyers and therefor the sellers become stronger more.
The ideal pattern of AB=CD
As the third point of the descending trend’s line is formed, the harmonic pattern of AB=CD with the ideal ratios of 50 to 200 will form too. Accompaniment of this pattern and descending trend line is a clear warning of more descending of the price for the sellers.
Third point standing in the Fibonacci’s corrective levels
The third point of descending trend’s line is located in the range of corrective ratios of Fibonacci with the percentages of 50 and 38.2. These ratios are drawn from price peaks, 1and 2, and will influence the third point.
Written by the analytic team of FXMIM Company
Attached File(s)

Technical analysis of GBPUSD
The following example is a typical example which shows the power of technical analysis and concentration of the Forextraders to the principles of technical analysis. This educational example reminds the traders that the market should be analyzed for a long time no just a short period of time.The below chart is the chart of GBP/USD in 1h time frame from 8th of February to 16th of February. On 8th February to 9th February, two important price peaks were formed which are indicated by red circles in the below picture. By linking these two points, which are the price ceilings, a descending trend line will form which we can use it for technical analysis and forecasting the future of the market (Points 1, 2). In this example, the descending trend line works very well and it prevents forming of an ascending trend for 4 times.
Analyzing of points 3, 4, 5, 6
Point 3
The first encounter of the price with the descending trend line happens in this point. Please consider how the price moves toward the descending line with the ascending candles strongly. But as soon as reaching of the price to this line, the price will stop moving and this is a sign of buyers’ retreat and their loss.
Point 4
After the falling of the price in point 3, the buyers are more conservative about the market. Therefore, The price with a harmonic movement of AB=CD which indicates a reformation in the price moves toward the descending trend line. Formation of several candles on the trend line indicates that there is war between the buyers and sellers but this war is not the sign of decisiveness of the sellers. Finally, the price fell and by considering the pattern of AB=CD the trader believed that the possibility of the success of point 4 is more than the other points.
Point 5
The price peak of point 5 is more than 50% in Fibonacci ratios (from the begriming of falling of the price is point 4 to the end of it) which along with the descending trend line causes the falling of the price for the second time.
Point 6
In analyzing the point 6, traders find a harmonic pattern of AB=CD. This pattern is a sign of falling of the price from this point.
End of the descending trend line
The warning of trend line’s losing power is issued by the formation of the harmonic and strong pattern of AB=CD which are indicated by the green lines. As you can see after the falling of the price in point 6 the ascending trend of the price is started. The important point which proves the accuracy of the performance of the AB=CD pattern, indicated by green line, is accompanying pattern like the AB=CD pattern itself. This same pattern make the AB=Cd pattern a stronger comparing the normal pattern.
Written by the technical team of FXMIM
Attached File(s)

The Best Forex Chart Trading Pattern
Changing Resistance levels to support levels
EURUSD,M15
By studying and reviewing the currency pair’s diagram, you can find a strong technique which can help you to analysis the market better. When the support levels or resistance levels are broken by the price and cross these levels, when they will come back and come near to these levels again their properties changes and they will play a new role.You can use it as a support level if the broken level was a resistance level or you can use it as a resistance level if the broken level was a support level.
Written by the analytic team of FXMIM Company
Attached File(s)

The Best Forex Chart Trading Pattern
Multiple Analyses
CADJPY
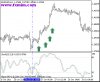
A trader can use different ways of analysis in different time frames to get a better result. For example, Stoch indicator sends a buying signal in EURUSD 1 hour time frame and this indicator located in the selling part. If you focus on a lower time frame, for example 5 minutes time frame, at this time you will find out thatthe Stoch indicator’s buying signal here is more accurate than when you study the indicator’s signal in larger time frames because you used multiple analyses in your reviewing the charts. You can use the multiple analyses in 2 time frames and more and at the same time use different ways without any limitation.


Harmonic pattern of AB=CD and Stoch indicator
We use a strong harmonic pattern of AB=CD and the famous Stoch indicator as multiple analyses in the following example. In reviewing the daily chart of CADJPY we see a harmonic movement of the price like the AB=CD which they have ideal ratio of 161.8=61.8 which we can draw it easily. After the completion in point D, (this pattern should be like Candle stick pattern and there is a lot of attention on this point thus we use this point as a confirmation of the pattern), the warning of the raising of the price in future days was issued on 14th of September therefor, you can continue buying until this pattern is defeated. If you are one of those traders who like to see the result of his trades at the end of the day the daily time frame is not suitable for you and it is better to use lower like frame like 1 hour time frame. Using Stoch indicator is good when, after the completion of this pattern, we use the 1 hour timeframe for the short time trades and also wait for the suitable time of thebottom price to enter and use stop loss technique.In the picture 2 the red line is the time of the completion of the AB=CD pattern and the blue line is the bottom price which is predicated by the Stoch indicator and these predications are correct most of the times.As we explained through the example using 2 time frames for analysis and starting a trade gives us accurate and correct information. The techniques which we will use for each time s frame could be different as you saw in the example.


Written by the analytic team of FXMIM Company
Multiple Analyses
CADJPY
A trader can use different ways of analysis in different time frames to get a better result. For example, Stoch indicator sends a buying signal in EURUSD 1 hour time frame and this indicator located in the selling part. If you focus on a lower time frame, for example 5 minutes time frame, at this time you will find out thatthe Stoch indicator’s buying signal here is more accurate than when you study the indicator’s signal in larger time frames because you used multiple analyses in your reviewing the charts. You can use the multiple analyses in 2 time frames and more and at the same time use different ways without any limitation.
Harmonic pattern of AB=CD and Stoch indicator
We use a strong harmonic pattern of AB=CD and the famous Stoch indicator as multiple analyses in the following example. In reviewing the daily chart of CADJPY we see a harmonic movement of the price like the AB=CD which they have ideal ratio of 161.8=61.8 which we can draw it easily. After the completion in point D, (this pattern should be like Candle stick pattern and there is a lot of attention on this point thus we use this point as a confirmation of the pattern), the warning of the raising of the price in future days was issued on 14th of September therefor, you can continue buying until this pattern is defeated. If you are one of those traders who like to see the result of his trades at the end of the day the daily time frame is not suitable for you and it is better to use lower like frame like 1 hour time frame. Using Stoch indicator is good when, after the completion of this pattern, we use the 1 hour timeframe for the short time trades and also wait for the suitable time of thebottom price to enter and use stop loss technique.In the picture 2 the red line is the time of the completion of the AB=CD pattern and the blue line is the bottom price which is predicated by the Stoch indicator and these predications are correct most of the times.As we explained through the example using 2 time frames for analysis and starting a trade gives us accurate and correct information. The techniques which we will use for each time s frame could be different as you saw in the example.
Written by the analytic team of FXMIM Company
Attached File(s)


The Best Forex Patterns
Technical analysis of currency market
The below chart is the CHFJPY chart in 1 h which is a good educational example to show a technical analysis with a high accuracy. There is a non-ideal harmonic pattern of AB=CD with 161.8 and 78.6 which is look like an ideal pattern. Simultaneous existence of different techniques and other analyses prove the accuracy of this technical analysis. The important point here is that, this pattern is formed from a descending trend and it is possible that this pattern is the reformed form of its descending form and thissupposition increases the possibility of another descending trend.
Points to remember:
1. You should always check the last point of harmonic patterns, point D, and also using Candle stick technical analyses are helpful for this purpose. At the end of this pattern usually form a Shooting Star candlestick pattern which shows that the buyers are not successful to reach higher goals and so they retreat.
2. In the below picture, the red horizontal line is drawn from a very important price support linewhich was a resistance level in the time of completion of the AB=CD pattern (because to the breaking of the line and passing of the price). End of AB=CD pattern is near to this line and gives hope to the sellers that it will block raising of the price.( remember that due to the variety of the brokers’ pricing data point D would touch this line in some of the brokers).
3. Among the reversal rations, Fibonacci 50 is one the most important reversal ratios to reform the price which usually forms in the charts. The end of AB=CD locates in level 50 of its previous descending trend, thus, the possibility of formation of a top for the price is twice.
Written by the analytic team of FXMIM Company
Attached File(s)
Similar threads
- Replies
- 0
- Views
- 1K
- Replies
- 22
- Views
- 8K
- Replies
- 27
- Views
- 27K