Technical Analysis Today

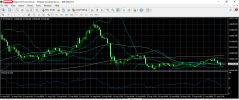
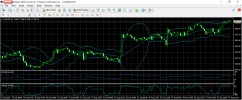
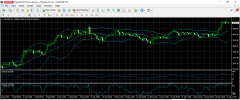
btcusd 14 8 2025 h1.png
Bitcoin moves near key resistance near its all-time high of $123,000

Bitcoin's price remains hovering near its all-time high of $123,000. The BTC/USD price on Wednesday, August 13, drew a bullish candle with a long body and short wick at the bottom of the candle. The price formed a high of 122966, a low of 118916, and a close of 122896 on FXOpen's platform. Some traders appear to be awaiting Bitcoin's breakout momentum, which could send the price rising to a new all-time high.

Fundamentally, Bitcoin currently enjoys positive market sentiment. Many analysts view 2025 as the post-halving year, which historically triggers significant price spikes. The total crypto market capitalization is currently reported to have reached $4 trillion.

Institutional adoption remains a key driver. Reports indicate significant interest from financial institutions in crypto ETFs such as Bitcoin and Ethereum. The BlackRock Bitcoin ETF (IBIT) launched by leading university Harvard University, demonstrates this trend. Strong fund flows into the Ethereum ETF (ETHA) also strongly indicate institutional interest.

Developments in crypto regulations in the US are also providing positive support for Bitcoin. President Trump's executive order to ease access to digital assets in retirement plans could open the door to significant capital inflows into the crypto market.

Technically, Bitcoin has recently hovered around its all-time high, despite a brief correction. Some analysts see technical patterns indicating a potential further breakout, possibly reaching $126,000 or even $130,000. Some Bitcoin miners, such as Sequans, have also reportedly increased their Bitcoin holdings.

Today, the market will focus on the release of US economic data, namely the Producer Price Index (PPI) and Jobless Claims. These data will provide clues about inflationary pressures and the state of the US labor market.

The Fed appears to have factored in the possibility of an interest rate cut. Statements from Fed officials, such as Barkin's speech today, will be closely watched for further clues regarding future monetary policy.

DXY sentiment remains generally weak, recently dropping to a two-week low. This decline may have been driven by market speculation about potential interest rate cuts and increased risk-on sentiment, which has driven investors to choose riskier assets, including crypto.
 
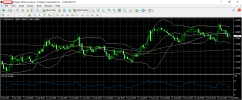
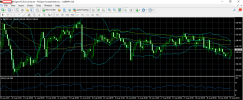
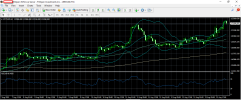
btcusd 18 8 2025 h1.png
Bitcoin price stabilizes around $117k, with upside potential still present

We witnessed a correction in the BTCUSD price after reaching a new all-time high above $124k. The price then fell to around $117k. This stable price movement within a narrow range occurred for four consecutive days, with movement near the middle band line.

Fundamentally, Bitcoin is currently in an interesting phase, with several key factors likely influencing its movement.

Market sentiment and institutional adoption remain the main drivers of Bitcoin price movements. Currently, the crypto market generally shows neutral to slightly bullish sentiment. The Fear and Greed Index is at 59, indicating the market is not experiencing excessive euphoria or panic. This is a healthy signal, as inflows into spot Bitcoin ETFs remain consistent, indicating continued interest from institutional investors.

Bitcoin recently experienced a correction following a disappointing US PPI report. This demonstrates that, despite its role as an independent asset, Bitcoin is still influenced by US macroeconomic data. Movements in the Fed's interest rate and the US dollar exchange rate remain important factors influencing Bitcoin's price movements.

Meanwhile, miner activity in August 2025 will influence BTC price movements due to the balance between miner sales and institutional inflows. If miners continue to sell BTC to cover operational costs, this could create selling pressure. However, if institutional demand is stronger, the potential for Bitcoin price increases remains open.

Overall, the long-term fundamental sentiment for BTCUSD remains positive, with some analysts predicting BTC could reach $150,000, even after hitting a record high above $124,000 in August.

Technically, the BTCUSD price movement is showing signs of consolidation, hovering around $117k-$118k, with support at $111k-$112k. Stronger support is around $108k.
 
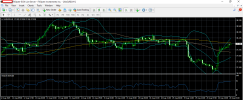
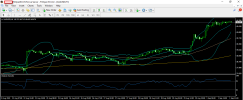
USDCAD 19 8 2025 H1.png
The Canadian dollar strengthened slightly ahead of the release of annual inflation (CPI) data.

Price movement on Monday was quite sluggish, with USD/CAD drawing a small bearish candle. The price formed a high of 1.38312, a low of 1.37829, and a close of 1.37987 on FXOpen's platform. Price movement was between the middle and upper band lines.

Canadian inflation (CPI) data for July reportedly fell to 1.9% from 2.0%. This decline in inflation could signal the Bank of Canada to continue monetary easing, potentially weakening the CAD. Today, according to the ForexFactory economic calendar, Canada will release annual CPI inflation data, which is expected to remain the same as the previous revision. Meanwhile, the monthly CPI is expected to rise higher than the previous revision.

The Fed is currently closely monitoring its policy direction. Moderate US inflation data in early August 2025 has raised market expectations for a Fed interest rate cut in September. However, the release of other inflation data, such as producer price data (PPI) that beats expectations, could dampen those expectations and provide support for the USD. Meanwhile, the Bank of Canada is expected to continue lowering interest rates throughout 2025. A faster pace of rate cuts by the BoC than the Fed could put downward pressure on the CAD and widen existing interest rate differentials.

The US stock market was sluggish as investors exercised caution ahead of the release of financial reports from several major retailers and the Federal Reserve's annual symposium in Jackson Hole. US public debt surpassed $37 trillion as of August 2025, which could pose a long-term risk to the US dollar. Despite expectations of interest rate cuts, the US dollar showed a modest recovery. The DXY, which measures the US dollar's performance against six major currencies, rose around 0.32% on August 18th, from a low of 97.775 to a high of 98.186. However, the DXY's rise remained below the 20-day moving average (EMA), indicating that the DXY's value remains bearish.

The CAD is known as a commodity currency, and its movements are sensitive to crude oil prices. A prolonged decline in crude oil prices could limit the CAD's upward momentum. Investors are currently adopting a wait-and-see approach or being cautious, ahead of important economic data and central bank meetings.

From a fundamental analysis perspective, USD/CAD is likely under bullish pressure, but this movement may be limited as the market awaits further economic data from central bank officials, particularly the Fed. Investors are advised to monitor the economic data to be released and the monetary policies of both countries.
 
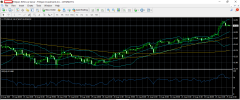
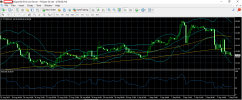
gold 20 8 2025 h1.png
Gold prices plummet due to geopolitical changes

Gold prices fell on Tuesday, August 19th, drawing a small-bodied bearish candlestick below the middle band line. Gold prices formed a high of 3345, a low of 3314, and a close of 3315 on FXOpen's platform.

Gold prices fell as Trump, Zelenskiy, and European leaders discussed possible negotiations with Russia. Geopolitical developments suggest that a positive outcome from US President Trump's meeting with Putin, Zelenskiy, and European leaders could end the ongoing war. Safe-haven demand declined as speculation about security guarantees for Kyiv fueled a potential end to the war.

Fundamentally, gold price movements are also influenced by the strength of the US dollar and market risk sentiment.

Traders will focus on the FOMC minutes, which will be released on August 21st, refers to the ForexFactory economic calendar. These minutes will provide further clues regarding Fed officials' views on the economic outlook, inflation, and, most importantly, the future direction of interest rate policy. If the minutes indicate a hawkish Fed stance, this will strengthen the US dollar. Conversely, if the minutes are dovish, the US dollar will weaken, supporting gold.

Gold is a non-yielding asset; rising interest rates make it less attractive to large investors who prefer bonds with higher yields. This tends to strengthen the USD, depressing gold prices. Conversely, if the US dollar weakens due to interest rate cuts, gold prices have the potential to strengthen.

The US-China trade war could influence market sentiment. Progress or delays in tariff negotiations could reduce uncertainty, prompting investors to choose riskier assets like stocks and avoid gold as a safe-haven. Conversely, escalating tensions could boost gold demand.

Investors will also be focused on developments in the Russia-Ukraine conflict, noting that any escalation or de-escalation could directly impact gold.

Gold movements are expected to be highly volatile, especially ahead of the release of the FOMC minutes. A bullish scenario would be if the FOMC minutes show a more dovish-than-expected Fed stance, and if there is an escalation in geopolitical and trade tensions, investors would potentially seek safe-haven assets. A bearish scenario would be if the FOMC minutes confirm a hawkish stance that supports the USD, and if improved risk sentiment in the market, for example, optimism regarding conflict resolution, could reduce gold's appeal.

Given the importance of Fed data, investors are currently likely to adopt a wait-and-see approach until the data is released. Market movements will depend on how the market responds to and interprets the Fed's signals.
 
silver 21 8 2025 h1.png
Silver Rebounds After Four Consecutive Days of Decline

Silver prices yesterday drew a bullish candle with a long body and a relatively long wick at the bottom of the candle. Silver formed a high of 37,937, a low of 36,954, and a close of 37,889. Silver prices rebounded after touching the lower band line.

Fundamental factors that could influence the current silver price include US monetary policy, global market sentiment, and industrial demand.

The Fed's monetary policy report indicated that they are in no rush to cut interest rates. A prolonged high-interest-rate scenario tends to strengthen the USD and is a negative factor for silver. The DXY, which measures the US dollar against six major currencies, is currently at 98.227, down slightly by 0.06% but has successfully crossed the 20-day moving average (EMA) from the downside.

High interest rates make non-yielding silver less attractive, with investors preferring yield-bearing assets such as US Treasuries, which in turn strengthens the USD.

From a geopolitical perspective, geopolitical uncertainty and trade wars, such as the one between China and the US, can increase the potential demand for safe-haven assets like silver, potentially curbing price declines. Although silver is not considered a major safe-haven asset like gold, it still benefits from global uncertainty due to investor demand for non-flat assets.

Significant industrial demand, particularly in technology sectors such as solar panels, electric cars, and electronics, is present. Slowing global economic growth prospects could reduce demand in these industries, which in turn pressures silver prices. Silver prices often move in tandem with gold; rising gold prices can support silver.

From a fundamental perspective, there appears to be a tug-of-war between factors that pressure and support silver prices. Geopolitical concerns and potential safe-haven demand support silver, but the Fed's hawkish stance tends to suppress silver prices. The strengthening of the USD, although slightly weakened, still offers upside potential.

The probability of an interest cut rate, according to the CME Group's Fedwatch tool, currently indicates an 81.0% chance of a Fed rate cut at its September meeting.
 
BTCUSD 25 8 2025 H1.png
Bitcoin plummets due to uncertainty surrounding Powell's speech at the Jackson Hole Symposium

Bitcoin experienced a significant correction from a high of around $124k, dropping by approximately 7% to its current level of around $113k. This decline was driven by uncertainty surrounding Fed Chairman Jerome Powell's speech at the Jackson Hole Symposium. Uncertainty about the direction of monetary policy, including the possibility of an interest rate cut, was a major factor in Bitcoin's recent decline.

Yesterday, Bitcoin drew a long-bodied bearish candle with almost no shadow. The price formed a high of $115,636, a low of $111,126, and a close of $112,726 on FXOpen's trading platform. This was a fairly deep decline from the middle band to the lower band line.

In terms of institutional investor funds, there was an outflow of nearly $1 billion from Bitcoin and Ethereum ETFs, but the total funds remaining in crypto funds remained at their highest levels, indicating strong institutional investor confidence. This support is reinforced by the presence of numerous spot Bitcoin ETFs since January 2024, as well as the accumulation of over $100 billion in assets, particularly from major players like BlackRock and Harvard University.

VanEck's prediction even predicts that BTC could reach $180,000 by the end of 2025, driven by growing institutional investment and favorable macroeconomic conditions. Bitwise analysts also project a BTC target range of $180k-$250k thanks to a combination of limited supply and high institutional demand.

Despite a correction leading up to July, Bitcoin quickly recovered and eventually reached an all-time high above $124k in August, demonstrating strong demand and solid buying liquidity.

Regarding crypto regulation, in March 2025, President Trump signed an executive order establishing a Strategic Bitcoin Reserve at the federal level, making BTC a strategic reserve asset, with the government holding an estimated 200,000 BTC. Texas even followed suit by establishing the Texas Strategic Bitcoin Reserve, signaling the growing adoption and legitimacy of BTC.

BTCUSD is expected to see a slight correction today, especially if Powell's speech at Jackson Hole negates expectations of an interest rate cut. Meanwhile, institutional support and strong on-chain trends are expected to provide the basis for a medium-term rebound.
 
WTI 26 8 2025 H1.png
WTI oil prices rise for a fourth straight day after a prolonged decline

WTI oil prices rose on Monday, drawing a bullish candlestick, extending the previous rally. The price formed a high of 64.87, a low of 63.35, and a close of 64.55 near the middle band on the daily timeframe refers to FXOpen's trading platform.

The rise in oil prices, following the previous week's prolonged decline, appears to be driven by market expectations of lower interest rates in the United States, which have boosted hopes for higher demand.

When analyzing crude oil prices, important factors depend on the dynamics of global supply and demand. In this regard, major oil-producing countries, OPEC+, the US, and Russia, play a role in maintaining oil supply, while China and the US often serve as benchmarks for global oil demand.

Furthermore, traders also pay attention to the performance of the USD. When the USD strengthens, oil prices tend to fall because oil becomes more expensive for holders of other currencies. Conversely, a weakening USD can push oil prices up.

Today's fundamental factor that traders may be paying attention to is the US oil inventory report. According to the latest data from the American Petroleum Institute (API), US oil inventories fell by 2.4 million barrels in the week ending August 15, 2025. This decrease exceeded analysts' expectations, which had projected a smaller decrease. Energy Information Administration (EIA) data is usually released on Wednesdays. If the EIA confirms a decline in inventories, this could be bullish for oil prices, indicating strong demand and tight supply in the US.

The Russia-Ukraine conflict remains a major topic driving oil price trends. The recent attack on Russian energy infrastructure by Ukraine could increase supply uncertainty and could push prices up.

Investors will also be paying attention to OPEC+'s policy to increase or cut production, which could significantly impact oil price fluctuations. However, concerns about a global recession and economic slowdown could hamper demand and depress oil prices. Conversely, strong economic data from major consumers like China and the US could support oil prices.

Bullish support today includes US inventory data showing a larger-than-expected decline, indicating that US demand remains strong. An escalation of the Russia-Ukraine war could create a risk premium on oil prices. Market expectations of potential Fed policy easing could pressure the US dollar, which fundamentally supports oil prices.

Conversely, bearish support is seen in US economic data showing strong resilience, triggering a strengthening USD, which could pressure oil prices. Alternatively, broader macroeconomic concerns about global growth could limit price gains.
 
gold 28 8 2025 h1.png
Gold prices held near $3,400 as Fed rate cut bets hinge on data.

Gold prices held steady on Wednesday, although the US dollar recovered from earlier losses triggered by threats to the Fed's independence. Gold traded with a bullish candle, forming a high of $3,398 and a low of $3,373, closing at $3,396, according to FXOpen's trading platform.

Gold prices (XAU/USD) in 2025 are generally in a significant uptrend, even nearly reaching a record high of $3,400 per troy ounce. Current market sentiment is bullish, pointing to price increases, although there is a potential for a short-term correction. Many analysts project gold prices to continue rising through the end of 2025 and even into 2026.

The Fed's monetary policy remains a key focus for gold. Fed Chairman Jerome Powell's speech at the Jackson Hole symposium hinted at a looser policy. However, a Fed official, New York Fed President John Williams, said that interest rates could be lowered at some point but emphasized that only data would indicate whether a rate cut was appropriate, based on economic performance.

The Fed's next meeting is scheduled for September 16-17. Leading up to that date, there will be another jobs report, as well as two inflation reports—the Personal Consumption Expenditures (PCE) Price Index for July and the Consumer Price Index (CPI) for August—before the Federal Open Market Committee (FOMC) gathers for its sixth meeting of the year.

The implications of a Fed rate cut could drive up the price of non-yielding gold by lowering the opportunity cost of holding non-yielding assets like gold.

Weaker US economic data and forecasts could strengthen the argument that the Fed has reason to loosen monetary policy to support economic growth. This could provide positive support for gold. Several economic data releases today will be in focus for traders, such as preliminary GDP, unemployment claims, and home sales, which could provide subtle clues about the US economy.

Prolonged geopolitical conflicts, such as those in the Middle East, and political situations in the US, such as the issue of the dismissal of the Fed chairman, could increase demand for safe-haven assets like gold, which is traditionally considered a hedge.

Gold purchases by global central banks continue. Their actions to diversify foreign exchange reserves and reduce dependence on the US dollar are strong pillars supporting gold prices.

On the other hand, global inflation remains a concern. Although US inflation has shown a decline, concerns about global inflation persist. Gold is often considered a hedge against inflation.

Today, market attention will focus on US economic data, particularly the PCE and revised GDP. The PCE index is an inflation indicator closely monitored by the Fed. If PCE data shows a decline, expectations of interest rate cuts strengthen. Revised GDP data provide a snapshot of the US economy; weaker data support the argument for monetary policy easing and support gold prices.
 
GBPJPY 29 8 2025 H1.png
GBP/JPY moves within the mean, becoming a consolidation zone.

The GBP/JPY cross currency pair yesterday drew a bearish candle with a small body and a short shadow at the top of the candle. The price formed a high of 199.391, a low of 198.391, and a close of 198.515 on FXOpen's trading platform. The current price movement is near the middle band line, which acts as the "mean" of the average price movement, with deviations from the upper and lower bands being quite wide. The price often returns to the mean after deviations and often consolidates in this area.

From a fundamental analysis perspective, factors driving this pair include global risk sentiment and differences in monetary policy. The JPY is traditionally a safe-haven currency. When market risk increases due to geopolitical tensions, recession, or financial market turmoil, investors tend to shift to the JPY, causing it to strengthen. Conversely, when risk sentiment is positive, investors shift to riskier assets such as stocks, which can put pressure on the JPY due to currency selling.

The GBP/JPY is also sensitive to the monetary policies of both central banks, namely the Bank of England (BoE) and the Bank of Japan (BoJ). The BoE tends to adopt an aggressive policy in addressing inflation. If the Bank of England hints at a further interest rate hike or maintains its current policy, this could support GBP appreciation. On the other hand, the BoJ continues to maintain its ultra-loose monetary policy. If the BoJ hints at a rate hike or an end to its loose policy, this could support JPY appreciation. Conversely, if their dovish stance persists, the JPY is likely to be under pressure.

Based on available economic data, the latest UK inflation rate indicates retail prices reached their highest level in August 2025. This could signal the BoE to maintain its hawkish stance or even consider further tightening to control inflation.

YoY car production data for July was reported at -6.5%, better than the previous forecast of -12.0%. While this is a specific piece of data, a better-than-expected reading may support GBP appreciation, suggesting some economic sectors may be performing better than feared.

Meanwhile, the Bank of Japan (BoJ) continues to monitor the Japanese economy. Rumors and speculation abound about the possibility of a BoJ interest rate hike. Any comments from BoJ officials pointing to tightening could support the Japanese yen. Retail sales data for July were reported at 1.0% month-on-month, significantly better than the previously estimated 0.3%. This figure indicates an increase in Japanese consumer spending, which could support the yen as it reflects improving domestic economic conditions.

The balanced fundamentals of the GBP/JPY pair mean traders will be cautious and await confirmation of the market's reaction to new economic data and overall market sentiment. If the market shows a clear risk-on sentiment, traders may prefer to buy positions targeting the nearest resistance. Conversely, if market sentiment tends to be risk-off, traders may prefer to sell positions targeting the nearest support.
 
gold 1 9 2025 h1.png
Gold Prices Optimistic Amid Dovish Fed Signals

Gold prices rose on Friday, drawing a bullish candle, extending their consecutive gains from the previous few days. On Friday, gold prices formed a high of 3453, a low of 3404, and a close of 3447 on FXOpen's platform. Gold's rise crossed the upper band line, which had previously served as a solid resistance level.

Gold's strong bullish trend has shown a significant upward trend throughout August 2025, with gold prices rising sharply, recording its best monthly performance since April. Analysts generally predict this bullish trend will continue, with several ambitious price targets set until the end of 2025.

The main sentiment driving the gold price increase is growing market expectations that the Fed will cut its benchmark interest rate. The likelihood of a rate cut at the FOMC meeting in September 2025 is estimated to be very high, supported by weakening inflation and labor market data.

The Fed's looser monetary policy tends to depreciate the US dollar. A weaker US dollar makes dollar-denominated gold cheaper for buyers using other currencies, increasing its appeal. Throughout August 2025, the US dollar recorded its worst monthly decline in recent months.

Geopolitical risks, such as tensions in the United States, have also increased investor interest in gold as a safe haven.

Technically, gold prices have successfully broken out of their previous channel, exhibiting strong bullish momentum, which indicates potential for continued upside. Some analysts are targeting prices around $3,433 and $3,486. Other medium-term analysts project targets around $3,500 and even $3,600 per troy ounce in the second half of 2025. Strong support levels have formed around $3,410 and $3,412. Although some analysts are bullish, they should be wary of a potential retracement before prices resume their momentum.

Today, banks in Canada and the US will be closed in observance of Labor Day, which has the potential to reduce market volumes.
 
SILVER 2 9 2025 H1.png
Silver prices surge to record highs for 2025

Silver prices showed significant movement on Monday. They drew a long-bodied bullish candle with almost no shadows. This extended the previous rally since late August 2025. Silver prices formed a high of 40,753, a low of 39,531, and a close of 40,701 on FXOpen's trading platform.

The main driver of silver prices is that this asset is often considered a safe haven during times of economic uncertainty and geopolitical turmoil. Reports indicate ongoing geopolitical turmoil, which supports bullish sentiment toward precious metals, including silver.

Furthermore, silver production does not always keep pace with industrial demand, thus supporting price increases. Silver, besides being a safe-haven investment asset, also serves a dual purpose as an industrial raw material, particularly for solar panels, electronics, and electric vehicles. Stable or high demand without sufficient production will drive prices up.

The weakening US dollar is also a focus for traders. The US dollar index is currently weakening. One reason for this weakening is expectations that the Fed will cut interest rates in September 2025. Lower interest rates reduce the USD's attractiveness, and investors are tending to choose other assets, including silver.

Recent US economic data has shown mixed signals. US GDP reportedly grew in the second quarter, which could support the USD. However, the market will be more focused on upcoming data such as the Non-Farm Payrolls report and the manufacturing Purchasing Managers' Index (PMI) data, which could provide further clues regarding the Fed's policy direction.

The Fed is currently awaiting economic data to decide its next move. While there are strong expectations for an interest rate cut, any stronger-than-expected economic data could delay that plan, potentially strengthening the USD and pressuring silver prices.

Current market sentiment is bullish, and silver has recorded significant price increases, reaching record highs throughout 2025. In recent sessions, silver prices have broken through key levels and finally reached a 14-year high. However, the risk of a pullback remains, with the RSI indicator currently showing overbought levels, indicating potential for short-term consolidation or a pullback.

Traders' focus going forward will be on US economic data, particularly the Non-Farm Payrolls (NFP) report, which will be released on September 5th. Weaker data will further strengthen expectations of a Fed rate cut, which could support silver prices. Conversely, stronger-than-expected data could strengthen the USD and depress silver prices.
 
WTI 4 9 2025 H1.png
WTI oil prices corrected after failing to break through the MA50.

The price of WTI (World Texas Intermediate) oil on Wednesday drew a long-bodied bearish candle with almost no shadow. Oil prices depreciated after failing to break through the 50-day moving average (MA50), which acted as a dynamic resistance level. Oil prices reached a high of 65.35, a low of 63.55, and closed at 63.58, according to FXOpen's trading platform.

The oil price plunge was influenced by various factors, including economic strengths and weaknesses, geopolitical events that can impact oil supply and demand, and the role of OPEC+, a key pillar in global oil distribution.

OPEC+, the Organization of the Petroleum Exporting Countries and its allies, recently agreed to increase oil production. This decision, effective in September, could put downward pressure on oil prices by increasing supply in the global market. OPEC+ is scheduled to meet on September 7, 2025. Speculation regarding the outcome of this meeting could cause price volatility. Some analysts expect OPEC+ to maintain its voluntary production cuts, particularly from Saudi Arabia and Russia, while awaiting clearer demand data after the US summer holiday season. If OPEC+ chooses to withhold supply, this could support oil prices; conversely, if they decide to increase production further, oil prices could potentially fall.

From a geopolitical perspective, US sanctions against entities involved in oil shipping, particularly those linked to Iran, could impact global supply. The market reacted by strengthening oil prices due to concerns that supplies from non-sanctioned sources would become increasingly limited. Elsewhere, ongoing Russia-Ukraine tensions, including the potential for sanctions escalation, continue to be a major geopolitical risk factor. These tensions could disrupt the supply chain and push oil prices up due to increased risk premiums.

Another focus is on economic and inventory data. The EIA (U.S. Energy Information Administration) report is often a key driver of oil prices. The upcoming weekly release of crude oil inventory data on September 5th is crucial. If the data shows an increase in inventories, it indicates weak demand and could depress oil prices. Conversely, a decrease in inventories indicates strong demand and supports oil prices.

After the summer holiday season ends, there are usually concerns about a decline in gasoline demand. This could be a factor that puts downward pressure on oil prices, although inventory data will provide clearer confirmation.

Oil prices are also inversely correlated with the USD. Oil prices traded in US dollars tend to trade inversely. If the US dollar weakens, oil prices tend to rise. Conversely, if the USD strengthens, oil prices tend to weaken. This movement in the US dollar can influence the XTI/USD movement.

Today, oil prices are likely to be highly dependent on sentiment ahead of the OPEC+ meeting later this week and the release of relevant US economic data.
 
USDCAD 5 9 2025 H1.png
The Canadian Dollar Weakens as the US Dollar Strengthens

The USD/CAD currency pair has trended bullish for five consecutive days, indicating the Canadian dollar's weakness against the US dollar. On Thursday, the USD/CAD price drew a long-bodied bullish candle with a relatively long shadow at the top of the candle. This reflects a significant increase accompanied by sizable retreats. The price formed a high of 1.38454, a low of 1.37880, and a close of 1.38174 on FXOpen's trading platform.

In today's trading, there are several key factors to pay attention to, particularly the release of important economic data from the United States and Canada. The main fundamental factors that could influence the USD/CAD today are the US and Canadian employment reports and crude oil prices.

The US Non-Farm Payrolls (NFP) employment report is a key data item to watch. The NFP is one of the most important economic data releases from the US and can cause high volatility in the market, especially for the US dollar. This report provides insight into the health of the US labor market. Stronger-than-expected NFP data could support a stronger US dollar, as healthy economic signals could prompt the Fed to maintain or raise interest rates. Conversely, weaker-than-expected data could pressure the USD, leading to a weakening dollar, as concerns about an economic slowdown could prompt the Fed to cut interest rates.

The market forecast for the August 2025 Non-farm Payrolls (NFP) is for 75K jobs to be added, although the previous estimate was 73k. This data will be the final indicator before the Fed makes its next interest rate decision, making it highly impactful.

Canada will also release employment data today, including the unemployment rate, employment change, and wage data. This data will provide insight into the state of the Canadian economy, and the market will compare it with US economic data. If Canadian employment data is better than expected, for example, unemployment falls and job gains rise, the Canadian dollar could strengthen. Conversely, disappointing data could weaken the Canadian Dollar (CAD).

The Canadian dollar is a commodity currency that is often correlated with crude oil prices. Because Canada is a major oil exporter, rising oil prices can support the Canadian dollar, while falling oil prices can pressure the CAD. Recent reports indicate a weakening trend in global oil prices, which could put negative pressure on the CAD.

Today's bullish scenario, based on the driving factors, is if the US NFP data is stronger than market expectations, while Canadian employment data is weak. This scenario will strengthen the US dollar and weaken the CAD, which has the potential for the USD/CAD pair to rise.

A bearish scenario arises from a driving factor: if the US NFP data disappoints, while the Canadian employment data shows strong results, this scenario will weaken the US dollar and strengthen the Canadian dollar, potentially leading to a decline in the USD/CAD pair.
 
USDJPY 8 9 2025 H1.png
USD/JPY gapped at the opening market.

On Friday, the US dollar and Japanese yen currency pair formed a long bearish candle with a wick below the candle. The price formed a high of 148.515, a low of 146.818, and a close of 147.387 on FXOpen's trading platform. Today, Monday, September 8, 2025, the USD/JPY open price is well above Friday's closing price, with the USD/JPY opening at 148.077.

Factors influencing market sentiment include recent data, which indicates weak US employment. The latest Non-Farm Payrolls (NFP) report showed job gains that fell short of market expectations. This figure reinforces the signal that the US labor market is slowing. Market implications of weaker-than-expected data will increase speculation that the Fed will cut its benchmark interest rate soon, at its September meeting. Lower interest rates are less attractive to investors for the USD and support the strengthening of the JPY.

Inflation data due this week will be a major focus. While concerns about inflation persist, the market appears to be more influenced by signs of economic slowdown, as evidenced by employment data. If inflation data shows a decline, or at least no significant increase, this would further confirm speculation about a Fed interest rate cut and potentially put further pressure on the USD.

The slight correction on Wall Street suggests investors are weighing economic concerns against optimism about a rate cut. The weakening of the US dollar against major currencies, including the Japanese yen, reflects this shift in sentiment.

The Japanese yen is traditionally considered a safe-haven currency. Amid concerns about global fiscal instability and a US economic slowdown, investors tend to shift to safer assets, including the Japanese yen. Increased demand for the yen as a safe-haven has boosted the currency, particularly against the depressed US dollar.

In Japan, despite political uncertainty surrounding the resignation of the ruling party, which could impact the Prime Minister, the market appears to have reacted less to this news. Market focus is more on global economic data and key monetary policies, compared to Japan's domestic political turmoil, which has not significantly affected current currency movements.

The BoJ has previously indicated its intention to continue gradual monetary tightening. Recent statements from BoJ officials indicate that the central bank is monitoring economic growth and exchange rate movements. The BoJ's current policy pause and the possibility of further interest rate hikes in the future provide structural support for the yen. This contrasts with the Fed's expected rate cuts.

Based on recent data, USD/JPY movement tends to be under pressure from the US dollar. The USD's weakening was driven by expectations of a Fed rate cut following disappointing employment data. Meanwhile, the Japanese yen is supported by its status as a safe-haven currency amid global uncertainty and the BoJ's policy, which still signals future monetary tightening.
 
nzdusd 9 9 2025 h1.png
NZD/USD Strengthens Amid USD Weakness

The NZD/USD pair rose for two consecutive days amid a weakening US dollar amid growing expectations of a Fed interest rate cut. Furthermore, strong trade balance figures from China, New Zealand's main trading partner, supported the NZD's strength.

Yesterday, the NZD/USD pair drew a long-bodied bullish candle with a slight shadow at the bottom side, successfully crossing the middle band line and approaching the 50-day moving average (MA). The NZD/USD price formed a high of 0.59454, a low of 0.58710, and a close of 0.59397, according to the FXOpen platform.

Fundamentally, the NZD/USD pair's price movement is influenced by economic data released from New Zealand and the US, as well as overall market sentiment. The latest information from the Reserve Bank of New Zealand (RBNZ) has maintained its benchmark interest rate (OCR) at 3.25%. However, the central bank still maintains a dovish bias, which could allow the RBNZ to consider future interest rate cuts.

New Zealand's economic performance shows signs of recovery, supported by high export prices and lower interest rates. However, there are concerns that this recovery could slow due to global policy uncertainty and tariff issues.

New Zealand's economic data today is of particular interest to traders, with the upcoming Bill Auction, an auction of 1-year, 3-month, and 6-month Treasury notes to be released, providing insight into investor sentiment toward New Zealand government debt. First-quarter 2025 employment data showed minimal growth and a stable unemployment rate, but near its highest level in 4-5 years. Meanwhile, annual inflation rose above market consensus. The Reserve Bank of New Zealand expects core inflation to remain high.

Concerning factors from the United States, market sentiment toward the USD is currently bearish as the market bets on the possibility of a Fed interest rate cut. Recent US employment data reinforces this expectation, although upcoming inflation data will be crucial.

Today's US economic data likely to be of interest to traders is the NFIB Small Business Optimism Index, which provides insight into the health of the small business sector in the US. Weaker results could raise concerns about an economic slowdown and put further pressure on the USD.

The quarterly retail trade financial report, released by the US Census Bureau, will provide an overview of the retail sector economy.

Although both central banks, the RBNZ and the Fed, are currently exhibiting a dovish bias, the current narrative focuses more on expectations of a Fed interest rate cut. If global market sentiment tends to be risk-on (investors prefer riskier assets), the NZD, as a commodity currency, could tend to strengthen. Conversely, if market sentiment tends to be risk-off (investors turn to safe assets), the USD could strengthen.
 
gold 10 9 2025 h1.png
Gold Hits New Record High of $3,674 per troy ounce

Gold prices have again set a new all-time high for 2025. Yesterday, Tuesday, gold prices rose to a high of $3,674 at the start of the American session. This increase was in line with news indicating that Israel launched an attack on Qatar, targeting Hamas leaders, including Khalil Al-Hayya and Zaher Jabarin.

On Tuesday, gold prices drew a bearish candle with a wick at the top of the candle, indicating a downward movement after reaching an all-time high and closing lower. Gold formed a high of 3,674, a low of 3,625, and a close of 3,626 on FXOpen's platform.

Based on fundamental analysis, gold's rise was primarily driven by rising market expectations of a Fed interest rate cut, likely to begin this September. According to the CME Group's FedWatch tool, the Fed is expected to cut rates by 25 basis points with a 92.7% probability at its September 17 meeting.

The impact of the Fed's looser policies has made the yields on dollar-based assets such as bonds less attractive. As a result, investors have shifted to safe-haven assets like gold, which offers no yield but serves as a hedge against inflation and global economic uncertainty. The weakening USD has increased the appeal of gold because it is priced in dollars.

US economic data, such as weak NFP figures, have fueled concerns about a potential economic slowdown. Furthermore, uncertain geopolitical conditions have also driven demand for safe-haven assets like gold.

Another factor supporting gold is the strong and sustained demand from central banks. Global central banks continue to increase their gold reserves as a diversification from fixed currencies, especially the US dollar. These purchases create solid physical demand in the market, providing strong support for gold prices from a fundamental perspective.

The gold price outlook for the next few years is expected to be very positive, with several factors supporting this outlook:

Continued monetary easing. Many analysts, including those from major institutions like JP Morgan and Goldman Sachs, project gold prices could reach $4,250 by 2026. The reason is that the Fed has truly begun its cycle of interest rate cuts and monetary policy loosening, which will continue to put pressure on the USD and increase gold's appeal. This situation could persist for the next few years, providing conducive support for gold prices to rise.

Persistent inflation. Many economists believe that inflation will remain a global issue in the long term. Gold is known as an effective hedge against inflation. If inflation continues to rise or remains high in various countries, investors will continue to hoard gold to protect the purchasing power of their assets.

Global geopolitical and economic tensions. Geopolitical risks due to war, particularly in the Middle East, show no signs of abating. If this continues for the next few years, it could support gold prices as a safe haven asset amid geopolitical tensions and global economic uncertainty.

Gold price predictions for 2027-2030: Some analysts even predict a significant increase, projected to reach a range of $4,812-$6,546. This long-term projection is based on the assumption that gold will continue to be a highly valuable asset amidst the changing global economic and political landscape.

Today, market participants will turn their attention to inflation data in the United States (US). The country will release the Producer Price Index (PPI) for August and the Consumer Price Index (CPI) for the same month on Thursday. Inflation data will receive extra attention after disappointing employment figures and ahead of the Federal Reserve's (The Fed) monetary policy announcement next week.
 
Last edited:
eurusd 12 92025 h1.png
Oil prices plummet after the US releases CPI data

The XTI/USD price movement on Thursday drew a long-bodied bearish candle with almost no shadow. WTI oil prices fell from a high of 63.47 to a low of 61.97 and closed at 62.00 on FXOpen's trading platform. The downward movement in oil prices ended the previous three-day winning streak.

The decline in oil prices coincided with the release of disappointing US inflation and jobless claims data. The U.S. Bureau of Labor Statistics reported a core CPI of 0.3%, meeting expectations. The monthly CPI rose 0.4%, higher than the previous month's 0.3%. The annual CPI was 2.9%. US jobless claims rose to 263,000, up from the forecast of 235,000. This higher data fueled expectations of a Fed rate cut to boost the labor market.

Another fundamental report that draws attention to the dynamics of oil supply and demand is the US oil inventory report from the American Petroleum Institute (API) and the U.S. Energy Information Administration (EIA). This can be a key driver of supply and demand indicators. Based on the latest available data, dated August 8, 2025, US crude oil inventories increased more than expected. This increase in inventories could theoretically exert downward pressure on oil prices, indicating a supply surplus. However, the market will be paying close attention to the subsequent EIA report, which may show a different figure. The market can be highly sensitive to this data.

The market is also anticipating seasonal demand; reports indicate that the market is anticipating the end of the summer "driving season" in the United States. This often leads to expectations of reduced gasoline demand and can put downward pressure on oil prices.

Geopolitical conflicts are also in focus. Market sentiment is influenced by the Russia-Ukraine war. News of a potential meeting between US and Russian leaders to discuss a ceasefire could raise hopes for a resolution to the conflict, potentially lifting sanctions on Russian oil supplies, which could increase global supply and depress oil prices. However, a possible escalation of the war after Poland opened the floodgates to Russia's war with NATO could push up oil prices.

The US tariff policy, which postponed new tariffs with China, has provided positive market sentiment. A trade deal or ceasefire in the tariff war could boost the global economy, which in turn could boost oil demand.

OPEC+ has announced the release of significant production cuts, including an additional 547 kb/d for September, accelerating the return of supply to the market. Non-OPEC producers are also increasing output, significantly increasing global supply.

Demand growth in China, Brazil, India, and several other developing countries has fallen short of expectations, indicating a demand slowdown. Consumption in the OECD region has remained relatively flat, indicating that growth in developed economies cannot withstand the burden of the connection if external factors are unfavorable.

In the short term, there is potential for downward pressure on oil prices, particularly if output increases and inventories increase, and economic data from major economies shows weakness.

In the medium to long term, despite an inventory overhang and strong demand, geopolitical factors and OPEC+ production policies could still trigger upside if there are supply disruptions and policy changes.
 
BTCUSD 15 9 2025 H1.png
BTC/USD Analysis, September 15, 2025

Bitcoin's price movement for three consecutive days has tended to remain within a narrow range, reluctant to extend the previous three days' gains. On Sunday, BTCUSD drew a small bullish candle, resembling a Doji candle, indicating an indecisive market. The price formed a high of 116224, a low of 115237, and a close of 115793. This price movement is near the upper band line.

BTC's price movement is heavily influenced by market sentiment, global macroeconomic news, regulatory developments, and Bitcoin's own fundamental factors.

Historically, September is known as "Red September" because Bitcoin tends to experience corrections. However, data shows that in September 2025, this sentiment was less affected, and Bitcoin's price reportedly experienced a fairly stable upward trend.

Institutional adoption appears to be continuing to increase, particularly from spot Bitcoin ETFs, which have reportedly absorbed significant liquidity ($50 billion by July 2025). Furthermore, accumulation activity by large investors, often referred to as "whales," has reached a new record, indicating potential buybacks if market momentum rebounds.

Expectations of a Fed interest rate cut this week have created positive macroeconomic sentiment. Risk-on sentiment is created because these expectations could weaken the USD. This condition has historically benefited high-risk assets like Bitcoin.

The market is awaiting the Fed's interest rate decision this week. US inflation data that met expectations and a surge in unemployment rates have sparked signals of looser policy, which is a positive factor for Bitcoin.

The rise in gold prices and the weakening of the USD are due to the potential for a Fed interest rate cut. Gold and Bitcoin are often considered hedge assets, so a rise in gold can be a positive indicator for similar assets like Bitcoin. Although sometimes, when gold prices rise, Bitcoin prices correct, indicating a pattern of capital flows in the adoption of both.

Geopolitical risks. The ongoing Ukraine-Russia war, along with tensions in the Middle East, has impacted global oil prices and raised concerns about France's credit rating, indicating global economic uncertainty. Amid this uncertainty, alternative assets like Bitcoin are often sought by investors as a safe haven.

Crypto events in September 2025 are filled with various important events, such as Bitcoin Week Bali and ETHTokyo. These events can boost positive sentiment, encourage adoption, and trigger price volatility due to new project announcements or regulatory discussions.

Several symposia, including one in London, discussed pro-crypto regulations that could stimulate institutional capital inflows. Clear and positive regulatory developments are always a strong fundamental factor for the future of crypto.

In conclusion, Bitcoin currently has a fairly strong foundation. Positive factors such as increasing institutional adoption, whale accumulation, expectations of a Fed rate cut, and risk-on sentiment in global markets could drive price increases.

However, caution should be exercised regarding volatility triggered by macroeconomic announcements and geopolitical changes, as well as the volatile nature of the crypto market itself. So crypto investments are speculative.
 
gold 16 9 2025 h1.png
Gold's unstoppable movement hits a new all-time high again

Gold prices appeared to rise significantly during Monday's trading session, again hitting a new all-time high for the 2025 price movement. Gold prices drew a long-bodied bullish candle with almost no shadows. Gold prices reached a high of $ 3,685, a low of $ 3,626, and closed at $ 3,678 on FXOpen's platform. Gold prices are targeting $ 3,700 per troy ounce.

There are several key fundamental drivers of the gold price increase. Market expectations for a 25 basis point Fed rate cut at the FOMC monetary policy meeting on September 6-17 have increased demand for gold and supported the rally. The US dollar has also tended to weaken, making gold more attractive to holders of other currencies. US Treasury yields, especially long-term ones, have also reportedly fallen in recent times, further supporting gold.

The US economy is in a mixed state, with inflation remaining quite high, particularly in the housing and energy sectors. The labor market is showing some weakness, with jobless claims rising. These data strengthen the argument that the Fed will adopt a more lenient policy stance going forward. However, persistently high inflation remains a risk, suggesting the Fed will be cautious in easing interest rates.

Global central banks in several countries are reportedly still actively buying gold to increase reserves as a hedge against economic and geopolitical uncertainty. Amidst the risks of economic and geopolitical uncertainty, gold is still considered a safe-haven asset. It appears that market expectations for an interest rate cut are currently quite high, causing investors to buy gold on rumors and may sell after the official decision. This calls for caution.

Several analysts project a more optimistic long-term gold price outlook. Goldman Sachs and UBS both have optimistic projections for gold prices for the remainder of 2025 and into 2026. Some projections suggest the potential for gold to break through the $3,700 level in the near future and even reach $3,900-$4,000 per troy oz by the end of the year or mid-2026.

Fundamentally, sentiment towards the XAU/USD gold price is currently bullish. The prospect of a Fed rate cut, supported by weaker US economic data, is a key driver. Gold is also considered a safe-haven asset amidst global economic uncertainty and demand from central banks.

However, risks remain. Traders need to monitor the official FOMC announcement, with the content of the dot-lot statement and forward guidance crucial. Movements in US bond yields, if yields rise sharply, could pressure gold prices. Unexpected geopolitical changes, or political or fiscal pressure on the Fed, could impact market confidence. Alternatively, a situation that causes the US dollar to rise again could be a headwind for gold.

Price movements are expected to increase leading up to and after the Fed's interest rate announcement, depending on data releases and the Fed's statement at the upcoming monetary policy meeting.
 
GBPUSD 18 9 2025 H1.png
GBP/USD hovers near the upper band after the Fed's interest rate cut

The market responded to the Fed's decision to cut interest rates by 25 basis points to a range of 4.00%-4.25%. The GBP/USD price briefly rose sharply, crossing the upper band at 1.37299. However, shortly after, the price plummeted to 1.36247, then fluctuated and closed at 1.36252. Yesterday, the GBP/USD price finally drew a bearish candle with a long wick at the top of the candle. This indicates that after strong upward pressure, substantial selling pressure pushed the price down, and it closed lower than the opening price.

The Fed finally decided to cut interest rates, marking the first cut this year, in line with market expectations. The cut was made in response to a weakening US labor market, with the unemployment rate rising to 4.3% in August 2025, its highest level in four years. The Fed has indicated that there will be two more interest rate cuts this year. Fed officials' median view for the final interest rate in 2025 is 3.6%. This indicates the Fed is adopting a more dovish stance, leaning toward easing policy.

Today, September 18, 2025, the Bank of England (BoE) is scheduled to announce its interest rate. Market consensus projects the BoE will maintain its benchmark interest rate at 4.00%. In August, the BoE cut interest rates from 4.25% to 4.00%. However, UK inflation remains high at 3.8% in August 2025, the highest among developed economies. This situation places the BoE in a difficult position. They must balance supporting economic growth and controlling persistently high inflation. With persistent inflation, the BoE is likely to adopt a hawkish stance, tending to tighten monetary policy compared to the Fed, although it may not raise interest rates today.

A current factor supporting the pound is that the BoE is expected to maintain interest rates at 4.00%. The BoE's more hawkish stance compared to the Fed could make the pound more attractive to investors seeking higher yields. On the other hand, the Fed has officially lowered interest rates and hinted at further cuts. This more dovish stance could reduce the attractiveness of the USD. The weakness of the US labor market also provided negative sentiment for the USD.

Although theoretically, fundamental analysis points to GBP strengthening and USD weakening, the market may look different as increased volatility could produce short-term surprises that may not align with theoretical conclusions. Risk anticipation is absolutely necessary in volatile market dynamics. It's worth noting that today, in addition to the Bank of England's interest rate announcement, the US will also release jobless claims data. Market expectations are that jobless claims are projected to fall to 241k from 263k. Lower data could support the US dollar, allowing the GBP/USD pair to become more volatile.

The US dollar index (DXY), which measures the US dollar's performance against six major currencies, is currently up 0.37% at 97.011, having previously fallen as low as 96.218. Despite the significant rebound, the DXY remains below its 20-day moving average (EMA), indicating a bearish sentiment.