Scientific trade https://www.mql5.com/en/market/product/98467
An extremely convenient indicator that truly makes the process of making money on the exchange easy. It is based on the scientifically rigorous theory of the market developed by the author, the beginning of which is presented here.
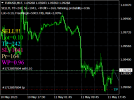
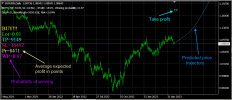
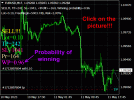
The indicator calculates the most probable price movement trajectory and displays it on the chart. Based on the predicted price movement trajectory, the indicator calculates the direction of the position and the position of the take profit. Based on the statistically calculated uncertainty of the trajectory of the predicted price movement, the selected risk level and the size of the deposit, the indicator also calculates the lot size and stop loss position. The averaging period of the indicator is selected based on the maximum probability of winning, which is presented for each period on the main chart of the trading terminal.
It is better to use M1-M15 timeframes in the indicator; at the same time, it is recommended to play according to the global trend, determined on H4, D1, i.e. if the indicator gives a SELL signal, then this position is opened when the global trend is down; if the indicator signal is BUY, then the position is opened when the global trend is up.
After choosing a timeframe, you sort through the averaging values like 20, 30, 40, …, 200 and look at the trading terminal at what value the maximum probability of winning is achieved. This is the value you should use. Since the averaging period of the indicator must be selected manually in the process of moving along the price history, the indicator readings in the tester cannot reflect the full effectiveness of its work and may be incorrect.
The operation of the indicator is based on predicting the market's own trends, so it is not recommended to use it before and immediately after strong news, as well as in case of strong market volatility, especially if the volatility is the result of crisis processes. The indicator's forecast period, which is its averaging period, should not go beyond the future moment of strong news release.
Before opening a position, you should only assess the state of the market and take into account news factors.
Everything else - position direction, lot size and stop orders - will be automatically calculated by the indicator for you. After that, you open a position, and then turn off the computer and do things that are pleasant for you.


