Sensitive Signal Indicator

Ivanov_Aleksei

Master Trader
Mar 4, 2018
192
1
79
sites.google.com
The Sensitive Signal (SS) indicator, using the filtering methods developed by the author, allows, with a high degree of probability, to establish the beginning of the true (filtered from interference - random price walks) trend movement. It is clear that such an indicator is very effective for trading on the currency exchange, where signals are highly distorted by random noise. The filtration developed by the author is carried out in several iterations and reveals the true trajectory of the regular price movement (more precisely, the most likely curve of such movement) and draws it.

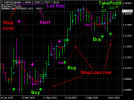
Indicator readings are visual, extremely simple and do not require comments. Blue triangles are located on the uptrend of the regular component of the price movement, red triangles - on the downward. Accordingly, entry points for Buy are where the blue triangles appear immediately behind the red triangles, and for Sell, the opposite. The level of sensitivity of the indicator is adjusted by setting «Select sensitivity level». At the same time, you need to understand that increasing the sensitivity level not only reduces the signal delay (which, in fact, is small for all levels), but increases the probability of issuing a false signal.


Indicator settings.

  • Price type - applied price. Values: Close price, Open price, High price, Low price, Median price ((high + low)/2 - default), Typical price ((high + low + close)/3), Weighted price ((high + low + 2*close)/4).
  • The averaging method - averaging method. Values: Simple, Exponential (default), Smoothed, Linear weighted.
  • The averaging period - - averaging period. Values: any integer (20 default).
  • Select sensitivity level - sensitivity level of the Indicator. Values: Low, Middle (default), High and Strongest.
  • Dimensions of markers – Dimensions of the markers. Values: any integer (2 default).
Screenshots.
1._USDCHFWeekly.png

3._GBPUSDH1.png

2._EURUSDDaily.png

5._CADCHFM30.png

4._AUDCHFH1.png

6._GBPUSDMonthly.png


Download or buy Sensitive Signal indicator can be on the link.
 

Ivanov_Aleksei

Master Trader
Mar 4, 2018
192
1
79
sites.google.com
In the latest (2.0) version of the indicator, all kinds of alerts have been added. The alert is activated when the indicator indications (for the trend direction) coincide on the last two bars.


Indicator settings.


  • Price type - applied price. Values: Close price, Open price, High price, Low price, Median price ((high + low)/2 - default), Typical price ((high + low + close)/3), Weighted price ((high + low + 2*close)/4).
  • The averaging method - averaging method. Values: Simple, Exponential (default), Smoothed, Linear weighted.
  • The averaging period - averaging period. Values: any integer (20 default).
  • Select sensitivity level - sensitivity level of the Indicator. Values: Low, Middle (default), High and Strongest.
  • Dimensions of markers – Dimensions of the markers. Values: any integer (2 default).
  • The Signal method - Type of trading signal alert. Values: No, Send alert, Print (in expert), Comment (in chart), Sound + Print, Sound + Comment, Sound.
 

Ivanov_Aleksei

Master Trader
Mar 4, 2018
192
1
79
sites.google.com
In the new version of the sensitivity signal 3.0 https://www.mql5.com/en/market/product/34171
(1) Added push and mail alert types.
(2) The number of signal identification methods have been introduced.

Indicator settings.


  • Price type - applied price. Values: Close price, Open price, High price, Low price, Median price ((high + low)/2 - default), Typical price ((high + low + close)/3), Weighted price ((high + low + 2*close)/4).
  • The averaging method - averaging method. Values: Simple, Exponential (default), Smoothed, Linear weighted.
  • The averaging period - averaging period. Values: any integer (20 default).
  • Select sensitivity level - sensitivity level of the Indicator. Values: Low, Middle (default), High and Strongest.
  • Dimensions of markers – Dimensions of the markers. Values: any integer (2 default).
  • Signal Identification Method - Values: By the last two bars (default), By closed candle, By closed candle and by the previous for it bar.
  • The Signal method - Type of trading signal alert. Values: No, Send alert, Print (in expert), Comment (in chart), Sound + Print, Sound + Comment, Sound, Push + Comment, Push, Mail + Comment, Mail.

EURUSDH1.png
 

Ivanov_Aleksei

Master Trader
Mar 4, 2018
192
1
79
sites.google.com
Sensitive Signal (new version)
EURUSDDaily.png


Sensitive Signal

The Sensitive Signal (SS) indicator, using the filtering methods developed by the author, allows, with a high degree of probability, to establish the beginning of the true (filtered from interference - random price walks) trend movement. It is clear that such an indicator is very effective for trading on the currency exchange, where signals are highly distorted by random noise. The filtration developed by the author is carried out in several iterations and reveals the true trajectory of the regular price movement (more precisely, the most likely curve of such movement) and draws it.
Indicator readings are visual, extremely simple and do not require comments. Blue triangles are located on the uptrend of the regular component of the price movement, red triangles - on the downward. Accordingly, entry points for Buy are where the blue triangles appear immediately behind the red triangles, and for Sell, the opposite. The level of sensitivity of the indicator is adjusted by setting « Select sensitivity level». At the same time, you need to understand that increasing the sensitivity level not only reduces the signal delay (which, in fact, is small for all levels), but increases the probability of issuing a false signal.

Possible moments of the change in the direction of price movement are also indicated by arrows.

The indicator has all kinds of alerts. Alert may be turned on: 1) if the indications of the indicator coincide (regarding the direction of the trend) on the last two bars; 2) on a closed candle; 3) on the closed candle and the bar preceding it.


Indicator settings.

  • Price type - applied price. Values: Close price, Open price, High price, Low price, Median price ((high + low)/2 - default), Typical price ((high + low + close)/3), Weighted price ((high + low + 2*close)/4).
  • The averaging method - averaging method. Values: Simple, Exponential (default), Smoothed, Linear weighted.
  • The averaging period - averaging period. Values: any integer (14 default).
  • Select sensitivity level - sensitivity level of the Indicator. Values: Low, Middle (default), High and Strongest.
  • Dimensions of markers – Dimensions of the markers. Values: any integer (2 default).
  • The display method - Values: Show trend arrows and show change trend arrows (default), Show only trend arrows, Show only change trend arrows.
  • Trend UP arrow color= DeepSkyBlue
  • Trend DOWN arrow color=Red
  • Down arrow color=Magenta
  • Up arrow color=Lime
  • Signal Identification Method - Values: By the last two bars (default), By closed candle, By closed candle and by the previous for it bar.
  • The Signal method - Type of trading signal alert. Values: No, Send alert, Print (in expert), Comment (in chart), Sound + Print, Sound + Comment, Sound, Push + Comment, Push, Mail + Comment, Mail.
 

Ivanov_Aleksei

Master Trader
Mar 4, 2018
192
1
79
sites.google.com
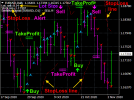
A new version (v5.0) of the Sensitive Signal indicator has been released.

1. Improved filtering algorithm for random market noise.

2. Based on the current distributions of the probability of prices and the given probability of obtaining unprofitable trades, the StopLoss lines were calculated and visualized.

3. Added the function of calculating the lot based on the size of the deposit, the permissible % loss level and the StopLoss position.EURUSDM1.png
 

Ivanov_Aleksei

Master Trader
Mar 4, 2018
192
1
79
sites.google.com

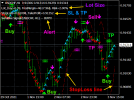
A new version (v.7.0) of the Sensitive Signal indicator has been published​


  1. The algorithm for calculating the lot has been improved, which is now calculated not only for forex, but also for CFDs and futures.
  2. Improved display of numerical data calculated by the indicator
USDCHFH1.png