The Parabolic SAR Oscillator in MT4 is a practical tool for identifying overbought and oversold zones, measuring momentum strength, and spotting early signs of a trend change. Unlike the classic Parabolic SAR that places dots directly on the price chart, this version transforms those signals into a clean oscillator panel below the chart.
Specifications


Specifications
- Categories: Oscillators, Momentum Indicators
- Platform: MetaTrader 4
- Skill Level: Intermediate
- Type: Reversal, Overbought/Oversold
- Timeframes: Multi-Timeframe
- Styles: Day Trading, Scalping, Swing Trading
- Markets: Forex, Crypto, Stocks
- Download: https://cdn.tradingfinder.com/file/480740/prabolic-sar-oscillator-indicator-mt4-by-tflab.zip

How It Works
The indicator plots two smooth lines, one green and one red, that shift as market momentum changes. When the oscillator enters extreme zones, red dots appear, signaling a higher chance of reversal. This design makes it easier to anticipate turning points compared to standard SAR dots.Bullish Example
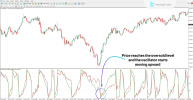
On the NZD/USD chart, the oscillator dipped into the oversold region and displayed a red dot. Shortly after, the rising slope of the lines confirmed bullish momentum and suggested a reversal to the upside.Bearish Example
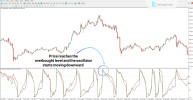
In a 1-hour ETH chart, the oscillator flagged an overbought condition with a red marker. Following this signal, the price declined, confirming bearish pressure and creating a short-selling opportunity.Settings
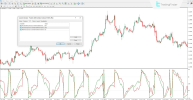
The Parabolic SAR Oscillator allows traders to fine-tune its behavior:- ⚡ Acceleration: Sets the starting speed of SAR calculations.
- Increment: Controls how acceleration grows as a trend extends.
- Maximum: Limits acceleration to avoid over-sensitivity.
Conclusion
By converting SAR dots into oscillator form, this indicator provides a clearer and more flexible view of momentum shifts. With adjustable parameters and multi-market support, it becomes a valuable tool for timing trade entries, exits, and reversals.


