Long-term and Short-term Setups

Tricia Wilson

Trader
Jul 8, 2020
218
4
19
43
NZD/USD Technical Analysis

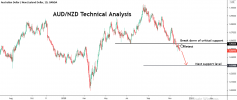
~~The counter was in a consolidation phase after a solid down move.
~~ The consolidation resembles a bearish flag pattern.
~~ Further, the entire setup could be interpreted as a head and shoulder pattern.
~~ Hence, we expect the pair to be bearish in the near-term.

NZDUSD.png
 

Tricia Wilson

Trader
Jul 8, 2020
218
4
19
43
EUR/USD Technical Analysis
~~ As we suggested earlier the counter is in an ABC correction and pushed down at the resistance zone.
~~Now, the bearish flag formation has also broken down, validating the wave C.
~~ Hence, we expect the pair to be bearish in the short-term.


EURUSD.png
 

Tricia Wilson

Trader
Jul 8, 2020
218
4
19
43
AUD/JPY Wave Analysis

~~The counter is currently in a long-term corrective ABC structure.
~~ It has completed wave A and is consolidating in a box structure at the low.
~~ We expect it to break upside and move to form wave B.

AUDJPY.png
 

Tricia Wilson

Trader
Jul 8, 2020
218
4
19
43
EUR/GBP Technical Analysis

~~ The upside movement of the pair is capped by a bearish trendline.
~~ It attempted a breakout but fizzled out and the price action has formed an H&S pattern instead.
~~ Hence, we expect the pair to be bearish in the near-term.

EURGBP.png
 

Tricia Wilson

Trader
Jul 8, 2020
218
4
19
43
EUR/USD Wave Analysis

~~ The counter had completed its long-term wave 4 with an ABC correction.
~~ It had bounced off from the lows strongly by crossing the resistance at 1.1706.
~~ Further, if the price sustains at a higher level for the day, it could be interpreted as a morning star formation.
~~ We expect the pair to race away to highs and complete the wave 5.

EURUSD.png
 

Tricia Wilson

Trader
Jul 8, 2020
218
4
19
43
USD/CAD Wave Analysis

~~ The counter has been consolidating in a sideways correction for the last few days.
~~ It could be interpreted as an ABC correction and the recent down move as wave B
~~ We expect the pair to find support in this zone head higher.

UADCAD.png
 

Tricia Wilson

Trader
Jul 8, 2020
218
4
19
43
EUR/CHF Technical Analysis

~~ The counter has formed a dragon pattern.
~~ In a downtrend, it made a 38% retracement from the low and then rendered a false breakout.
~~ Further, it is on the verge of breaking out the trendline (a break validates it).
~~ Hence, we advise traders to be long in the counter once it crosses 1.730.

EURCHF.png
 

Tricia Wilson

Trader
Jul 8, 2020
218
4
19
43
USD/CHF Wave Analysis

~~ The counter has been in a downtrend since the start of this year.
~~ The price was consolidating in a narrow for the last few months which could be interpreted as wave 4 of Elliott wave.
~~ Now it is on the brink of rendering a bearish breakout.
~~ We expect it to breakdown and complete wave 5.

USDCHF.png
 

Tricia Wilson

Trader
Jul 8, 2020
218
4
19
43
Crude Oil Wave Analysis

~~ The strong upmove from below zero levels in the crude oil was consolidating for the last few months.
~~ It could be interpreted as wave 4 of Elliot wave which also resembles a bullish flag pattern.
~~ We expect the pair to be strongly bullish after it crosses the resistance at 41.90.

crudeoil.png
 

Tricia Wilson

Trader
Jul 8, 2020
218
4
19
43
CAD/CHF Technical Analysis

~~ The counter has consolidated and formed a base at the lower.
~~ It could be interpreted as multiple inverted and shoulder patterns.
~~ Now, the pattern has broken out and hence we expect the pair to be bullish in the short-term.

CADCHF.png
 

Tricia Wilson

Trader
Jul 8, 2020
218
4
19
43
EUR/USD Technical Analysis
The hope (virus cure) rally has fizzled out.
The pair hit the rang top, formed a head and shoulder pattern, and has broken down now.
We expect the pair to hit the lower end of the range in the next few sessions.

eurusd_analysis_11.png
 

Tricia Wilson

Trader
Jul 8, 2020
218
4
19
43
GBP/JPY Technical Analysis

~~ The counter has been consolidating within a bearish flag pattern after the deep slide.
~~ It hit the upper parallel of the pattern and then made a strong sell-off.
~~ We expect the pair to move lower and break down in the short-term.

GBPJPY.png
 

Tricia Wilson

Trader
Jul 8, 2020
218
4
19
43
EUR/AUD Wave Analysis

~~ The counter is correcting in an ABCDE formation.
~~ It has completed wave D and is taking support at the trendline.
~~ We expect the pair to move higher to complete wave E.

EURAUD.png
 

Tricia Wilson

Trader
Jul 8, 2020
218
4
19
43
NZD/USD Wave Analysis

~~ The counter has completed a 5-wave bull cycle.
~~ It is now poised to make an ABC correction and break below the support 0.68655 validates it.
~~ Hence, we advise traders to go short after the support breaks.

NZDUSD.png
 

Tricia Wilson

Trader
Jul 8, 2020
218
4
19
43
USD/JPY Technical Analysis

~~ USD/JPY made a strong impulse move two weeks before.
~~ But the rally fizzled out at the high and since then the pair is retracing its move.
~~ Now, it has found support around the 103.7 mark.
~~ A move beyond the resistance 104.2 can invite bulls once again in this counter and hence we advise traders to go long as soon as the pair breaks above it.

USDJPY.png
 
  • 👍
Reactions: iamsam

Tricia Wilson

Trader
Jul 8, 2020
218
4
19
43
USD/CHF Technical Analysis

~~ The counter has been coiling within a 300 pip range.
~~ Now, it is at the lower end of the range and taking support.
~~ We expect the pair to head higher to the upper end of the range.


USDCHF.png
 

Tricia Wilson

Trader
Jul 8, 2020
218
4
19
43
EUR/GBP Technical Analysis

~~ The counter has been in a steady decline for the last 3 months.
~~ Now, it has hit a strong support level which could trigger some profit booking.
~~ Further, the stochastic indicator has given a buy signal by crossing over from the oversold zone.
~~ Hence, we expect the pair to be bullish in the short-term.
EURGBP.png
 

Tricia Wilson

Trader
Jul 8, 2020
218
4
19
43
AUD/CHF Wave Analysis

~~ The counter has been in a 5-wave bull cycle.
~~ Now, it is in the wave 4 phase which results in a bearish correction.
~~ Hence, we expect the pair to be bearish in the near-term.

AUDCHF.png
 
  • 👍
Reactions: iamsam

Tricia Wilson

Trader
Jul 8, 2020
218
4
19
43
AUD/NZD Technical Analysis

~~ The counter has been on a selling spree for the last 3 months.
~~ Now, it has broken down a critical support level of 1.05620 and retested it, validating the breakdown.
~~ Hence, we expect the pair to weaken further from here.
 

Attachments

  • AUDNZD.png
    AUDNZD.png
    27.4 KB · Views: 0
  • 👍
Reactions: iamsam

iamsam

Trader
Oct 12, 2020
24
12
9
32
AUD/NZD Technical Analysis

~~ The counter has been on a selling spree for the last 3 months.
~~ Now, it has broken down a critical support level of 1.05620 and retested it, validating the breakdown.
~~ Hence, we expect the pair to weaken further from here.
Thanks Tricia, this is solid :)
 
  • 👍
Reactions: Tricia Wilson