Long-term and Short-term Setups

Tricia Wilson

Trader
Jul 8, 2020
218
4
19
43
NZD/JPY Technical Analysis

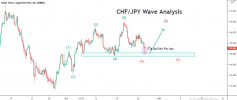
~~ The zone of 71.100-200 proves to be a tough nut for the pair.
~~ Despite multiple attempts, the price is unable to break above it.
~~ Further, the price action has formed an evening action star pattern at the resistance zone.
~~ Hence, we expect the pair to be bearish in the near-term.

NZDJPY.png
 

Tricia Wilson

Trader
Jul 8, 2020
218
4
19
43
NZD/USD Technical Analysis

~~ This counter currently trying to form a wedge formation.
~~ Now, it has formed an ascending triangle with in that & broken to move up further.
~~ Hence, we expect that it will be bullish upto the resistance line.

NZDUSD.png
 

Tricia Wilson

Trader
Jul 8, 2020
218
4
19
43
CAD/JPY Technical Analysis
  • The counter has formed a head and shoulder pattern.
  • It has broken the neckline with a strong bearish candle.
  • We expect the neckline to cap the upswing and push it down from here.
cadjpy_analysis.png
 

Tricia Wilson

Trader
Jul 8, 2020
218
4
19
43
AUD/CAD Technical Analysis

~~ The counter is currently trading around a strong resistance zone that triggered a sell-off previously.
~~ According to the wave, it has now completed the ABC correction for the down move it made.
~~ Further, the entire setup looks like a head and shoulder in the higher timeframes.
~~ Hence, we expect the pair to move down from here to the potential supportive trendline marked in the chart and if it is broken, it could trigger a larger sell-off.

AUDCAD.png
 

Tricia Wilson

Trader
Jul 8, 2020
218
4
19
43
USD/JPY Technical Analysis

~~ The counter is currently in a descending channel formation.
~~ It has made an inverted and cup and handle formation within that.
~~ Further, the price is currently hovering around a strong supply zone.
~~ Hence, we expect the pair to be bearish in the short-term.

USDJPY.png
 

Tricia Wilson

Trader
Jul 8, 2020
218
4
19
43
EUR/USD Technical Analysis

~~ This counter has formed a descending channel formation.
~~ It has taken the strong support as resistance & bounce back in downward direction.
~~ Hence, it will be bearish from here.

EURUSD.png
 

Tricia Wilson

Trader
Jul 8, 2020
218
4
19
43
BTC/USD Technical Analysis

~~ BTCUSD pair has been in the bullish movement.
~~ Now, it was consolidating @ 10894 after breaking the symmetrical triangle pattern.
~~ Hence, we are expecting that it will be rebound to the upward movement further in the near term.

BTCUSD.png
 

Tricia Wilson

Trader
Jul 8, 2020
218
4
19
43
USD/JPY Technical Analysis

~~The counter broke the resistance of 105.8 but was unable to sustain above it.
~~ It has then encountered a strong sell-off and has broken a bullish trendline.
~~ Hence, we expect the pair to be bearish in the near-term.

USDJPY.png
 

Tricia Wilson

Trader
Jul 8, 2020
218
4
19
43
AUD/CHF Wave Analysis

~~ As we suggested earlier, the counter is currently in an ABC and has moved down significantly.
~~ Now, it is forming a triangle in the short-term charts.
~~ We advise our users to either sell at the resistance of 0.665 or when the price breaks down below 0.651.

AUDCHF.png
 

iamsam

Trader
Oct 12, 2020
24
12
9
32
USD/JPY Technical Analysis

~~The counter broke the resistance of 105.8 but was unable to sustain above it.
~~ It has then encountered a strong sell-off and has broken a bullish trendline.
~~ Hence, we expect the pair to be bearish in the near-term.

View attachment 17079
Have you got a target prince in mind for UJ?
Appreciate you sharing your analysis, I had anticipated the support breaking on the back of some of the news these past few weeks - I'm just not sure where we're heading next and what to anticipate - guessing we're going to venture back to <104.XX
 

Tricia Wilson

Trader
Jul 8, 2020
218
4
19
43
EUR/JPY Technical Analysis

~~ The counter has made a retest of the broken head and shoulder neckline.
~~ It has made the retracement in the form of a bearish flag and has broken down from it.
~~ Further, it has crossed critical support of 123.9 and hence we expect the pair to be bearish in the short-term.

EURJPY.png
 

Tricia Wilson

Trader
Jul 8, 2020
218
4
19
43
NZD/USD Technical Analysis

~~ The counter has formed a double top pattern in the short-term.
~~ Further, it has broken down with a strong bearish candle.
~~ The formation interpreted a solid distribution around 0.667 levels.
~~ Hence, we expect the pair to slide down from here.

NZDUSD.png
 

Tricia Wilson

Trader
Jul 8, 2020
218
4
19
43
BTC/USD Wave Analysis

~~ Bitcoin has been in a bullish correction for the last few days.
~~ The limping move to the upside could be interpreted as wave B.
~~ Now, we expect a wave C move to the downside.

BTCUSD.png
 

Tricia Wilson

Trader
Jul 8, 2020
218
4
19
43
EUR/USD Wave Analysis

~~ The counter is currently forming an ABC correction.
~~ It is now in its second leg which is of the wxy wave form.
~~ Now, the pair is making a bullish move to complete the wave y and hence we expect the pair to be bullish in the near-term.


EURUSD.png
 

Tricia Wilson

Trader
Jul 8, 2020
218
4
19
43
USD/CHF Wave Analysis

~~ The counter is currently in an ABC correction.
~~ It is now in its final stage for wave B looking out for support.
~~ We expect the pair to find its support around the current price point and head higher.

USDCHF.png
 

Tricia Wilson

Trader
Jul 8, 2020
218
4
19
43
AUD/USD Wave Analysis

~~ The counter is currently forming an ABC correction.
~~ It has completed the w and x waves of the wave B and is now moving up to form a wave y.
~~ Hence, we expect the pair to be bullish in the near-term.

AUDUSD.png
 

Tricia Wilson

Trader
Jul 8, 2020
218
4
19
43
EUR/USD Technical Analysis

~~ As we mentioned in our previous post, 1.18700 is a strong resistance for EUR/USD.
~~ Now, it has formed a head and shoulder pattern at the zone and is coming down strongly.
~~ The next support is only at 1.17500 and we expect a free ride to bears till then.

EURUSD.png
 

Tricia Wilson

Trader
Jul 8, 2020
218
4
19
43
AUD/CHF Wave Analysis

~~ After completing a bearish cycle, the counter is limping up to complete ABC correction.
~~ It is forming a wave A in the form of a bearish flag.
~~ We expect it to render a bearish breakout to form wave B.

AUDCHF.png
 

Tricia Wilson

Trader
Jul 8, 2020
218
4
19
43
USD/CAD Technical Analysis

~~ The counter has bounced off strongly from the support 1.31, after trapping the bears with a fakeout.
~~ Now, it has taken down a bearish trendline as well.
~~Hence, we expect the pair to be bullish in the short-term.

USDCAD.png
 

Tricia Wilson

Trader
Jul 8, 2020
218
4
19
43
CHF/JPY Wave Analysis

~~ After completing a 5-wave bull cycle, the counter is currently in an ABC correction phase.
~~ It is now at a strong price action support zone and at the final stage of wave A.
~~ Hence, we expect the pair to be bullish in the near-term.
 

Attachments

  • CHFJPY.png
    CHFJPY.png
    25.5 KB · Views: 0