Demand zones and POC

lucacrebbe

Active Trader
Jun 26, 2017
108
1
32
44
Hello I was watching this chart :
https://preview.redd.it/y2rysnu7qcx...bp&s=d0f83430750c8441f27f6c532b7b1bbe17f87e45
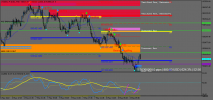
How should I behave in this situations? Here there are 2 POCs (point of control)... one is up and the other one is down (demand zone)as you can see... and the price hit it and now it's chopping there
The minor POC is above the VWAP the greater POC is below the vwap

My question is: Which POC should I consider the most ? The most recent?

Also I have another question: Why is that zone classified as ''demand zone'' ? I have seen this graph on a forum so I didn't know who to ask this thing. Why is that a demand zone?
 

Enivid

Administrator
Staff member
Nov 30, 2008
18,535
1,355
144
Odesa
www.earnforex.com
I would say that there is only one POC - the lower one. Because POC is defined as the longest line of TPO's. As for it being a demand zone, I find this whole detection of supply and demand zones via TA rather ineffectual. We could speculate that this zone is a zone of demand because the price stopped falling and stalled there. But it could be so that the real supply is concentrated at levels above 45 and the real demand is concentrated at levels below 5. And what we see near the drawn "demand zone" is just some trades that couldn't be postponed.
 
  • 👍
Reactions: Zuki

Zuki

Trader
Jul 28, 2021
61
0
22
38
I would say that there is only one POC - the lower one. Because POC is defined as the longest line of TPO's. As for it being a demand zone, I find this whole detection of supply and demand zones via TA rather ineffectual. We could speculate that this zone is a zone of demand because the price stopped falling and stalled there. But it could be so that the real supply is concentrated at levels above 45 and the real demand is concentrated at levels below 5. And what we see near the drawn "demand zone" is just some trades that couldn't be postponed.
Hi Admin can you develop the shvd supply and demand zone indicator in an Advanced supply and demand zone indicator since the source code is available?


Develop a dashboard like settings that display from Month to M1 timeframe with option to hide or show timeframe.

Distance price away from each zones using pips and % /percentage .

Display the zone above and below current market price for each timeframe. Either verified or Proven along with the untested support and resistance in the direction of price.

The level of imbalance that created the zone would be displayed

An arrow that show direction of price base on which zone price trading away from.

If demand zone is in control of price for a timeframe identity with D and if supply is control identity with S .

Using verified and proven Support/Resistance .
Verified Support =1 blue color
Proven Support = 2 green color

Verified Resistance = 1 Red color
Proven Resistance = 2 Maroon color

Once these zones are formed they are in control of current market price

The untested Support grey color and resistance orange color.


EURUSD m154.png image show the dashboard like concept.

Volatility 75 m1 image shows the shvd supply and demand zone indicator identifying the zones.

With the dashboard advanced supply and demand method would Automatically display which zones are in control of current market price.

If daily demand zone is control of current market for that timeframe and H1 supply is in control we then know to trade into Daily demand zone.
 

Attachments

  • EURUSDM154.png
    EURUSDM154.png
    43.7 KB · Views: 7
  • Volatility 75 IndexM15.png
    Volatility 75 IndexM15.png
    47.9 KB · Views: 8
  • shved_supply_and_demand_v1.2 (1).mq5
    35.3 KB · Views: 5