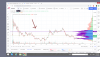
in this chart where is the POC? The point with maximum price exchange? at 2.68?
I have questions:
https://i.ibb.co/gWCkShH/lincquestion.png
1) why doesn't this POC follow a normal distribution? The point where most volumes traded is shifted upward
2) What do the red colored areas of the side volume indicator bars (right to side) indicate? Do the sellers indicate? But I know that for every seller there is a buyer ... so why in some cases and at some prices does the purchase volume exceed that of the sale? (look for example at the bar at 2.68 $ ... it's all volume in purchase ... on sale there is nothing .... but then who did they buy those who had orders at 2.68 $ from?
This is not the volume actually traded but are they only sell or buy orders?
3) what are the most discolored extreme areas on the right and left? Are there areas where there are fewer buy or sell orders?
4) how do you think the price will behave? will it fluctuate between the two points where the price has been beaten the most by using them as support and resistance?
To have a breac out of those points ... what should happen? what other indicator could help identify a resistance breac out?